
How is Tornado Strength Measured in the United States?
In the United States, tornado strength is measured using the Enhanced Fujita (EF) Scale. This scale rates tornadoes based on the damage they cause to human-built structures and vegetation. Here’s how it works:
Enhanced Fujita (EF) Scale
The EF Scale classifies tornadoes into six categories, from EF0 to EF5, with EF0 being the weakest and EF5 being the strongest. Each category corresponds to a range of wind speeds and expected damage.
EF Scale Categories:
- EF0:
- Wind speeds: 65-85 mph (105-137 km/h)
- Damage: Light damage, such as broken tree branches, minor roof damage, and shallow-rooted trees pushed over.
- EF1:
- Wind speeds: 86-110 mph (138-177 km/h)
- Damage: Moderate damage, including more significant roof damage, windows broken, and mobile homes pushed off foundations or overturned.
- EF2:
- Wind speeds: 111-135 mph (178-217 km/h)
- Damage: Considerable damage, with roofs torn off well-constructed houses, large trees snapped or uprooted, and light-object missiles generated.
- EF3:
- Wind speeds: 136-165 mph (218-266 km/h)
- Damage: Severe damage, including entire stories of well-constructed houses destroyed, significant structural damage to large buildings, and trees debarked.
- EF4:
- Wind speeds: 166-200 mph (267-322 km/h)
- Damage: Devastating damage, with well-constructed houses leveled, structures with weak foundations blown away some distance, and cars thrown and large missiles generated.
- EF5:
- Wind speeds: Over 200 mph (over 322 km/h)
- Damage: Incredible damage, with strong frame houses completely leveled off foundations and swept away, steel-reinforced concrete structures badly damaged, and high-rise buildings with significant structural deformation.
Process of Rating a Tornado:
- Damage Survey: After a tornado occurs, a team of meteorologists and engineers conducts a detailed survey of the damage.
- Analysis: They analyze the damage in the context of the type of structures and vegetation affected.
- Rating Assignment: Based on the observed damage and the estimated wind speeds required to cause such damage, an EF rating is assigned to the tornado.
The EF Scale was introduced in 2007, replacing the original Fujita (F) Scale, to provide more accurate assessments of tornado strength based on improvements in understanding wind damage and structural engineering.
Some more Tornado facts:
10 Highest Wind Speeds Observed In A Tornado
| Location | Date | Official rating | Minimum peak wind speed | Maximum peak wind speed |
|---|---|---|---|---|
| Bridge Creek, Oklahoma | May 3, 1999 | F5 | 281 mph (452 km/h) | 321 mph (517 km/h) |
| El Reno, Oklahoma | May 31, 2013 | EF3 | 291 mph (468 km/h) | 336 mph (541 km/h) |
| Greenfield, Iowa | May 21, 2024 | EF4 | 309 mph (497 km/h) | 318 mph (512 km/h) |
| Hinton, Oklahoma | May 24, 2011 | EF5 | 289 mph (465 km/h) | 296 mph (476 km/h) |
| Ceres, Oklahoma | April 26, 1991 | F4 | 268 mph (431 km/h) | 280 mph (450 km/h) |
| Goshen County, Wyoming | June 5, 2009 | EF2 | — | 271 mph (436 km/h) |
| Spencer, South Dakota | May 30, 1998 | F4 | 234 mph (377 km/h) | 266 mph (428 km/h) |
| Bennington, Kansas | May 28, 2013 | EF3 | — | 264 mph (425 km/h) |
| Mulhall, Oklahoma | May 3, 1999 | F4 | 246 mph (396 km/h) | 299 mph (481 km/h) |
25 Deadliest Tornadoes In US History
| Tornado Name (location) | Date | Deaths |
|---|---|---|
| "Tri-State" (Missouri, Illinois and Indiana) | March 18, 1925 | 695 |
| Natchez, Mississippi | May 6, 1840 | 317 |
| St. Louis, Missouri/East St. Louis, Illinois | May 27, 1896 | 255 |
| Tupelo, Mississippi | April 5, 1936 | 216 |
| Gainesville, Georgia | April 6, 1936 | 203 |
| Woodward, Oklahoma | April 9, 1947 | 184 |
| Joplin, Missouri | May 22, 2011 | 158 |
| Amite, Louisiana/Purvis, Mississippi | April 24, 1908 | 143 |
| New Richmond, Wisconsin | June 12, 1899 | 117 |
| Flint, Michigan | June 8, 1953 | 116 |
| Louisville, Kentucky | March 27, 1890 | 115 |
| Waco, Texas | May 11, 1953 | 114 |
| Goliad, Texas | May 18, 1902 | 114 |
| Omaha, Nebraska | March 23, 1913 | 103 |
| Mattoon, Illinois | May 26, 1917 | 101 |
| Shinnston, West Virginia | June 23, 1944 | 100 |
| Marshfield, Missouri | April 18, 1880 | 99 |
| Gainesville–Holland, Georgia | June 1, 1903 | 98 |
| Poplar Bluff, Missouri | May 9, 1927 | 98 |
| Snyder, Oklahoma | May 10, 1905 | 97 |
| Worcester, Massachusetts | June 9, 1953 | 94 |
| Camanche, Iowa | June 3, 1860 | 92 |
| Natchez, Mississippi | April 24, 1908 | 91 |
| Starkville, Mississippi/Waco, Alabama | April 20, 1920 | 88 |
| Lorain–Sandusky, Ohio | June 28, 1924 | 85 |
Deadliest Tornado In Each US State
| State | Location | Date | Deaths |
|---|---|---|---|
| Alabama | Many towns | April 27, 2011 | 72 |
| Arizona | San Xavier Mission Indian Village | August 27, 1964 | 2 |
| Arkansas | Fort Smith / Warren | January 11, 1898 / January 3, 1949 | 55 |
| Colorado | Thurman | August 10, 1924 | 10 |
| Connecticut | Wallingford | August 9, 1878 | 34 |
| Delaware | Hartly | July 21, 1983 | 2 |
| Florida | Kissimmee | February 22, 1998 | 25 |
| Georgia | Gainesville | April 6, 1936 | 203 |
| Idaho | Ruebens | June 7, 1936 | 2 |
| Illinois | Many towns | March 18, 1925 | 613 |
| Indiana | Many towns | March 18, 1925 | 71 |
| Iowa | Dewitt/Camanche | June 3, 1860 | 73 |
| Kansas | Udall | May 25, 1955 | 80 |
| Kentucky | Louisville | March 27, 1890 | 76 |
| Louisiana | Gilliam | May 13, 1908 | 49 |
| Maine | Winthrop / Caribou | July 8, 1890 / August 11, 1954 | 1 |
| Maryland | La Plata | November 9, 1926 | 16 |
| Massachusetts | Worcester | June 9, 1953 | 94 |
| Michigan | Flint | June 8, 1953 | 116 |
| Minnesota | St. Cloud/Sauk Rapids | April 14, 1886 | 72 |
| Mississippi | Natchez | May 7, 1840 | 317 |
| Missouri | Joplin | May 22, 2011 | 158 |
| Montana | Rivulet / Reserve | June 10, 1923 / July 26, 2010 | 2 |
| Nebraska | Omaha | March 23, 1913 | 101 |
| New Hampshire | Corydon | September 9, 1821 | 6 |
| New Jersey | New Brunswick | June 19, 1835 | 5 |
| New Mexico | Wagon Mound / Clovis | May 30, 1930 / March 23, 2007 | 2 |
| New York | Coldenham | November 16, 1989 | 9 |
| North Carolina | Philadelphia | February 19, 1884 | 23 |
| North Dakota | Fargo | June 20, 1957 | 10 |
| Ohio | Lorain/Sandusky | June 28, 1924 | 85 |
| Oklahoma | Woodward | April 9, 1947 | 113 |
| Oregon | Lexington / Long Creek | June 14, 1888 / June 3, 1894 | 3 |
| Pennsylvania | Many towns | June 23, 1944 | 26 |
| South Carolina | Aiken/Timmonsville | April 30, 1924 | 53 |
| South Dakota | Wilmot | June 17, 1944 | 8 |
| Tennessee | Henderson | March 21, 1952 | 38 |
| Texas | Goliad / Waco | May 18, 1902 / May 11, 1953 | 114 |
| Utah | Salt Lake City | August 11, 1999 | 1 |
| Virginia | Rye Cove | May 2, 1929 | 13 |
| Washington | Vancouver | April 5, 1972 | 6 |
| West Virginia | Many towns | June 23, 1944 | 100 |
| Wisconsin | New Richmond | June 12, 1899 | 117 |
| Wyoming | Wheatland / Wright | June 25, 1942 / August 12, 2005 | 2 |
“Note: The table above Only includes deaths in the specified state; some tornadoes caused additional deaths across state lines.”
What states have no recorded deaths from Tornados?
The following states have no recorded deaths from Tornados: Alaska, California, Hawaii, Nevada, Rhode Island and Vermont.
Most Expensive Tornados in US History
| Area affected | Date | Nominal cost (millions USD) | Inflation-adjusted cost (millions 2023 USD) |
|---|---|---|---|
| Joplin, Missouri | May 22, 2011 | $2,800 | $3,792 |
| Tuscaloosa, Alabama | April 27, 2011 | $2,450 | $3,318 |
| Moore, Oklahoma | May 20, 2013 | $2,000 | $2,616 |
| Topeka, Kansas | June 8, 1966 | $250 | $2,348 |
| Lubbock, Texas | May 11, 1970 | $250 | $1,961 |
| Dallas, Texas | October 20, 2019 | $1,550 | $1,847 |
| Oklahoma City metro, Oklahoma | May 3, 1999 | $1,000 | $1,829 |
| Nashville, Tennessee | March 3, 2020 | $1,504 | $1,771 |
| Hackleburg–Phil Campbell, Alabama | April 27, 2011 | $1,290 | $1,747 |
| Wichita Falls, Texas | April 10, 1979 | $400 | $1,679 |
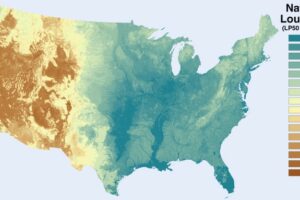
Location of US Tornadoes
and also this meme:
The United States experiences more tornadoes than any other country primarily because of its unique geography and atmospheric setup.
The key factor is the broad, unobstructed interior of North America, especially the region known as Tornado Alley. This area sits between the Rocky Mountains to the west and the Appalachian Mountains to the east, creating a vast, flat corridor where air masses can collide without significant barriers.
Tornadoes typically form when warm, moist air meets cool, dry air under conditions of strong wind shear.
In the U.S., warm, humid air flows northward from the Gulf of Mexico, while cold, dry air descends from Canada. At the same time, hot, dry air often moves eastward from the deserts of the Southwest. These contrasting air masses frequently collide over the central plains, creating highly unstable atmospheric conditions.
Another critical factor is wind shear, changes in wind speed and direction with height.
The U.S. often experiences strong jet stream activity overhead, which helps organize thunderstorms into rotating supercells, the type most likely to produce tornadoes. Few other regions in the world consistently combine all these ingredients: moisture, instability, lift, and wind shear.
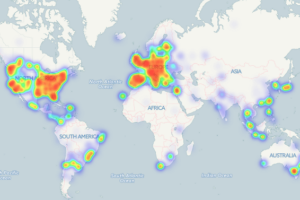
While tornadoes do occur in places like Bangladesh, Argentina, and parts of Europe, those regions either lack the same scale of open terrain or the consistent interaction of these air masses.


Tim H says
You completely missed the Xenia tornado of April, 1974. It wasn’t the deadliest or the most costly but wins were estimated at well over 300 mile an hour. Dr. Ted Fujita actually considered this one of two tornadoes (found this in another document) but was later downgraded to an F5 as a scale only goes that high.