
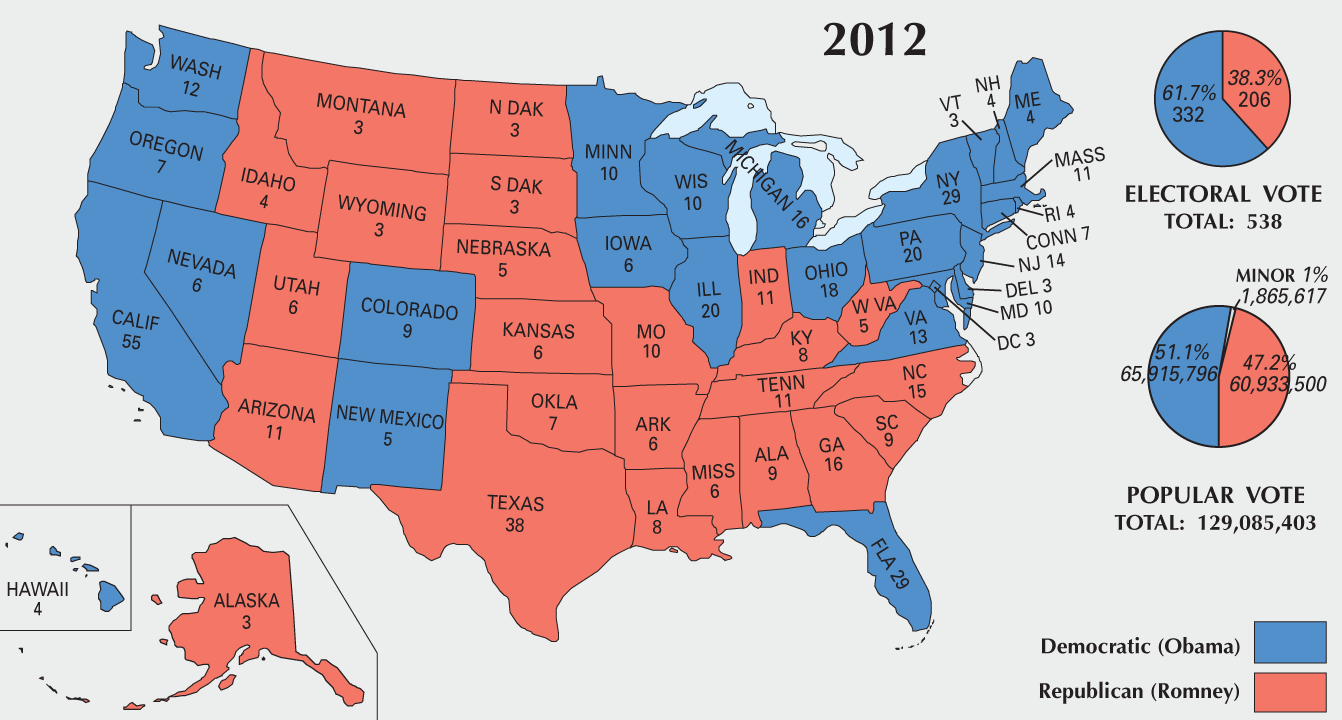
The map above shows the result of the 2012 US presidential election between Barack Obama and Mitt Romney. Turnout for the election was 58.60%.
Here are the key details:
| Winner: | Runner-Up: | |
|---|---|---|
| Name: | Barack Obama | Mitt Romney |
| Political Party: | Democratic | Republican |
| Home state: | Illinois | Massachusetts |
| VP Name: | Joe Biden | Paul Ryan |
| States: Won (Out of 51): | 27 | 24 |
| Electoral College Votes (out of 538): | 332 | 206 |
| Percentage of Popular Vote | 51.06% | 47.20% |
| Total Votes | 65,915,795 | 60,933,504 |
| Margin % | 3.86% | – |
| Margin (votes) | 4,982,291 | – |
Other Parties
| 3rd Place | 4th Place: | |
|---|---|---|
| Name: | Gary Johnson | Jill Stein |
| Political Party | Libertarian | Green |
| Electoral College Votes | 0 | 0 |
| Number of Votes: | 1,275,971 | 469,627 |
| Percentage of Popular Vote: | 0.99% | 0.36% |
Key Issues of The 2012 Election
The 2012 U.S. presidential election was primarily contested between the incumbent President Barack Obama, a Democrat, and the Republican challenger, former Massachusetts Governor Mitt Romney.
The key issues of the 2012 election included:
2012 Election Results Map By County

2012 Map From The National Atlas of the United States (now sadly permanently offline)
Other US Presidential Election Maps: