
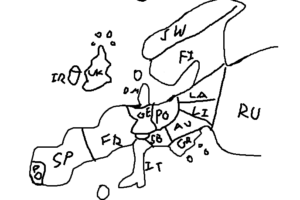
The map above shows the huge difference in taxes placed on unleaded gasoline (aka petrol) between US States, Canadian Provinces and European countries.
Taxes range from a high in the Netherlands of $3.23 per US Gallon ($0.85 per litre) to a low of just $0.27 per US Gallon ($0.07 per Litre) in Alaska.
The European country average is $2.24 per gallon or $0.59 per litre, the Canadian average is $1.20 per gallon or $0.32 per litre, and the US average is $0.51 per gallon or $0.13 per litre.
The map at the top of the page is in US Gallons and the one below is in Litres.

The data for the US comes from the U.S. Energy Information Administration and includes both state and federal taxes.
The data for Canada comes from Wikipedia and includes federal and provincial taxes plus carbon and sales taxes.
And finally the data for Europe comes from the Tax Foundation and only show excise taxes and does not include VAT where it is charged.
Here are some larger maps to see the differences more clearly, followed by the full data used to make them:
Gas Taxes Per Gallon In US & Canada In USD

Gas Taxes Per Litre In US & Canada In USD

Petrol Taxes Per Gallon In Europe In USD

Petrol Taxes Per Litre In Europe In USD

| Country/State/Province | Gas Tax per Gallon in USD | Gas Tax per Litre in USD |
|---|---|---|
| Netherlands | $3.23 | $0.85 |
| Italy | $2.98 | $0.79 |
| Greece | $2.86 | $0.76 |
| Denmark | $2.80 | $0.74 |
| Finland | $2.80 | $0.74 |
| France | $2.79 | $0.74 |
| Germany | $2.68 | $0.71 |
| United Kingdom | $2.56 | $0.68 |
| Ireland | $2.48 | $0.66 |
| Belgium | $2.46 | $0.65 |
| Portugal | $2.37 | $0.63 |
| Estonia | $2.30 | $0.61 |
| Luxembourg | $2.25 | $0.59 |
| European Average | $2.24 | $0.59 |
| Slovenia | $2.16 | $0.57 |
| Czech Republic | $2.15 | $0.57 |
| Slovakia | $2.10 | $0.55 |
| Latvia | $2.08 | $0.55 |
| Spain | $2.06 | $0.54 |
| Sweden | $2.02 | $0.53 |
| Austria | $1.97 | $0.52 |
| Romania | $1.96 | $0.52 |
| Lithuania | $1.91 | $0.50 |
| Croatia | $1.87 | $0.49 |
| Cyprus | $1.76 | $0.46 |
| Hungary | $1.61 | $0.43 |
| Poland | $1.60 | $0.42 |
| Bulgaria | $1.49 | $0.39 |
| Malta | $1.47 | $0.39 |
| Nova Scotia | $1.40 | $0.37 |
| Newfoundland and Labrador | $1.37 | $0.36 |
| Saskatchewan | $1.27 | $0.33 |
| New Brunswick | $1.25 | $0.33 |
| British Columbia | $1.25 | $0.33 |
| Alberta | $1.21 | $0.32 |
| Canadian Average | $1.20 | $0.32 |
| Prince Edward Island | $1.17 | $0.31 |
| Ontario | $1.17 | $0.31 |
| Northwest Territories | $1.14 | $0.30 |
| Nunavut | $1.01 | $0.27 |
| Yukon | $1.01 | $0.27 |
| Quebec | $0.95 | $0.25 |
| California | $0.88 | $0.23 |
| Manitoba | $0.88 | $0.23 |
| Illinois | $0.86 | $0.23 |
| Pennsylvania | $0.77 | $0.20 |
| Indiana | $0.75 | $0.20 |
| Washington | $0.71 | $0.19 |
| Michigan | $0.68 | $0.18 |
| Maryland | $0.65 | $0.17 |
| New Jersey | $0.61 | $0.16 |
| North Carolina | $0.59 | $0.16 |
| Virginia | $0.59 | $0.16 |
| Oregon | $0.58 | $0.15 |
| Florida | $0.57 | $0.15 |
| Ohio | $0.57 | $0.15 |
| Rhode Island | $0.57 | $0.15 |
| Utah | $0.56 | $0.15 |
| West Virginia | $0.54 | $0.14 |
| District of Columbia | $0.53 | $0.14 |
| Montana | $0.52 | $0.14 |
| Georgia | $0.51 | $0.14 |
| Idaho | $0.51 | $0.14 |
| Wisconsin | $0.51 | $0.14 |
| Vermont | $0.51 | $0.13 |
| US Average | $0.51 | $0.13 |
| Maine | $0.50 | $0.13 |
| Nebraska | $0.49 | $0.13 |
| Alabama | $0.49 | $0.13 |
| Iowa | $0.48 | $0.13 |
| South Dakota | $0.48 | $0.13 |
| Minnesota | $0.47 | $0.12 |
| South Carolina | $0.47 | $0.12 |
| Colorado | $0.47 | $0.12 |
| Kentucky | $0.46 | $0.12 |
| Missouri | $0.46 | $0.12 |
| Tennessee | $0.46 | $0.12 |
| Massachusetts | $0.46 | $0.12 |
| New York | $0.44 | $0.12 |
| Kansas | $0.43 | $0.11 |
| Arkansas | $0.43 | $0.11 |
| Connecticut | $0.43 | $0.11 |
| Wyoming | $0.42 | $0.11 |
| New Hampshire | $0.42 | $0.11 |
| Nevada | $0.42 | $0.11 |
| North Dakota | $0.41 | $0.11 |
| Delaware | $0.41 | $0.11 |
| Louisiana | $0.39 | $0.10 |
| Oklahoma | $0.38 | $0.10 |
| Texas | $0.38 | $0.10 |
| Arizona | $0.37 | $0.10 |
| New Mexico | $0.37 | $0.10 |
| Hawaii | $0.37 | $0.10 |
| Mississippi | $0.37 | $0.10 |
| Alaska | $0.27 | $0.07 |
Do you think gas/petrol taxes are too high or low where you live?


JJ Martinez says
These numbers do not make sense. I see you’re including VAT but still most place around New York State are between three to four dollars a gallon. In Europe for instance, if you were really talking gallons, it would more in the region in the region of the 6 to 10 dollars. This would make more sense if we were talking price per liter.
Martin says
European prices are incorrect. By half or so.