
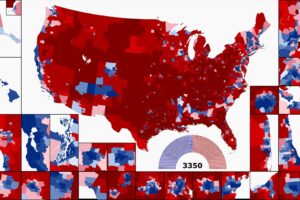
The map above shows the number of gun deaths per million people in each US and Mexican state and other countries in North and Central America, excluding suicides.
Cuba and Canada are at the bottom of the list, whereas several Mexican states are at the top.
For the US as a whole it was 44.8, but the UK the rate is 0.19.
The data for this map comes from the Institute for Health Metrics and Evaluation and is from 2021 for all ages and both sexes.
You can see the data for each cause below:
- Physical violence by firearm: Being shot and killed and someone else
- Unintentional firearm injuries: Being accidentally killed by a gun
- Self-harm by firearm: Suicide
All of them are rates per million people.
| Country/State | Physical violence by firearm | Unintentional firearm injuries | Self-harm by firearm | Total |
|---|---|---|---|---|
| Colima | 536.23 | 5.76 | 10.93 | 552.92 |
| Chihuahua | 500.35 | 13.41 | 12.87 | 526.63 |
| Baja California | 465.46 | 14.95 | 5.06 | 485.47 |
| Venezuela | 402.58 | 35.41 | 29.47 | 467.46 |
| Guanajuato | 443.06 | 4.61 | 7.30 | 454.98 |
| Michoacán | 425.50 | 9.59 | 10.34 | 445.43 |
| Guerrero | 416.89 | 7.58 | 3.80 | 428.26 |
| El Salvador | 409.44 | 2.68 | 1.70 | 413.81 |
| Morelos | 398.97 | 6.63 | 5.41 | 411.00 |
| Zacatecas | 361.05 | 7.08 | 12.46 | 380.59 |
| Sonora | 350.07 | 8.35 | 9.62 | 368.05 |
| Sinaloa | 321.16 | 9.38 | 5.51 | 336.04 |
| United States Virgin Islands | 249.96 | 6.47 | 19.51 | 275.94 |
| Oaxaca | 249.64 | 4.61 | 2.97 | 257.22 |
| Jalisco | 225.78 | 4.82 | 7.39 | 237.99 |
| Mexico | 226.19 | 5.85 | 5.44 | 237.48 |
| Bahamas | 231.02 | 0.85 | 1.38 | 233.25 |
| Nayarit | 213.47 | 7.47 | 5.99 | 226.93 |
| Mississippi | 107.78 | 6.75 | 111.44 | 225.97 |
| Guatemala | 183.14 | 38.61 | 3.81 | 225.56 |
| Louisiana | 109.13 | 3.66 | 106.59 | 219.37 |
| Colombia | 204.20 | 1.82 | 7.02 | 213.04 |
| Jamaica | 185.06 | 24.02 | 3.74 | 212.82 |
| Tamaulipas | 199.17 | 4.01 | 7.13 | 210.31 |
| Honduras | 197.04 | 6.84 | 6.32 | 210.21 |
| Quintana Roo | 201.53 | 5.14 | 3.40 | 210.07 |
| Alaska | 45.06 | 9.73 | 148.77 | 203.56 |
| Alabama | 86.53 | 5.19 | 111.14 | 202.86 |
| Trinidad and Tobago | 191.79 | 2.41 | 2.10 | 196.31 |
| New Mexico | 59.63 | 2.35 | 132.36 | 194.34 |
| Arkansas | 65.32 | 4.27 | 123.52 | 193.10 |
| Puerto Rico | 176.28 | 2.10 | 10.97 | 189.35 |
| Missouri | 73.84 | 2.78 | 108.42 | 185.04 |
| Tennessee | 68.44 | 4.10 | 112.24 | 184.78 |
| Wyoming | 17.87 | 3.26 | 162.67 | 183.81 |
| Tabasco | 175.37 | 2.73 | 3.71 | 181.81 |
| Mexico City | 169.40 | 4.23 | 7.24 | 180.87 |
| South Carolina | 73.20 | 3.14 | 103.67 | 180.01 |
| Durango | 160.46 | 11.40 | 7.37 | 179.22 |
| Oklahoma | 53.85 | 2.80 | 121.46 | 178.11 |
| San Luis Potosi | 167.08 | 4.80 | 5.97 | 177.84 |
| Veracruz de Ignacio de la Llave | 165.50 | 8.93 | 3.40 | 177.82 |
| Montana | 20.20 | 3.11 | 151.08 | 174.39 |
| Greenland | 19.74 | 5.68 | 146.96 | 172.39 |
| West Virginia | 40.99 | 3.26 | 127.23 | 171.48 |
| Mexico | 161.23 | 4.58 | 2.99 | 168.80 |
| Arizona | 42.98 | 1.98 | 119.98 | 164.93 |
| Puebla | 157.70 | 3.90 | 3.08 | 164.68 |
| Nevada | 41.66 | 1.56 | 118.39 | 161.61 |
| Nuevo Leon | 153.38 | 2.66 | 5.16 | 161.20 |
| Kentucky | 44.59 | 4.39 | 111.42 | 160.40 |
| District of Columbia | 139.32 | 0.74 | 17.64 | 157.71 |
| Georgia | 62.26 | 2.18 | 93.20 | 157.64 |
| Maryland | 76.22 | 0.67 | 80.07 | 156.96 |
| Baja California Sur | 139.38 | 2.13 | 8.36 | 149.87 |
| Belize | 117.81 | 19.36 | 4.31 | 141.49 |
| Indiana | 50.38 | 2.27 | 86.50 | 139.15 |
| Haiti | 112.14 | 23.21 | 3.38 | 138.72 |
| Colorado | 26.91 | 1.39 | 109.59 | 137.89 |
| Idaho | 13.33 | 2.57 | 121.82 | 137.72 |
| Florida | 47.35 | 1.00 | 88.23 | 136.59 |
| North Carolina | 51.29 | 2.36 | 81.61 | 135.27 |
| Kansas | 33.68 | 2.10 | 97.56 | 133.34 |
| Hidalgo | 122.17 | 4.73 | 4.20 | 131.10 |
| Saint Kitts and Nevis | 107.89 | 21.92 | 0.30 | 130.11 |
| Ohio | 45.23 | 1.61 | 82.32 | 129.16 |
| Oregon | 18.64 | 1.50 | 108.25 | 128.38 |
| Texas | 44.74 | 1.98 | 80.84 | 127.56 |
| Michigan | 46.92 | 0.99 | 79.38 | 127.29 |
| Saint Vincent and the Grenadines | 115.68 | 10.30 | 0.97 | 126.95 |
| Virginia | 40.87 | 1.37 | 81.11 | 123.35 |
| United States of America | 43.12 | 1.68 | 76.11 | 120.92 |
| Dominican Republic | 105.40 | 8.59 | 6.87 | 120.86 |
| Coahuila | 106.35 | 4.78 | 6.46 | 117.59 |
| Maine | 11.46 | 0.95 | 105.06 | 117.47 |
| South Dakota | 14.77 | 2.97 | 98.26 | 116.00 |
| Pennsylvania | 40.65 | 1.21 | 74.03 | 115.89 |
| Vermont | 12.41 | 1.15 | 102.19 | 115.75 |
| Utah | 13.89 | 0.87 | 98.69 | 113.45 |
| Illinois | 62.68 | 1.10 | 45.27 | 109.05 |
| Guyana | 99.36 | 4.21 | 3.47 | 107.05 |
| Washington | 21.56 | 1.01 | 82.46 | 105.03 |
| Tlaxcala | 97.07 | 3.36 | 3.05 | 103.48 |
| North Dakota | 12.47 | 1.87 | 88.27 | 102.61 |
| Panama | 97.62 | 1.05 | 2.19 | 100.86 |
| Costa Rica | 88.65 | 1.14 | 10.34 | 100.14 |
| Delaware | 38.17 | 1.04 | 60.69 | 99.89 |
| Nebraska | 19.78 | 2.11 | 77.61 | 99.50 |
| Wisconsin | 23.82 | 1.14 | 73.84 | 98.80 |
| Chiapas | 90.80 | 5.71 | 1.49 | 98.00 |
| Saint Lucia | 82.92 | 12.09 | 1.61 | 96.62 |
| New Hampshire | 9.71 | 0.91 | 82.86 | 93.48 |
| Campeche | 84.61 | 3.22 | 5.30 | 93.14 |
| Querétaro | 81.93 | 2.45 | 4.43 | 88.81 |
| Iowa | 13.52 | 1.28 | 72.52 | 87.33 |
| California | 36.29 | 0.99 | 45.70 | 82.98 |
| Minnesota | 16.36 | 0.92 | 64.49 | 81.77 |
| Aguascalientes | 62.11 | 2.72 | 4.78 | 69.61 |
| Connecticut | 21.46 | 1.00 | 36.27 | 58.73 |
| Barbados | 41.34 | 5.33 | 2.29 | 48.96 |
| Suriname | 34.17 | 6.25 | 8.43 | 48.85 |
| New York | 22.06 | 0.63 | 25.98 | 48.67 |
| New Jersey | 23.78 | 0.59 | 21.74 | 46.12 |
| Hawaii | 12.48 | 0.73 | 31.95 | 45.16 |
| Nicaragua | 37.64 | 4.12 | 2.78 | 44.55 |
| Rhode Island | 14.27 | 0.30 | 29.09 | 43.66 |
| Antigua and Barbuda | 12.64 | 29.66 | 0.25 | 42.54 |
| Massachusetts | 14.16 | 0.39 | 21.96 | 36.51 |
| Yucatán | 29.98 | 2.38 | 2.54 | 34.90 |
| Dominica | 29.12 | 4.16 | 1.00 | 34.28 |
| Canada | 5.67 | 0.47 | 18.58 | 24.72 |
| Bermuda | 13.76 | 0.94 | 0.30 | 15.00 |
| Grenada | 4.86 | 8.64 | 0.08 | 13.58 |
| Cuba | 4.25 | 1.40 | 2.97 | 8.62 |
Also see: Gun Deaths By Country In Europe and Gun Deaths In South America
Why do you think the rates in Canada is so much lower than the US, and why is the UK so much lower than Canada?


Don Salisbury says
I am curious. Is there a correlation between total deaths by homicide and distance from the equator? Or does a multivariate analysis show any such impact?
Politically, moving away from the equator, populations become more “liberal.”