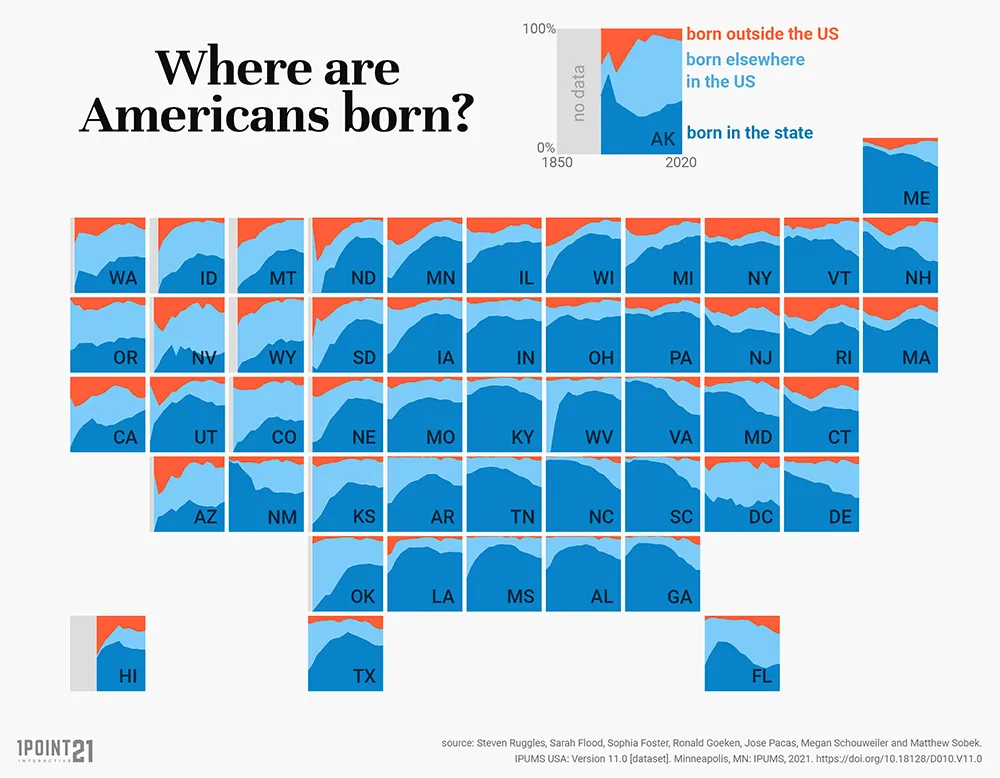
The map above shows a really interesting breakdown of where Americans come from in each state over time between 1850 and 2020. Some states have almost no foreign born residents, while other have loads.
In 2020, fewer than 2% of West Virginians were foreign born compared to 28% of Californians. And in Wyoming 53% of state residents were born in the US, but outside the state.
Full data here:
| Year | State | Foreign | Home State | Other US State |
|---|---|---|---|---|
| 1850 | Alabama | 2% | 55% | 44% |
| 1950 | Alabama | 1% | 88% | 11% |
| 2020 | Alabama | 4% | 69% | 27% |
| 2020 | Alaska | 10% | 43% | 47% |
| 1950 | Arizona | 7% | 38% | 54% |
| 2020 | Arizona | 14% | 40% | 46% |
| 1850 | Arkansas | 1% | 37% | 61% |
| 1950 | Arkansas | 1% | 77% | 22% |
| 2020 | Arkansas | 5% | 62% | 33% |
| 1850 | California | 28% | 5% | 67% |
| 1950 | California | 11% | 37% | 52% |
| 2020 | California | 28% | 56% | 16% |
| 1950 | Colorado | 6% | 46% | 48% |
| 2020 | Colorado | 11% | 42% | 47% |
| 1850 | Connecticut | 10% | 78% | 12% |
| 1950 | Connecticut | 16% | 60% | 24% |
| 2020 | Connecticut | 18% | 54% | 28% |
| 1850 | Delaware | 5% | 82% | 13% |
| 1950 | Delaware | 5% | 62% | 33% |
| 2020 | Delaware | 10% | 45% | 44% |
| 1850 | District of Columbia | 13% | 52% | 35% |
| 1950 | District of Columbia | 7% | 33% | 60% |
| 2020 | District of Columbia | 14% | 33% | 52% |
| 1850 | Florida | 7% | 33% | 60% |
| 1950 | Florida | 6% | 43% | 51% |
| 2020 | Florida | 24% | 36% | 39% |
| 1850 | Georgia | 1% | 73% | 26% |
| 1950 | Georgia | 1% | 85% | 14% |
| 2020 | Georgia | 12% | 55% | 33% |
| 2020 | Hawaii | 20% | 55% | 24% |
| 1950 | Idaho | 5% | 48% | 48% |
| 2020 | Idaho | 7% | 45% | 48% |
| 1850 | Illinois | 13% | 40% | 47% |
| 1950 | Illinois | 10% | 67% | 23% |
| 2020 | Illinois | 15% | 67% | 18% |
| 1850 | Indiana | 6% | 51% | 43% |
| 1950 | Indiana | 3% | 73% | 24% |
| 2020 | Indiana | 6% | 68% | 26% |
| 1850 | Iowa | 12% | 24% | 64% |
| 1950 | Iowa | 4% | 78% | 19% |
| 2020 | Iowa | 6% | 71% | 23% |
| 1950 | Kansas | 3% | 66% | 31% |
| 2020 | Kansas | 8% | 60% | 33% |
| 1850 | Kentucky | 4% | 76% | 20% |
| 1950 | Kentucky | 1% | 87% | 12% |
| 2020 | Kentucky | 5% | 68% | 27% |
| 1850 | Louisiana | 26% | 49% | 25% |
| 1950 | Louisiana | 2% | 84% | 15% |
| 2020 | Louisiana | 4% | 78% | 18% |
| 1850 | Maine | 5% | 89% | 6% |
| 1950 | Maine | 9% | 79% | 12% |
| 2020 | Maine | 5% | 61% | 34% |
| 1850 | Maryland | 12% | 79% | 9% |
| 1950 | Maryland | 4% | 62% | 33% |
| 2020 | Maryland | 17% | 47% | 36% |
| 1850 | Massachusetts | 18% | 69% | 13% |
| 1950 | Massachusetts | 16% | 70% | 13% |
| 2020 | Massachusetts | 20% | 59% | 21% |
| 1850 | Michigan | 12% | 34% | 54% |
| 1950 | Michigan | 10% | 64% | 25% |
| 2020 | Michigan | 8% | 77% | 16% |
| 1850 | Minnesota | 29% | 21% | 50% |
| 1950 | Minnesota | 8% | 73% | 19% |
| 2020 | Minnesota | 8% | 68% | 23% |
| 1850 | Mississippi | 1% | 43% | 56% |
| 1950 | Mississippi | 1% | 89% | 10% |
| 2020 | Mississippi | 3% | 71% | 26% |
| 1850 | Missouri | 12% | 44% | 43% |
| 1950 | Missouri | 3% | 72% | 24% |
| 2020 | Missouri | 5% | 66% | 29% |
| 1950 | Montana | 9% | 52% | 40% |
| 2020 | Montana | 3% | 53% | 44% |
| 1950 | Nebraska | 5% | 71% | 24% |
| 2020 | Nebraska | 9% | 64% | 27% |
| 1950 | Nevada | 8% | 25% | 67% |
| 2020 | Nevada | 21% | 27% | 52% |
| 1850 | New Hampshire | 3% | 82% | 15% |
| 1950 | New Hampshire | 11% | 62% | 27% |
| 2020 | New Hampshire | 7% | 41% | 52% |
| 1850 | New Jersey | 11% | 78% | 10% |
| 1950 | New Jersey | 14% | 59% | 28% |
| 2020 | New Jersey | 25% | 52% | 23% |
| 1850 | New Mexico | 4% | 95% | 1% |
| 1950 | New Mexico | 4% | 53% | 43% |
| 2020 | New Mexico | 10% | 53% | 37% |
| 1850 | New York | 21% | 69% | 9% |
| 1950 | New York | 21% | 66% | 13% |
| 2020 | New York | 25% | 63% | 12% |
| 1850 | North Carolina | 1% | 95% | 4% |
| 1950 | North Carolina | 1% | 87% | 12% |
| 2020 | North Carolina | 9% | 55% | 36% |
| 1950 | North Dakota | 8% | 71% | 21% |
| 2020 | North Dakota | 6% | 62% | 32% |
| 1850 | Ohio | 11% | 60% | 29% |
| 1950 | Ohio | 6% | 71% | 23% |
| 2020 | Ohio | 6% | 75% | 19% |
| 1950 | Oklahoma | 2% | 60% | 38% |
| 2020 | Oklahoma | 7% | 60% | 33% |
| 1850 | Oregon | 3% | 29% | 68% |
| 1950 | Oregon | 6% | 40% | 54% |
| 2020 | Oregon | 11% | 46% | 44% |
| 1850 | Pennsylvania | 13% | 78% | 8% |
| 1950 | Pennsylvania | 9% | 80% | 11% |
| 2020 | Pennsylvania | 9% | 72% | 19% |
| 1850 | Rhode Island | 21% | 68% | 11% |
| 1950 | Rhode Island | 15% | 64% | 21% |
| 2020 | Rhode Island | 18% | 54% | 28% |
| 1850 | South Carolina | 2% | 93% | 5% |
| 1950 | South Carolina | 1% | 87% | 11% |
| 2020 | South Carolina | 6% | 55% | 39% |
| 1950 | South Dakota | 5% | 67% | 28% |
| 2020 | South Dakota | 4% | 64% | 32% |
| 1850 | Tennessee | 1% | 76% | 23% |
| 1950 | Tennessee | 1% | 80% | 19% |
| 2020 | Tennessee | 6% | 59% | 36% |
| 1850 | Texas | 11% | 27% | 63% |
| 1950 | Texas | 4% | 75% | 20% |
| 2020 | Texas | 18% | 60% | 22% |
| 1850 | Utah | 10% | 12% | 77% |
| 1950 | Utah | 5% | 75% | 20% |
| 2020 | Utah | 9% | 63% | 29% |
| 1850 | Vermont | 11% | 71% | 18% |
| 1950 | Vermont | 8% | 71% | 21% |
| 2020 | Vermont | 6% | 47% | 47% |
| 1850 | Virginia | 1% | 94% | 4% |
| 1950 | Virginia | 2% | 74% | 24% |
| 2020 | Virginia | 14% | 49% | 37% |
| 1950 | Washington | 10% | 41% | 49% |
| 2020 | Washington | 16% | 47% | 36% |
| 1850 | West Virginia | 5% | 0% | 95% |
| 1950 | West Virginia | 2% | 81% | 17% |
| 2020 | West Virginia | 2% | 69% | 29% |
| 1850 | Wisconsin | 39% | 17% | 44% |
| 1950 | Wisconsin | 7% | 79% | 14% |
| 2020 | Wisconsin | 6% | 71% | 23% |
| 1950 | Wyoming | 6% | 37% | 58% |
| 2020 | Wyoming | 4% | 42% | 53% |



Leave a Reply