
The map above looks at the most vegetarian and vegan friendly US states based on the number of restaurants per million people. Just looking at the map you can see a clear coastal bias for these restaurants compared to more inland states.
Here’s the breakdown by State:
| Rank | State | Population | Total vegan & vegetarian restaurants | Vegan & vegetarian restaurants per million |
|---|---|---|---|---|
| 1 | District of Columbia | 705,749 | 38 | 54 |
| 2 | Hawaii | 1,415,872 | 72 | 51 |
| 3 | Oregon | 4,217,737 | 113 | 27 |
| 4 | New York | 19,453,561 | 375 | 19 |
| 5 | California | 39,512,223 | 697 | 18 |
| 6 | Vermont | 623,989 | 11 | 18 |
| 7 | New Jersey | 8,882,190 | 152 | 17 |
| 8 | Massachusetts | 6,892,503 | 114 | 17 |
| 9 | Rhode Island | 1,059,361 | 16 | 15 |
| 10 | Nevada | 3,080,156 | 43 | 14 |
| 11 | Maine | 1,344,212 | 16 | 12 |
| 12 | Washington | 7,614,893 | 89 | 12 |
| 13 | Florida | 21,477,737 | 228 | 11 |
| 14 | Connecticut | 3,565,287 | 35 | 10 |
| 15 | Arizona | 7,278,717 | 70 | 10 |
| 16 | New Hampshire | 1,359,711 | 12 | 9 |
| 17 | Illinois | 12,671,821 | 106 | 8 |
| 18 | Delaware | 973,764 | 8 | 8 |
| 19 | Colorado | 5,758,736 | 47 | 8 |
| 20 | Maryland | 6,045,680 | 48 | 8 |
| 21 | Georgia | 10,617,423 | 84 | 8 |
| 22 | Pennsylvania | 12,801,989 | 100 | 8 |
| 23 | Utah | 3,205,958 | 22 | 7 |
| 24 | Michigan | 9,986,857 | 68 | 7 |
| 25 | Tennessee | 6,829,174 | 46 | 7 |
| 26 | Virginia | 8,535,519 | 57 | 7 |
| 27 | New Mexico | 2,096,829 | 14 | 7 |
| 28 | Ohio | 11,689,100 | 76 | 7 |
| 29 | Texas | 28,995,881 | 188 | 6 |
| 30 | North Carolina | 10,488,084 | 62 | 6 |
| 31 | West Virginia | 1,792,147 | 10 | 6 |
| 32 | South Carolina | 5,148,714 | 25 | 5 |
| 33 | Iowa | 3,155,070 | 15 | 5 |
| 34 | Missouri | 6,137,428 | 29 | 5 |
| 35 | Minnesota | 5,639,632 | 26 | 5 |
| 36 | Kentucky | 4,467,673 | 20 | 4 |
| 37 | Wisconsin | 5,822,434 | 26 | 4 |
| 38 | Montana | 1,068,778 | 4 | 4 |
| 39 | Nebraska | 1,934,408 | 7 | 4 |
| 40 | Louisiana | 4,648,794 | 16 | 3 |
| 41 | Indiana | 6,732,219 | 23 | 3 |
| 42 | Idaho | 1,787,065 | 6 | 3 |
| 43 | Alaska | 731,545 | 2 | 3 |
| 44 | North Dakota | 762,062 | 2 | 3 |
| 45 | Oklahoma | 3,956,971 | 10 | 3 |
| 46 | Arkansas | 3,017,804 | 6 | 2 |
| 47 | Wyoming | 578,759 | 1 | 2 |
| 48 | Kansas | 2,913,314 | 5 | 2 |
| 49 | Mississippi | 2,976,149 | 5 | 2 |
| 50 | Alabama | 4,903,185 | 8 | 2 |
| 51 | South Dakota | 884,659 | 1 | 1 |
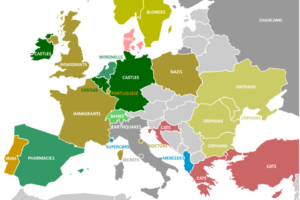
The data comes from Happy Cow and was for 2020. You can see how Europe compares below:
Map Of The Most Vegetarian & Vegan-Friendly Countries In Europe
Why do you think vegetarianism and veganism are so concentrated on the coasts?


Leave a Reply