
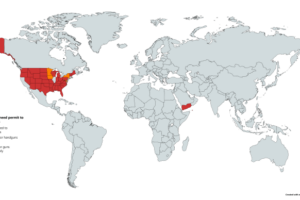
The map above shows the percentage of single mother run households with children there are in each state. It ranges from a low of 9% in Utah to a high of 24% in Mississippi and 29% in Washington DC.
The data comes from the 2022 American Community Survey 5-year estimates from US Census Bureau.
Here is the full data by state:
Percentages:
| State | Percentage of households with single parents | Percentage of households with single mothers | Percentage of households with single fathers | Percentage of households that are married-couple parents |
|---|---|---|---|---|
| D.C. | 33.3% | 29.1% | 8.5% | 49.9% |
| Mississippi | 27.4% | 23.9% | 6.8% | 51.2% |
| Louisiana | 27.2% | 22.9% | 8.4% | 51.9% |
| Georgia | 24.2% | 20.5% | 6.5% | 57.3% |
| New Mexico | 24.1% | 18.7% | 10.7% | 50.2% |
| South Carolina | 23.9% | 20.3% | 6.4% | 56.2% |
| Delaware | 23.8% | 18.8% | 9.0% | 55.2% |
| Rhode Island | 23.8% | 19.4% | 7.6% | 57.1% |
| Alabama | 23.7% | 20.0% | 6.7% | 56.6% |
| Arkansas | 23.3% | 19.0% | 7.4% | 57.5% |
| Ohio | 23.2% | 18.7% | 7.8% | 57.9% |
| Nevada | 23.1% | 17.4% | 10.3% | 55.4% |
| North Carolina | 22.7% | 18.7% | 6.7% | 59.3% |
| Tennessee | 22.5% | 18.1% | 7.7% | 57.8% |
| Florida | 22.2% | 18.0% | 7.4% | 57.1% |
| Michigan | 21.9% | 17.3% | 7.7% | 60.5% |
| Oklahoma | 21.7% | 16.7% | 8.5% | 59.0% |
| Connecticut | 21.5% | 17.8% | 6.0% | 62.7% |
| New York | 21.5% | 17.9% | 5.8% | 60.0% |
| Pennsylvania | 21.4% | 17.0% | 7.3% | 60.5% |
| Maryland | 21.4% | 17.5% | 6.4% | 60.9% |
| Indiana | 21.2% | 16.6% | 7.7% | 60.0% |
| Missouri | 21.2% | 16.5% | 7.7% | 60.5% |
| Kentucky | 21.1% | 16.5% | 8.1% | 57.7% |
| Wisconsin | 20.9% | 15.6% | 8.6% | 62.7% |
| Illinois | 20.7% | 17.0% | 6.0% | 62.1% |
| Texas | 20.7% | 17.0% | 6.0% | 61.5% |
| Arizona | 20.5% | 15.7% | 8.3% | 57.9% |
| Massachusetts | 20.3% | 16.7% | 5.7% | 63.8% |
| Vermont | 19.9% | 14.4% | 8.7% | 62.7% |
| Virginia | 19.7% | 15.8% | 6.1% | 64.1% |
| West Virginia | 19.5% | 15.2% | 7.3% | 57.6% |
| Iowa | 19.4% | 14.8% | 7.1% | 64.7% |
| Nebraska | 19.0% | 14.3% | 7.1% | 66.0% |
| Kansas | 18.9% | 14.3% | 7.1% | 65.0% |
| Oregon | 18.8% | 14.1% | 7.5% | 63.2% |
| Montana | 18.3% | 12.8% | 8.5% | 64.6% |
| South Dakota | 18.2% | 13.7% | 7.0% | 64.7% |
| New Jersey | 18.1% | 15.0% | 4.8% | 66.3% |
| Minnesota | 18.1% | 13.5% | 6.8% | 66.9% |
| Colorado | 18.0% | 13.0% | 7.4% | 67.3% |
| Maine | 17.9% | 13.4% | 7.2% | 62.6% |
| Alaska | 17.7% | 12.6% | 8.2% | 62.4% |
| North Dakota | 17.6% | 13.0% | 6.7% | 68.5% |
| California | 17.4% | 13.6% | 6.1% | 62.3% |
| Washington | 16.9% | 12.7% | 6.3% | 65.8% |
| Wyoming | 16.9% | 11.9% | 7.4% | 67.3% |
| New Hampshire | 16.3% | 12.2% | 6.1% | 65.9% |
| Idaho | 15.3% | 10.8% | 6.6% | 68.9% |
| Hawaii | 14.8% | 11.1% | 6.3% | 58.4% |
| Utah | 12.8% | 9.4% | 4.7% | 74.0% |
Interestingly, the states with the highest share of Single Fathers is very different to that of single mothers, with New Mexico Nevada, and Delaware all at rates of over 9%.
Absolute Numbers:
| State | Total Households with one or more people under 18 | Number of Households Married with children under 18 | Number of Households Cohabiting couple with children under 18 | Number of Households Female householder, no partner with children under 18 | Number of Households Male householder, no partner with children under 18 |
|---|---|---|---|---|---|
| D.C. | 61,992 | 30,929 | 2,580 | 18,047 | 2,627 |
| Mississippi | 355,179 | 181,788 | 21,284 | 85,045 | 12,438 |
| Louisiana | 541,709 | 281,246 | 43,715 | 123,860 | 23,571 |
| Georgia | 1,280,171 | 733,565 | 79,032 | 262,143 | 47,849 |
| New Mexico | 232,365 | 116,678 | 26,930 | 43,472 | 12,534 |
| South Carolina | 580,739 | 326,554 | 39,835 | 118,007 | 20,998 |
| Delaware | 106,791 | 58,960 | 9,093 | 20,117 | 5,320 |
| Rhode Island | 118,016 | 67,363 | 10,966 | 22,932 | 5,152 |
| Alabama | 567,058 | 321,090 | 32,357 | 113,277 | 21,393 |
| Arkansas | 363,642 | 209,038 | 25,129 | 69,122 | 15,522 |
| Ohio | 1,364,252 | 789,959 | 120,728 | 254,482 | 61,995 |
| Nevada | 350,004 | 194,077 | 33,032 | 60,736 | 20,003 |
| North Carolina | 1,218,725 | 722,891 | 84,635 | 228,238 | 48,436 |
| Tennessee | 808,658 | 467,704 | 55,573 | 146,158 | 36,018 |
| Florida | 2,227,426 | 1,272,584 | 190,691 | 401,829 | 93,757 |
| Michigan | 1,110,029 | 671,804 | 92,136 | 191,812 | 51,446 |
| Oklahoma | 483,568 | 285,118 | 37,667 | 80,713 | 24,289 |
| Connecticut | 410,168 | 257,122 | 30,158 | 72,836 | 15,459 |
| New York | 2,150,793 | 1,290,623 | 153,972 | 386,065 | 75,445 |
| Pennsylvania | 1,428,537 | 864,621 | 116,203 | 243,138 | 63,063 |
| Maryland | 723,835 | 440,869 | 48,228 | 126,763 | 28,202 |
| Indiana | 801,917 | 481,355 | 67,818 | 133,074 | 36,853 |
| Missouri | 708,287 | 428,467 | 56,500 | 117,058 | 32,989 |
| Kentucky | 536,701 | 309,536 | 42,999 | 88,385 | 24,953 |
| Wisconsin | 653,677 | 409,900 | 59,212 | 101,683 | 35,110 |
| Illinois | 1,463,560 | 908,600 | 105,167 | 248,976 | 54,410 |
| Texas | 3,734,897 | 2,298,602 | 246,627 | 633,636 | 138,840 |
| Arizona | 824,034 | 477,016 | 78,695 | 129,291 | 39,682 |
| Massachusetts | 779,816 | 497,804 | 53,364 | 130,100 | 28,159 |
| Vermont | 63,960 | 40,082 | 5,895 | 9,201 | 3,503 |
| Virginia | 1,010,937 | 647,536 | 60,377 | 159,659 | 39,279 |
| West Virginia | 186,454 | 107,450 | 16,179 | 28,404 | 7,876 |
| Iowa | 372,448 | 241,033 | 33,656 | 55,148 | 17,054 |
| Nebraska | 238,621 | 157,565 | 18,721 | 34,160 | 11,248 |
| Kansas | 350,615 | 228,049 | 25,565 | 50,018 | 16,105 |
| Oregon | 465,591 | 294,206 | 41,102 | 65,422 | 22,015 |
| Montana | 115,751 | 74,801 | 9,039 | 14,818 | 6,389 |
| South Dakota | 103,306 | 66,843 | 8,492 | 14,190 | 4,663 |
| New Jersey | 1,087,329 | 720,426 | 72,863 | 162,878 | 34,356 |
| Minnesota | 664,163 | 444,289 | 55,309 | 89,970 | 30,093 |
| Colorado | 670,852 | 451,421 | 39,924 | 87,489 | 33,471 |
| Maine | 140,617 | 87,982 | 14,681 | 18,825 | 6,304 |
| Alaska | 86,528 | 53,960 | 7,788 | 10,903 | 4,433 |
| North Dakota | 89,005 | 60,932 | 6,835 | 11,580 | 4,086 |
| California | 4,433,837 | 2,762,776 | 345,763 | 601,899 | 169,901 |
| Washington | 894,754 | 588,901 | 75,364 | 114,061 | 37,133 |
| Wyoming | 67,590 | 45,518 | 5,449 | 8,035 | 3,364 |
| New Hampshire | 145,097 | 95,586 | 12,399 | 17,772 | 5,868 |
| Idaho | 217,374 | 149,775 | 15,343 | 23,503 | 9,815 |
| Hawaii | 148,602 | 86,767 | 11,414 | 16,486 | 5,489 |
| Utah | 416,492 | 308,270 | 18,337 | 39,025 | 14,459 |
Also interesting to note that Texas (and not California) has the highest number of single mother households at 633,636 with California having the most single father households in total.
Data was compiled by The Badger Institute.
Why do you think there is such variation between states?


Carlo Parson says
Please post an update to this map for years from now.