
The map above shows the congressional election where the most Republicans won seats (1920) and the where the Democrats won the most seats (just 16 years later in 1936).
In 1920, the Republicans won 302 seats compared to just 131 for the Democrats. But in 1936 the Democrats surpassed the Republican high-water mark winning 334 seats to just 88 for the Republicans (Progressives also 7 seats and 3 went to Farmer–Labor).
Here are the totals for all states for both years:
1920
| State | Democratic 1920 | Republican 1920 | Others 1920 | Total Seats 1920 |
|---|---|---|---|---|
| Alabama | 10 | 0 | 0 | 10 |
| Arizona | 1 | 0 | 0 | 1 |
| Arkansas | 7 | 0 | 0 | 7 |
| California | 2 | 9 | 0 | 11 |
| Colorado | 1 | 3 | 0 | 4 |
| Connecticut | 0 | 5 | 0 | 5 |
| Delaware | 0 | 1 | 0 | 1 |
| Florida | 4 | 0 | 0 | 4 |
| Georgia | 12 | 0 | 0 | 12 |
| Idaho | 0 | 2 | 0 | 2 |
| Illinois | 3 | 24 | 0 | 27 |
| Indiana | 0 | 13 | 0 | 13 |
| Iowa | 0 | 11 | 0 | 11 |
| Kansas | 0 | 8 | 0 | 8 |
| Kentucky | 8 | 3 | 0 | 11 |
| Louisiana | 8 | 0 | 0 | 8 |
| Maine | 0 | 4 | 0 | 4 |
| Maryland | 2 | 4 | 0 | 6 |
| Massachusetts | 2 | 14 | 0 | 16 |
| Michigan | 0 | 13 | 0 | 13 |
| Minnesota | 0 | 10 | 0 | 10 |
| Mississippi | 8 | 0 | 0 | 8 |
| Missouri | 2 | 14 | 0 | 16 |
| Montana | 0 | 2 | 0 | 2 |
| Nebraska | 0 | 6 | 0 | 6 |
| Nevada | 0 | 1 | 0 | 1 |
| New Hampshire | 0 | 2 | 0 | 2 |
| New Jersey | 1 | 11 | 0 | 12 |
| New Mexico | 0 | 1 | 0 | 1 |
| New York | 9 | 33 | 1 | 43 |
| North Carolina | 10 | 0 | 0 | 10 |
| North Dakota | 0 | 3 | 0 | 3 |
| Ohio | 0 | 22 | 0 | 22 |
| Oklahoma | 3 | 5 | 0 | 8 |
| Oregon | 0 | 3 | 0 | 3 |
| Pennsylvania | 1 | 35 | 0 | 36 |
| Rhode Island | 0 | 3 | 0 | 3 |
| South Carolina | 7 | 0 | 0 | 7 |
| South Dakota | 0 | 3 | 0 | 3 |
| Tennessee | 5 | 5 | 0 | 10 |
| Texas | 17 | 1 | 0 | 18 |
| Utah | 0 | 2 | 0 | 2 |
| Vermont | 0 | 2 | 0 | 2 |
| Virginia | 9 | 1 | 0 | 10 |
| Washington | 0 | 5 | 0 | 5 |
| West Virginia | 0 | 6 | 0 | 6 |
| Wisconsin | 0 | 11 | 0 | 11 |
| Wyoming | 0 | 1 | 0 | 1 |
| Total | 132 | 302 | 1 | 435 |
1936
| State | Democratic 1936 | Republican 1936 | Other 1936 | Total Seats 1936 |
|---|---|---|---|---|
| Alabama | 9 | 0 | 0 | 9 |
| Arizona | 1 | 0 | 0 | 1 |
| Arkansas | 7 | 0 | 0 | 7 |
| California | 15 | 4 | 1 (Prog) | 20 |
| Colorado | 4 | 0 | 0 | 4 |
| Connecticut | 6 | 0 | 0 | 6 |
| Delaware | 1 | 0 | 0 | 1 |
| Florida | 5 | 0 | 0 | 5 |
| Georgia | 10 | 0 | 0 | 10 |
| Idaho | 2 | 0 | 0 | 2 |
| Illinois | 21 | 6 | 0 | 27 |
| Indiana | 11 | 1 | 0 | 12 |
| Iowa | 5 | 4 | 0 | 9 |
| Kansas | 2 | 5 | 0 | 7 |
| Kentucky | 8 | 1 | 0 | 9 |
| Louisiana | 8 | 0 | 0 | 8 |
| Maine | 0 | 3 | 0 | 3 |
| Maryland | 6 | 0 | 0 | 6 |
| Massachusetts | 5 | 10 | 0 | 15 |
| Michigan | 8 | 9 | 0 | 17 |
| Minnesota | 1 | 3 | 5 (F-L) | 9 |
| Mississippi | 7 | 0 | 0 | 7 |
| Missouri | 12 | 1 | 0 | 13 |
| Montana | 2 | 0 | 0 | 2 |
| Nebraska | 4 | 1 | 0 | 5 |
| Nevada | 1 | 0 | 0 | 1 |
| New Hampshire | 1 | 1 | 0 | 2 |
| New Jersey | 7 | 7 | 0 | 14 |
| New Mexico | 1 | 0 | 0 | 1 |
| New York | 29 | 16 | 0 | 45 |
| North Carolina | 11 | 0 | 0 | 11 |
| North Dakota | 0 | 2 | 0 | 2 |
| Ohio | 22 | 2 | 0 | 24 |
| Oklahoma | 9 | 0 | 0 | 9 |
| Oregon | 2 | 1 | 0 | 3 |
| Pennsylvania | 27 | 7 | 0 | 34 |
| Rhode Island | 2 | 0 | 0 | 2 |
| South Carolina | 6 | 0 | 0 | 6 |
| South Dakota | 1 | 1 | 0 | 2 |
| Tennessee | 7 | 2 | 0 | 9 |
| Texas | 21 | 0 | 0 | 21 |
| Utah | 2 | 0 | 0 | 2 |
| Vermont | 0 | 1 | 0 | 1 |
| Virginia | 9 | 0 | 0 | 9 |
| Washington | 6 | 0 | 0 | 6 |
| West Virginia | 6 | 0 | 0 | 6 |
| Wisconsin | 3 | 0 | 7 (Prog) | 10 |
| Wyoming | 1 | 0 | 0 | 1 |
| TOTALS | 334 | 88 | 13 | 435 |
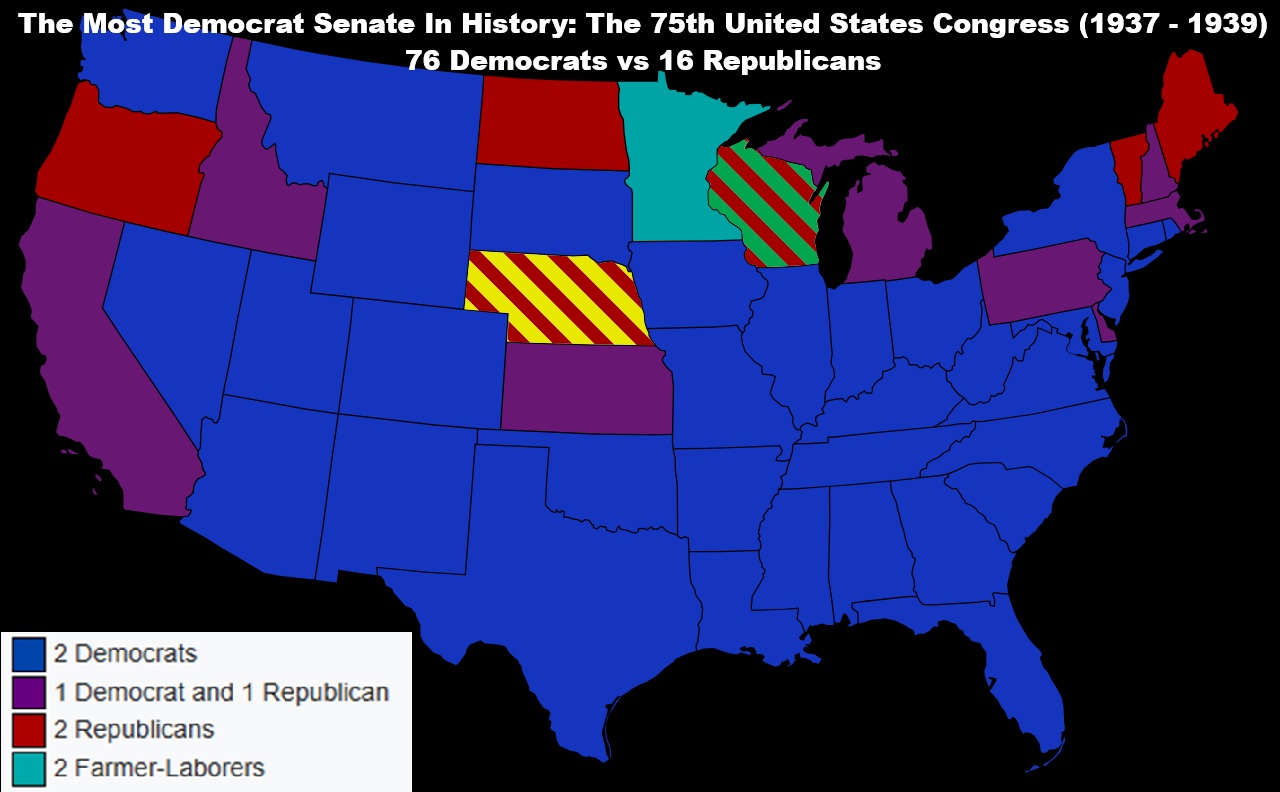
Also see the most republican and most democrats Senate’s:
The Most Republican Senate in History
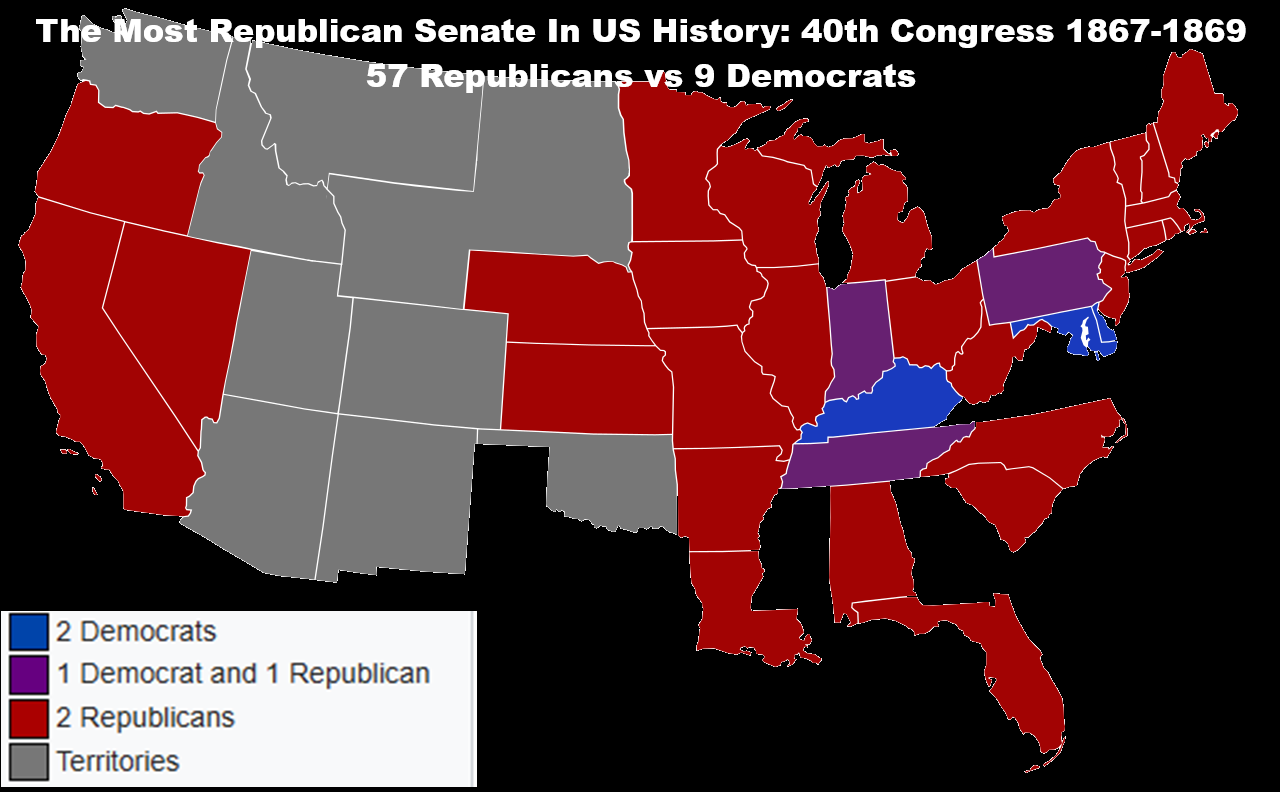
The Most Democrat Senate in History
Which one suspires you the most?


Leave a Reply