
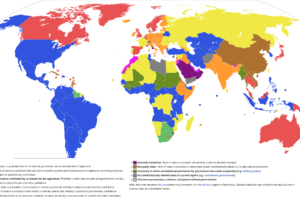
The map above shows how much entry level wages per hour have increased over and above inflation between 1935 (3 years before the federal minimum wage was introduced) and 2024 by state.
The southern states of South Carolina, Georgia, Mississippi, Alabama, and Arkansas were the biggest winners increasing their entry level hourly wages by 150% or more over and above inflation.
Conversely, many northern and western states barely saw their inflation adjusted starting wages improve over this time period.
And finally Illinois is perhaps the most interesting state.
It had the highest entry level hourly wage in 1935 at $0.67/hour, but by 2024 it’s starting hourly wage was 39th in the country at $14.06/hour, which is barely more than the state’s minimum wage of $13/hour.
Here is the full data:
| State | Entry Level Hourly Wage 2024 ($) | Entrance Wage Common Laborer 1935 ($) | Inflation Adjusted 1935 Wage | Absolute Increase % | Increase Above Inflation |
|---|---|---|---|---|---|
| New York | $17.51 | $0.59 | $13.62 | 2883% | 28.6% |
| Washington | $17.20 | $0.48 | $11.23 | 3454% | 53.2% |
| Massachusetts | $17.18 | $0.61 | $14.20 | 2707% | 21.0% |
| District of Columbia | $17.17 | $0.49 | $11.39 | 3397% | 50.7% |
| New Hampshire | $16.19 | $0.46 | $10.60 | 3443% | 52.7% |
| Tennessee | $16.17 | $0.32 | $7.47 | 4922% | 116.5% |
| Connecticut | $16.08 | $0.46 | $10.60 | 3419% | 51.7% |
| Rhode Island | $16.00 | $0.47 | $10.93 | 3297% | 46.4% |
| Oregon | $15.98 | $0.57 | $13.11 | 2728% | 21.9% |
| Maryland | $15.97 | $0.44 | $10.12 | 3563% | 57.9% |
| Idaho | $15.91 | $0.50 | $11.60 | 3082% | 37.2% |
| Vermont | $15.86 | $0.41 | $9.47 | 3787% | 67.6% |
| California | $15.69 | $0.59 | $13.64 | 2568% | 15.0% |
| New Jersey | $15.65 | $0.50 | $11.58 | 3036% | 35.2% |
| Virginia | $15.58 | $0.28 | $6.57 | 5405% | 137.3% |
| Minnesota | $15.56 | $0.56 | $12.97 | 2684% | 20.0% |
| Arizona | $15.55 | $0.50 | $11.60 | 3010% | 34.1% |
| Wyoming | $15.38 | $0.50 | $11.60 | 2976% | 32.6% |
| Colorado | $15.08 | $0.45 | $10.49 | 3236% | 43.8% |
| Nebraska | $15.04 | $0.43 | $9.95 | 3406% | 51.1% |
| Delaware | $15.04 | $0.39 | $8.96 | 3796% | 67.9% |
| Indiana | $15.02 | $0.44 | $10.14 | 3337% | 48.1% |
| South Dakota | $15.01 | $0.44 | $10.30 | 3281% | 45.7% |
| Kentucky | $14.95 | $0.35 | $8.19 | 4135% | 82.5% |
| Maine | $14.94 | $0.38 | $8.79 | 3842% | 69.9% |
| Montana | $14.85 | $0.59 | $13.66 | 2421% | 8.7% |
| South Carolina | $14.78 | $0.22 | $5.01 | 6743% | 194.9% |
| West Virginia | $14.76 | $0.40 | $9.16 | 3637% | 61.1% |
| Ohio | $14.64 | $0.52 | $12.02 | 2726% | 21.8% |
| Wisconsin | $14.63 | $0.55 | $12.78 | 2555% | 14.4% |
| Iowa | $14.58 | $0.49 | $11.28 | 2900% | 29.3% |
| Utah | $14.45 | $0.46 | $10.58 | 3069% | 36.6% |
| Pennsylvania | $14.41 | $0.46 | $10.74 | 3012% | 34.2% |
| Oklahoma | $14.37 | $0.43 | $9.91 | 3265% | 45.1% |
| Arkansas | $14.25 | $0.25 | $5.71 | 5693% | 149.7% |
| Kansas | $14.14 | $0.42 | $9.72 | 3275% | 45.5% |
| Texas | $14.09 | $0.36 | $8.38 | 3803% | 68.2% |
| Michigan | $14.07 | $0.55 | $12.71 | 2468% | 10.7% |
| Illinois | $14.06 | $0.67 | $15.43 | 2014% | -8.9% |
| Missouri | $13.95 | $0.40 | $9.26 | 3396% | 50.7% |
| Mississippi | $13.87 | $0.24 | $5.50 | 5752% | 152.3% |
| Alabama | $13.55 | $0.23 | $5.38 | 5741% | 151.7% |
| Florida | $12.76 | $0.31 | $7.26 | 3977% | 75.7% |
| Louisiana | $12.46 | $0.41 | $9.40 | 2977% | 32.6% |
| Georgia | $12.46 | $0.20 | $4.71 | 6038% | 164.6% |
| North Carolina | $12.39 | $0.27 | $6.19 | 4540% | 100.0% |
Data for 1935 comes from the U.S. Department of Labor, Bureau of Labor Statistics. They state that:
The term “common laborer,” as used in this survey, signifies one who performs physical or manual work of a miscellaneous character, which requires little or no skill or training beyond the ability to follow specific instructions from a foreman or supervisor. By “entrance rate” is meant the wage at which a common laborer is first hired, as distinguished from any later wage that may include an increase due to length of service, relative efficiency, etc. “Full-time hours of work” pertain to the normal or regular hours customarily worked, as compared with the hours actually worked, which in many cases cover part-time as well as overtime work.
The 2024 data come ZipRecuriter.
And the inflation data comes from Bureau of Labour Statistics CPI Calculator. $1 in 1935 was worth $23.20 (a 2,220% increase)


Leave a Reply