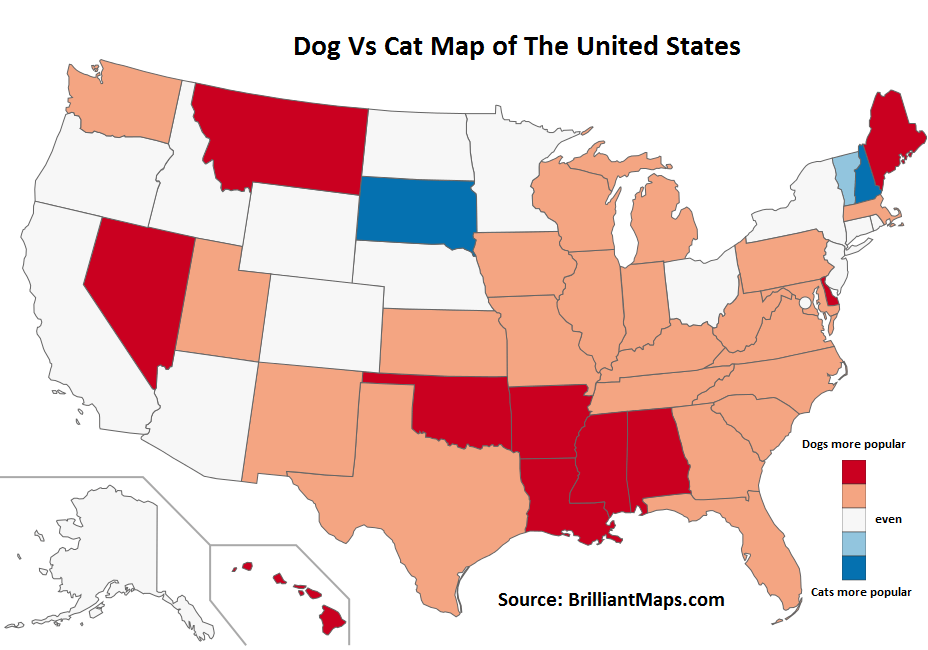
It’s official (well at least if Google can be trusted) the US prefers dogs over cats. We arrived at this conclusion simply by comparing monthly Google searches for the term ‘dog’ compared to ‘cat.’
However, the map above does not tell the whole story.
According to Google’s keyword planner data for September 2015, there were 586,720 searches for ‘dog’ vs just 511,980 for ‘cat.’ While these numbers may not be entirely accurate, they strongly imply that the US is a dog country.
The 10 states with the biggest bias for dogs over cats were (full data at the end of this post):
The 3 states with a relatively greater interest in cats over dogs were:
However, the data only looks at relative interest only! And not absolute interest. So a state could search a lot for both dogs and cats, yet still show a bias towards dogs.
Therefore to provide a fairer picture, here are the number of searches per capita per month (note numbers are per 1,000 people to make the comparison a bit easier).
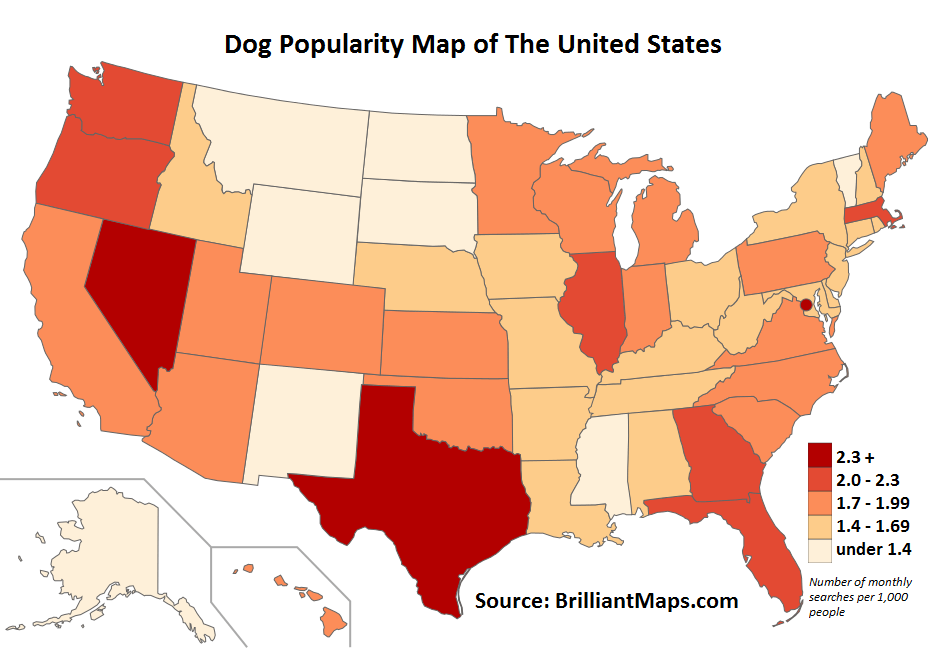
On a per capita basis, state rankings look a little different. The top 10 are:
- Washington DC
- Nevada
- Texas
- Georgia
- Massachusetts
- Washington
- Illinois
- Florida
- Oregon
- California
Similarly, we also looked at the per capita popularity of cats by state:
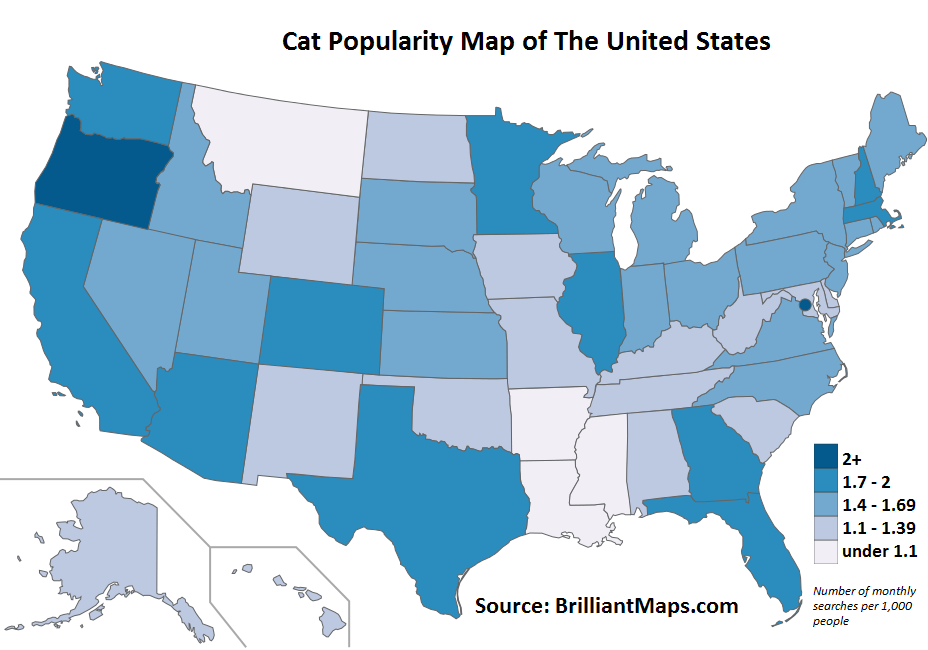
The top 10 states with greatest per capita search volume for cats are:
- Washington DC
- Oregon
- California
- Colorado
- Texas
- Arizona
- Minnesota
- Georgia
- Massachusetts
- New Hampshire
It turns out that 6 of the top 10 states searching for ‘cat’ were also in the top 10 searching for ‘dog.’ So perhaps the difference is less about dog vs cat and more between those who like having pets and those that don’t.
What do you think? You can leave your comments at the end of this article.
Looking for more in the dog vs cat debate? Then have a look at the following:
- Dog vs. Cat
- National Geographic Readers: Cats vs. Dogs
- Dog vs. Cat: A Nation Divided: Dirty Tricks and Other Shocking Secrets from a Nasty Pet Election
- Cat Dog Theology: Rethinking Our Relationship with Our Master
- Cats vs. Dogs (A Coloring Book)
- CafePress Schrodinger’s Cat Vs. Pavlov’s Dog T-Shirt
Full Data:
States most interested in dogs relative to cats:
- Arkansas – 1.52X more searches for dog vs cat
- Alabama – 1.50X
- Louisiana – 1.50X
- Mississippi – 1.50X
- Nevada – 1.50X
- Oklahoma – 1.50X
- Delaware – 1.30X
- Montana – 1.30X
- Hawaii – 1.26X
- Maine – 1.26X
- Kansas – 1.23X
- South Carolina – 1.23X
- Utah – 1.23X
- Georgia – 1.23X
- Pennsylvania – 1.23X
- Florida – 1.22X
- Massachusetts – 1.22X
- Virginia – 1.22X
- Washington – 1.22X
- Michigan – 1.22X
- North Carolina – 1.22X
- Indiana – 1.22X
- Iowa – 1.22X
- Kentucky – 1.22X
- Maryland – 1.22X
- Missouri – 1.22X
- Tennessee – 1.22X
- Texas – 1.22X
- Wisconsin – 1.22X
- Illinois – 1.22X
- New Mexico – 1.21X
- West Virginia – 1.21X
- Alaska – even
- Arizona
- California
- Colorado
- Connecticut
- Idaho
- Minnesota
- Nebraska
- New Jersey
- New York
- North Dakota
- Ohio
- Oregon
- Rhode Island
- Washington DC
- Wyoming – even
- Vermont – 1.22X more searches for ‘cat’ vs ‘dog’
- New Hampshire – 1.26X
- South Dakota – 1.30X
Searches for ‘dog’ per 1,000 people:
- Washington DC – 6.68
- Nevada – 2.39
- Texas – 2.32
- Georgia – 2.24
- Massachusetts – 2.23
- Washington – 2.15
- Illinois – 2.10
- Florida – 2.10
- Oregon – 2.08
- California – 1.95
- Colorado – 1.91
- Utah – 1.89
- Kansas – 1.87
- North Carolina – 1.86
- Indiana – 1.85
- Arizona – 1.85
- Minnesota – 1.84
- Michigan – 1.83
- Virginia – 1.81
- Maine – 1.81
- Pennsylvania – 1.74
- Oklahoma – 1.73
- Wisconsin – 1.73
- Hawaii – 1.72
- South Carolina – 1.71
- New York – 1.69
- Maryland – 1.68
- Alabama – 1.68
- New Jersey – 1.67
- Missouri – 1.64
- Ohio – 1.57
- West Virginia – 1.56
- Nebraska – 1.56
- Tennessee – 1.53
- Rhode Island – 1.52
- Kentucky – 1.51
- Connecticut – 1.50
- Idaho – 1.50
- Arkansas – 1.49
- New Hampshire – 1.44
- Louisiana – 1.43
- Iowa – 1.43
- Delaware – 1.42
- New Mexico – 1.39
- Alaska – 1.37
- Montana – 1.29
- North Dakota – 1.26
- Wyoming – 1.25
- Mississippi – 1.21
- South Dakota – 1.20
- Vermont – 1.15
Searches for ‘cat’ per 1,000 people:
- Washington DC – 6.68
- Oregon – 2.08
- California – 1.95
- Colorado – 1.91
- Texas – 1.90
- Arizona – 1.85
- Minnesota – 1.84
- Georgia – 1.82
- Massachusetts – 1.82
- New Hampshire – 1.82
- Washington – 1.75
- Illinois – 1.72
- Florida – 1.71
- New York – 1.69
- New Jersey – 1.67
- Nevada – 1.59
- Ohio – 1.57
- Nebraska – 1.56
- South Dakota – 1.56
- Utah – 1.54
- Kansas – 1.52
- Rhode Island – 1.52
- North Carolina – 1.52
- Indiana – 1.51
- Connecticut – 1.50
- Idaho – 1.50
- Michigan – 1.50
- Virginia – 1.48
- Maine – 1.43
- Pennsylvania – 1.42
- Wisconsin – 1.41
- Vermont – 1.41
- South Carolina – 1.40
- Maryland – 1.38
- Alaska – 1.37
- Hawaii – 1.36
- Missouri – 1.35
- West Virginia – 1.29
- North Dakota – 1.26
- Tennessee – 1.25
- Wyoming – 1.25
- Kentucky – 1.23
- Iowa – 1.17
- Oklahoma – 1.15
- New Mexico – 1.15
- Alabama – 1.12
- Delaware – 1.09
- Montana – 0.99
- Arkansas – 0.98
- Louisiana – 0.96
- Mississippi – 0.80
Enjoy this post? Please share with a friend or two:


doge_luver says
This is literally facts