
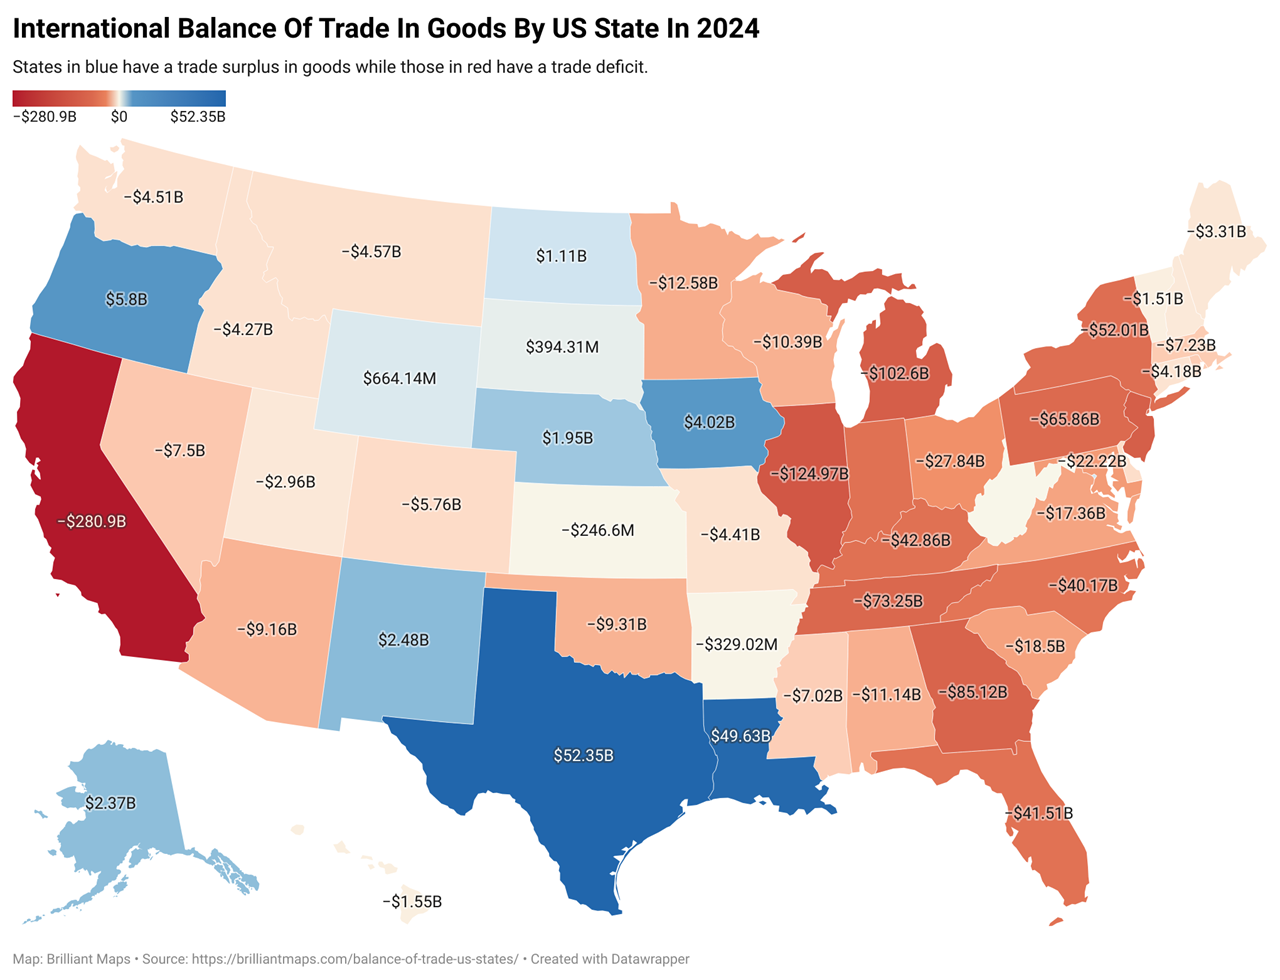
The map above shows each US state’s international trade surplus or deficit (or balance of trade) in goods per capita for the 11 months ending November 2024.
This includes both Manufactured Commodities and Non-Manufactured Commodities.
States in blue have a trade surplus in goods while those in red have a trade deficit.
The data comes from the US Census FT900 Release.
Unfortunately, they don’t include imports and exports of services in their figures for individual US states. Hence the map above can give a slightly misleading picture, because unlike goods, the US has an overall trade surplus in services.
Moreover, the numbers are for international trade in goods only and do include interstate trade.
Here are the numbers per state:
| State | International Exports Per Capita | International Imports Per Capita | Balance of Trade Per Capita |
|---|---|---|---|
| Alabama | $4,827.09 | $6,986.47 | $-2,159.38 |
| Alaska | $7,742.94 | $4,544.93 | $3,198.01 |
| Arizona | $3,887.36 | $5,095.78 | $-1,208.42 |
| Arkansas | $2,014.32 | $2,120.86 | $-106.54 |
| California | $4,269.87 | $11,393.60 | $-7,123.73 |
| Colorado | $1,626.37 | $2,592.95 | $-966.58 |
| Connecticut | $4,339.13 | $5,476.65 | $-1,137.53 |
| Delaware | $4,125.53 | $9,239.45 | $-5,113.92 |
| Florida | $2,821.93 | $4,597.89 | $-1,775.97 |
| Georgia | $4,306.91 | $11,919.59 | $-7,612.68 |
| Hawaii | $306.61 | $1,380.81 | $-1,074.19 |
| Idaho | $1,951.18 | $4,083.50 | $-2,132.33 |
| Illinois | $5,852.75 | $15,684.78 | $-9,832.03 |
| Indiana | $8,078.60 | $14,240.08 | $-6,161.48 |
| Iowa | $4,800.61 | $3,561.33 | $1,239.28 |
| Kansas | $4,397.67 | $4,480.68 | $-83.01 |
| Kentucky | $9,568.09 | $18,909.84 | $-9,341.75 |
| Louisiana | $17,069.84 | $6,275.38 | $10,794.46 |
| Maine | $2,043.02 | $4,396.81 | $-2,353.79 |
| Maryland | $2,619.47 | $6,166.47 | $-3,547.00 |
| Massachusetts | $4,525.26 | $5,538.94 | $-1,013.68 |
| Michigan | $5,637.65 | $15,755.11 | $-10,117.45 |
| Minnesota | $4,233.68 | $6,404.69 | $-2,171.02 |
| Mississippi | $4,293.94 | $6,678.70 | $-2,384.76 |
| Missouri | $2,888.26 | $3,595.15 | $-706.89 |
| Montana | $1,946.73 | $5,968.51 | $-4,021.78 |
| Nebraska | $3,737.32 | $2,766.23 | $971.09 |
| Nevada | $2,925.80 | $5,220.73 | $-2,294.94 |
| New Hampshire | $4,654.79 | $6,611.79 | $-1,957.00 |
| New Jersey | $4,185.92 | $14,712.64 | $-10,526.72 |
| New Mexico | $5,096.45 | $3,929.97 | $1,166.48 |
| New York | $4,284.54 | $6,902.25 | $-2,617.71 |
| North Carolina | $3,598.20 | $7,234.75 | $-3,636.55 |
| North Dakota | $6,401.42 | $5,008.41 | $1,393.01 |
| Ohio | $4,390.92 | $6,733.64 | $-2,342.72 |
| Oklahoma | $1,740.75 | $4,014.78 | $-2,274.03 |
| Oregon | $7,379.76 | $6,021.23 | $1,358.53 |
| Pennsylvania | $3,779.74 | $8,815.18 | $-5,035.44 |
| Rhode Island | $2,568.92 | $9,016.72 | $-6,447.80 |
| South Carolina | $6,390.24 | $9,766.33 | $-3,376.09 |
| South Dakota | $2,117.51 | $1,691.08 | $426.43 |
| Tennessee | $5,011.60 | $15,146.77 | $-10,135.17 |
| Texas | $13,351.09 | $11,678.16 | $1,672.93 |
| Utah | $4,744.18 | $5,588.45 | $-844.28 |
| Vermont | $2,646.41 | $4,980.57 | $-2,334.16 |
| Virginia | $2,284.78 | $4,254.65 | $-1,969.87 |
| Washington | $6,631.52 | $7,197.97 | $-566.46 |
| West Virginia | $2,552.33 | $2,550.35 | $1.98 |
| Wisconsin | $4,273.44 | $6,016.05 | $-1,742.61 |
| Wyoming | $3,191.27 | $2,061.05 | $1,130.22 |
| Dist of Columbia | $3,652.00 | $2,285.01 | $1,366.99 |
Total International Trade Surplus & Deficits In Goods By US State
Below are the absolute values.
And here is the data (note numbers are in millions of $ USD):
| State | International Exports of Goods (Millions USD) | International Imports of Goods (Millions USD) | Balance of Trade (Millions USD) |
|---|---|---|---|
| Alabama | $24,896.67 | $36,034.09 | $-11,137.42 |
| Alaska | $5,730.81 | $3,363.86 | $2,366.95 |
| Arizona | $29,475.43 | $38,638.14 | $-9,162.72 |
| Arkansas | $6,220.93 | $6,549.95 | $-329.02 |
| California | $168,366.39 | $449,264.00 | $-280,897.61 |
| Colorado | $9,689.06 | $15,447.46 | $-5,758.40 |
| Connecticut | $15,946.59 | $20,127.08 | $-4,180.49 |
| Delaware | $4,339.71 | $9,719.13 | $-5,379.42 |
| Florida | $65,954.69 | $107,462.94 | $-41,508.24 |
| Georgia | $48,155.03 | $133,271.47 | $-85,116.43 |
| Hawaii | $443.41 | $1,996.85 | $-1,553.44 |
| Idaho | $3,905.51 | $8,173.62 | $-4,268.10 |
| Illinois | $74,389.35 | $199,356.06 | $-124,966.71 |
| Indiana | $55,938.46 | $98,602.26 | $-42,663.80 |
| Iowa | $15,561.11 | $11,544.00 | $4,017.10 |
| Kansas | $13,063.73 | $13,310.33 | $-246.60 |
| Kentucky | $43,901.96 | $86,765.38 | $-42,863.42 |
| Louisiana | $78,482.69 | $28,852.55 | $49,630.14 |
| Maine | $2,870.46 | $6,177.57 | $-3,307.10 |
| Maryland | $16,406.33 | $38,621.95 | $-22,215.62 |
| Massachusetts | $32,293.03 | $39,526.80 | $-7,233.77 |
| Michigan | $57,168.41 | $159,764.01 | $-102,595.60 |
| Minnesota | $24,526.34 | $37,103.36 | $-12,577.02 |
| Mississippi | $12,637.26 | $19,655.71 | $-7,018.45 |
| Missouri | $18,038.55 | $22,453.39 | $-4,414.84 |
| Montana | $2,213.89 | $6,787.59 | $-4,573.70 |
| Nebraska | $7,495.06 | $5,547.58 | $1,947.48 |
| Nevada | $9,559.94 | $17,058.57 | $-7,498.63 |
| New Hampshire | $6,558.75 | $9,316.22 | $-2,757.47 |
| New Jersey | $39,769.79 | $139,782.60 | $-100,012.81 |
| New Mexico | $10,856.75 | $8,371.84 | $2,484.91 |
| New York | $85,122.01 | $137,128.68 | $-52,006.67 |
| North Carolina | $39,745.81 | $79,915.17 | $-40,169.37 |
| North Dakota | $5,099.17 | $3,989.54 | $1,109.63 |
| Ohio | $52,178.59 | $80,017.87 | $-27,839.28 |
| Oklahoma | $7,129.06 | $16,442.12 | $-9,313.06 |
| Oregon | $31,529.09 | $25,724.92 | $5,804.16 |
| Pennsylvania | $49,434.34 | $115,291.61 | $-65,857.27 |
| Rhode Island | $2,857.43 | $10,029.37 | $-7,171.94 |
| South Carolina | $35,011.07 | $53,508.09 | $-18,497.03 |
| South Dakota | $1,958.00 | $1,563.69 | $394.31 |
| Tennessee | $36,222.56 | $109,477.07 | $-73,254.51 |
| Texas | $417,766.63 | $365,419.34 | $52,347.29 |
| Utah | $16,621.76 | $19,579.77 | $-2,958.01 |
| Vermont | $1,716.18 | $3,229.87 | $-1,513.69 |
| Virginia | $20,131.62 | $37,488.54 | $-17,356.92 |
| Washington | $52,774.80 | $57,282.78 | $-4,507.97 |
| West Virginia | $4,517.58 | $4,514.07 | $3.50 |
| Wisconsin | $25,473.87 | $35,861.52 | $-10,387.65 |
| Wyoming | $1,875.25 | $1,211.11 | $664.14 |
| Dist of Columbia | $2,564.61 | $1,604.65 | $959.97 |
What this means is that any state in red will likely be more negatively affected by any tariffs than those in blue.


Leave a Reply