
Further explanation below:
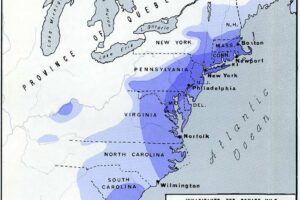
Why Dew Point ≥ 65°F Means More Humidity
- Dew point directly reflects the amount of water vapor in the air.
- A dew point of 65°F (18°C) or higher is typically considered humid, and above 70°F (21°C) feels oppressive or tropical to most people.
- So, the red-colored areas, where there are 60 to 90+ days per summer with dew points above 65°F, are places with consistently high humidity in the summer.
What’s Causing the Red Area to Be More Humid?
- Proximity to Moisture Sources:
- The Gulf of Mexico plays a major role. It feeds warm, moist air into the central and eastern U.S., especially the Southeast, Deep South, and parts of the Midwest.
- Prevailing Winds:
- In summer, southerly winds bring humid air northward from the Gulf, affecting Texas, the Mississippi Valley, and even the Midwest.
- Geography & Vegetation:
- The eastern U.S. has more vegetation, forests, and rainfall, which promote evapotranspiration, adding moisture to the air.
- In contrast, the western U.S. (purple areas) is more arid, with mountains, deserts, and dry air masses that keep dew points low.
- Weather Patterns:
- High pressure systems in the Southeast (often the Bermuda High) reinforce warm, humid flow from the Gulf.
Dew Point vs. Relative Humidity
Dew Point (°F or °C)
What it is:
The temperature at which air becomes fully saturated with moisture (100% relative humidity), meaning water vapor will start to condense (form dew, fog, or clouds).
What it tells you:
How much actual moisture is in the air.
Why it matters:
It directly correlates with how humid it feels, higher dew point = more moisture = stickier air.
Example:
- A dew point of 30°F feels dry.
- A dew point of 60°F feels muggy.
- A dew point of 75°F feels tropical and oppressive.
Relative Humidity (%)
What it is:
The percentage of moisture in the air compared to the maximum the air could hold at the current temperature.
What it tells you:
How close the air is to being saturated, but it depends on temperature.
Why it’s tricky:
It changes a lot during the day, even if moisture content stays the same.
Example:
- 100% humidity at 40°F might feel chilly and damp.
- 50% humidity at 90°F can feel very sweaty and uncomfortable, even though the number is lower!
Analogy
Think of dew point as the absolute amount of water in the air, and relative humidity as how full the air is, like a sponge:
- Warm air can hold more moisture (a “bigger sponge”).
- So, even if the sponge is only half full (50% humidity), there might still be a lot of water (high dew point).
- Dew point doesn’t care how big the sponge is, it just measures how much water is actually in it.
What do you think?


Leave a Reply