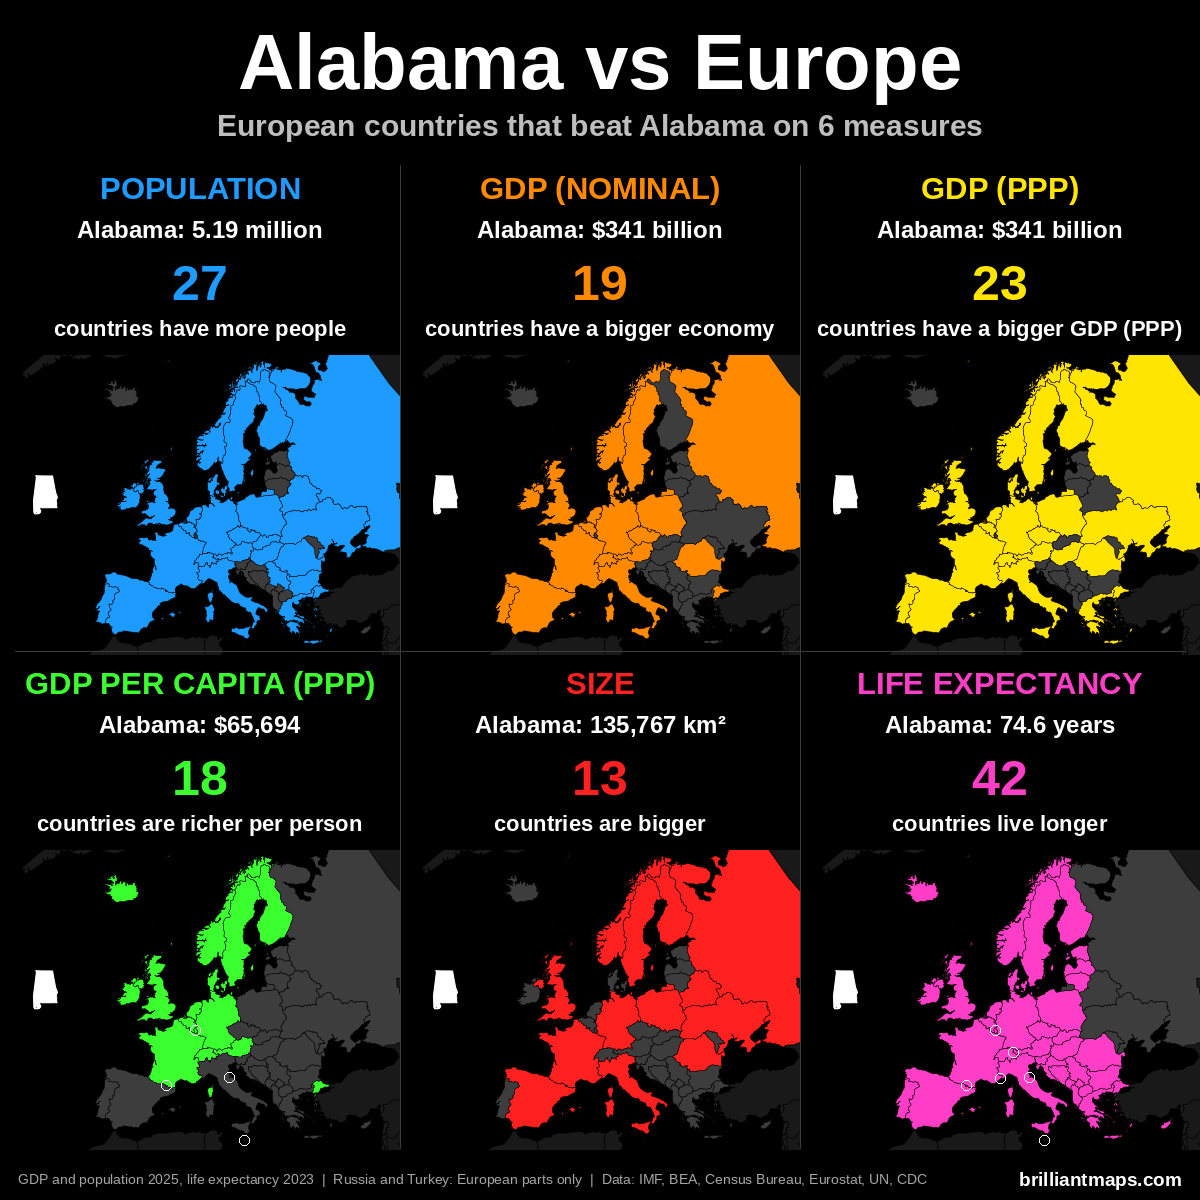
How does each US state compare to the countries of Europe? For all 50 states, the maps below show which European countries are ahead on six measures: population, GDP (nominal), GDP (PPP), GDP per capita (PPP), size and life expectancy.
Population and GDP figures are for 2025 and life expectancy is for 2023. Russia and Turkey are counted for their European parts only; figures marked ~ are estimates.
Jump To A State
Alabama | Alaska | Arizona | Arkansas | California | Colorado | Connecticut | Delaware | Florida | Georgia | Hawaii | Idaho | Illinois | Indiana | Iowa | Kansas | Kentucky | Louisiana | Maine | Maryland | Massachusetts | Michigan | Minnesota | Mississippi | Missouri | Montana | Nebraska | Nevada | New Hampshire | New Jersey | New Mexico | New York | North Carolina | North Dakota | Ohio | Oklahoma | Oregon | Pennsylvania | Rhode Island | South Carolina | South Dakota | Tennessee | Texas | Utah | Vermont | Virginia | Washington | West Virginia | Wisconsin | Wyoming
Full rankings: Population | GDP (Nominal) | GDP (PPP) | GDP Per Capita (PPP) | Size | Life Expectancy
Alabama vs Europe
Alabama Vs European Population
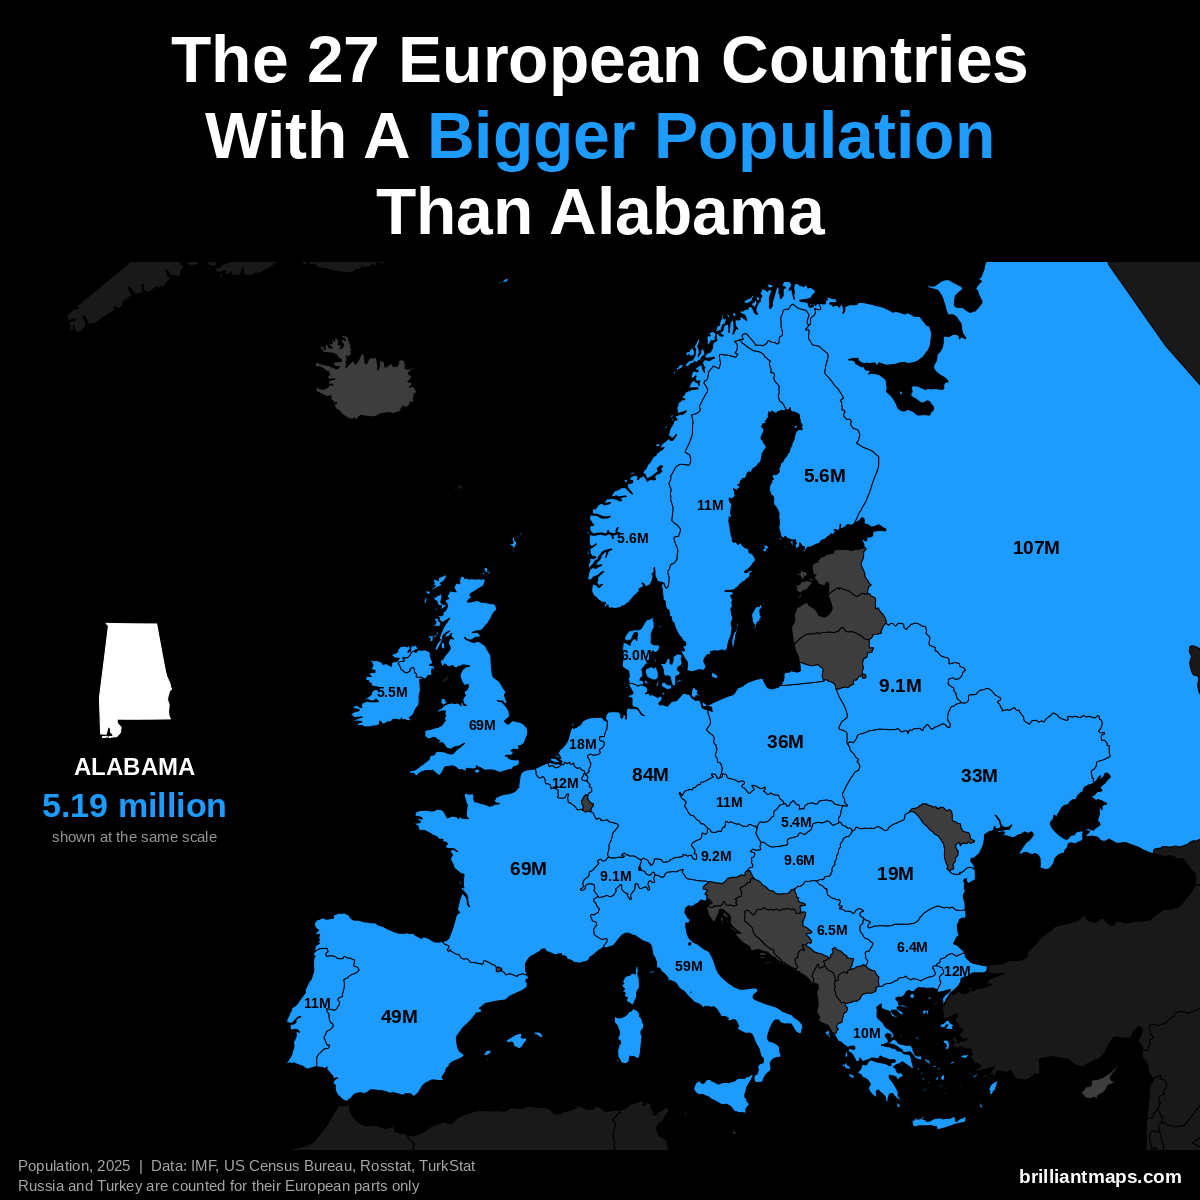
Alabama has a population of 5.2 million (2025). 27 European countries have a bigger population:
- Russia (European part): 107.0 million
- Germany: 83.5 million
- United Kingdom: 69.5 million
- France: 68.9 million
- Italy: 58.9 million
- Spain: 49.5 million
- Poland: 36.5 million
- Ukraine: 32.9 million
- Romania: 19.0 million
- Netherlands: 18.0 million
- Turkey (European part): 12.2 million
- Belgium: 11.9 million
- Portugal: 10.8 million
- Czechia: 10.8 million
- Sweden: 10.7 million
- Greece: 10.4 million
- Hungary: 9.6 million
- Austria: 9.2 million
- Belarus: 9.1 million
- Switzerland: 9.1 million
- Serbia: 6.5 million
- Bulgaria: 6.4 million
- Denmark: 6.0 million
- Norway: 5.6 million
- Finland: 5.6 million
- Ireland: 5.5 million
- Slovakia: 5.4 million
Alabama Vs European GDP (Nominal)
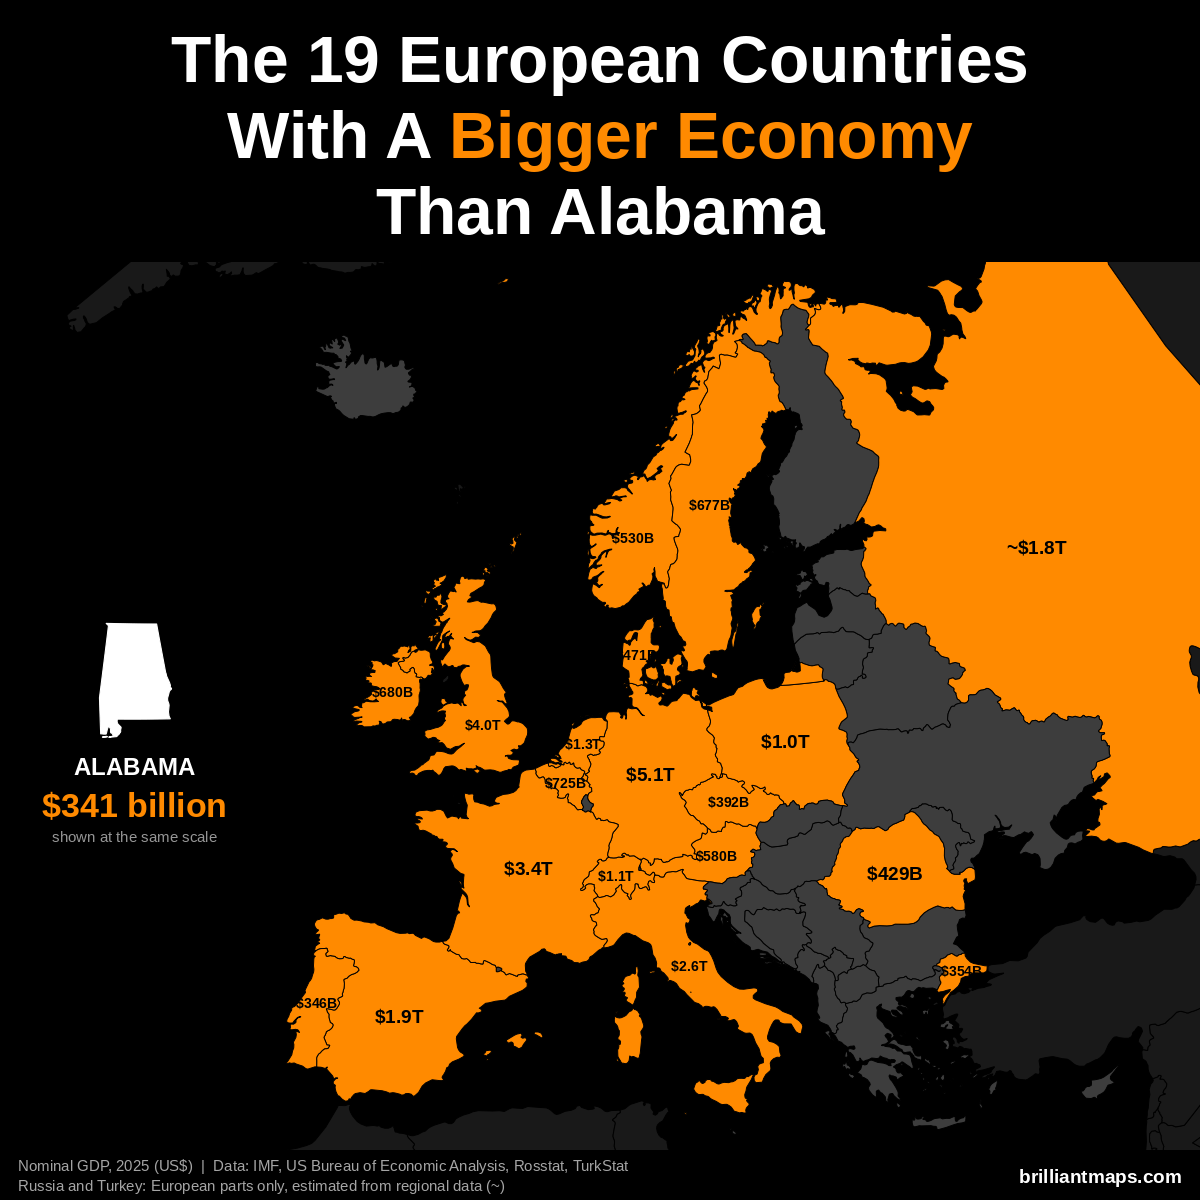
Alabama has a nominal GDP of $341 billion (2025). 19 European countries have a bigger economy:
- Germany: $5.12 trillion
- United Kingdom: $4.01 trillion
- France: $3.38 trillion
- Italy: $2.55 trillion
- Spain: $1.91 trillion
- Russia (European part): ~$1.83 trillion
- Netherlands: $1.32 trillion
- Switzerland: $1.06 trillion
- Poland: $1.04 trillion
- Belgium: $725 billion
- Ireland: $680 billion
- Sweden: $677 billion
- Austria: $580 billion
- Norway: $530 billion
- Denmark: $471 billion
- Romania: $429 billion
- Czechia: $392 billion
- Turkey (European part): ~$354 billion
- Portugal: $346 billion
Alabama Vs European GDP (PPP)
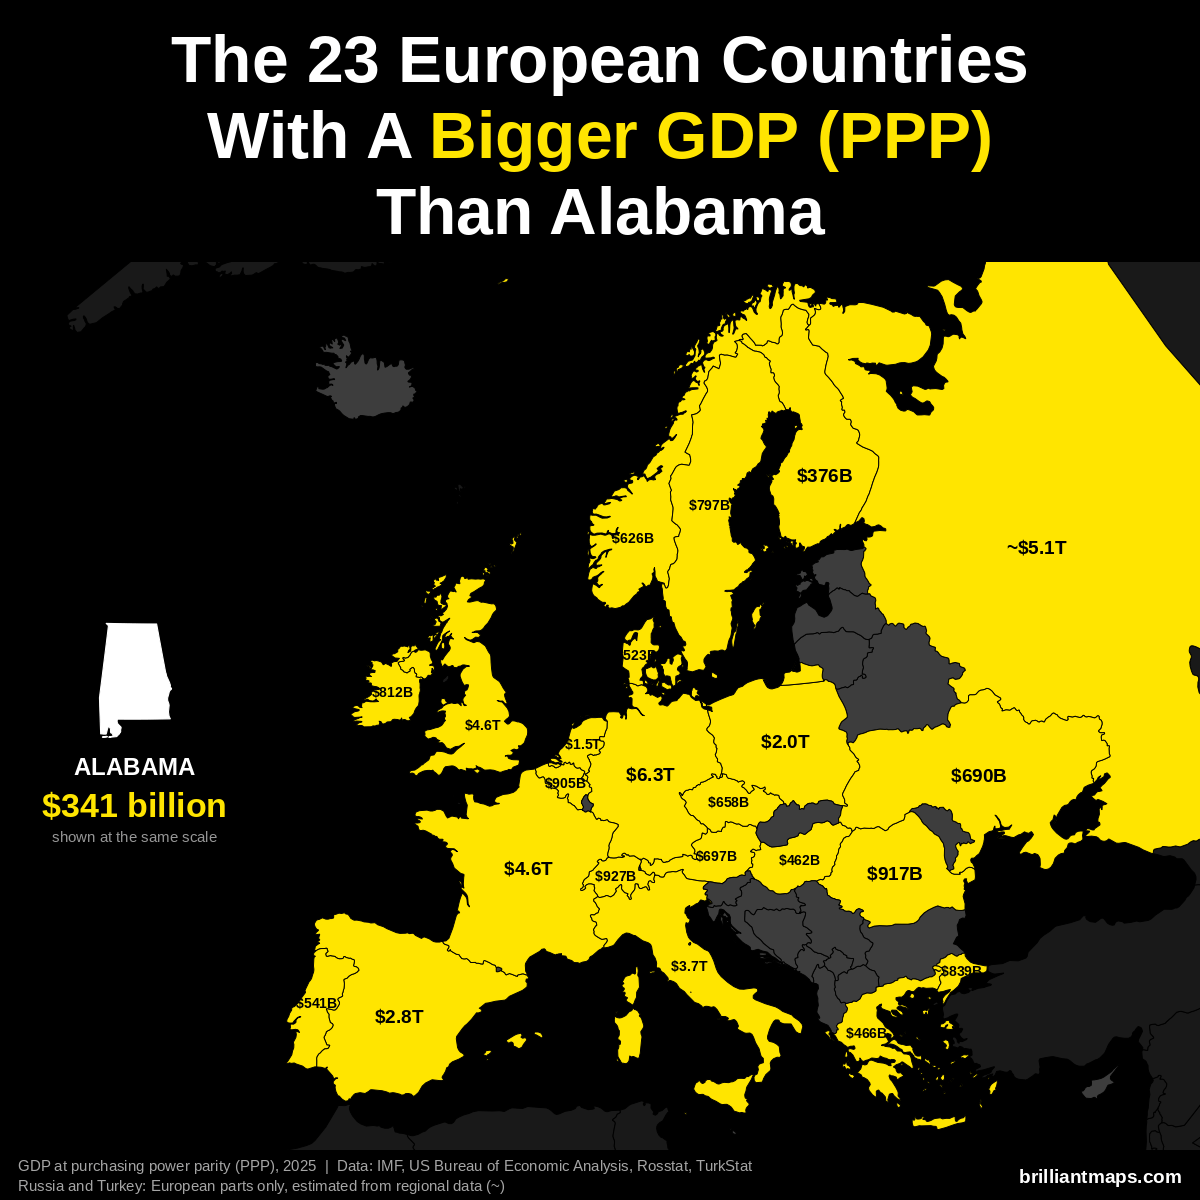
Alabama has a GDP of $341 billion (2025). US states are already measured in the dollars PPP is based on, so the figure is the same as nominal GDP. 23 European countries have a bigger GDP at purchasing power parity:
- Germany: $6.26 trillion
- Russia (European part): ~$5.14 trillion
- France: $4.58 trillion
- United Kingdom: $4.57 trillion
- Italy: $3.74 trillion
- Spain: $2.83 trillion
- Poland: $2.04 trillion
- Netherlands: $1.52 trillion
- Switzerland: $927 billion
- Romania: $917 billion
- Belgium: $905 billion
- Turkey (European part): ~$839 billion
- Ireland: $812 billion
- Sweden: $797 billion
- Austria: $697 billion
- Ukraine: $690 billion
- Czechia: $658 billion
- Norway: $626 billion
- Portugal: $541 billion
- Denmark: $523 billion
- Greece: $466 billion
- Hungary: $462 billion
- Finland: $376 billion
Alabama Vs European GDP Per Capita (PPP)
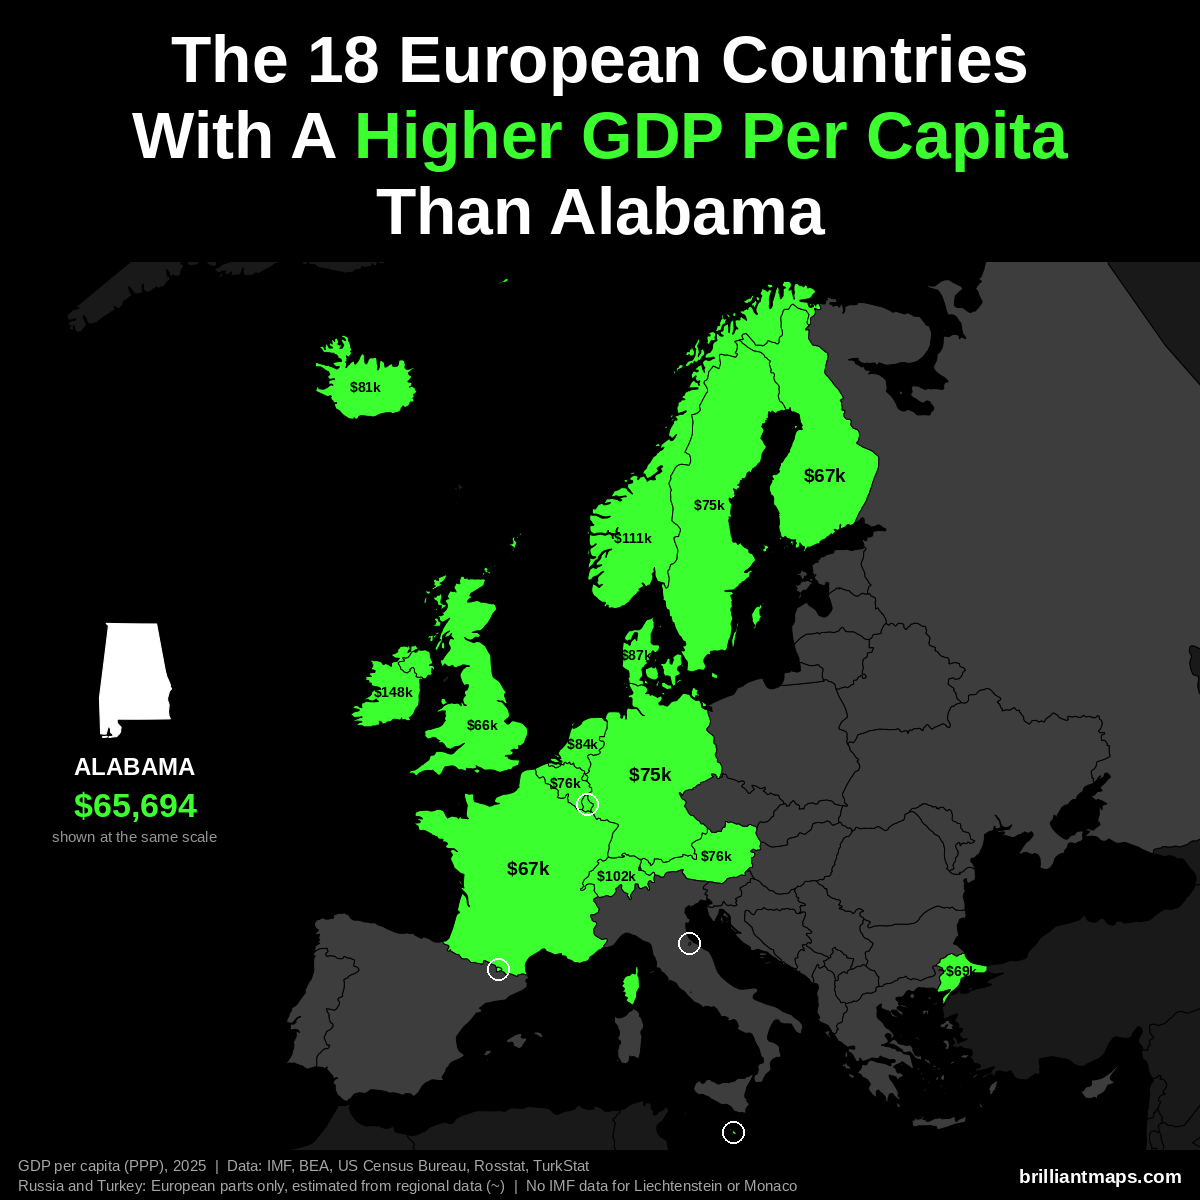
Alabama has a GDP per capita of $65,694 (2025). 18 European countries have a higher GDP per capita at purchasing power parity:
- Luxembourg: $152,894
- Ireland: $147,825
- Norway: $111,462
- Switzerland: $102,397
- Denmark: $87,303
- Netherlands: $84,445
- San Marino: $83,838
- Iceland: $80,915
- Belgium: $76,136
- Austria: $75,965
- Malta: $75,687
- Germany: $74,901
- Sweden: $74,651
- Andorra: $74,059
- Turkey (European part): ~$68,800
- Finland: $67,097
- France: $66,559
- United Kingdom: $65,758
Liechtenstein and Monaco are not covered by the IMF data and are not counted here.
Alabama Vs European Size
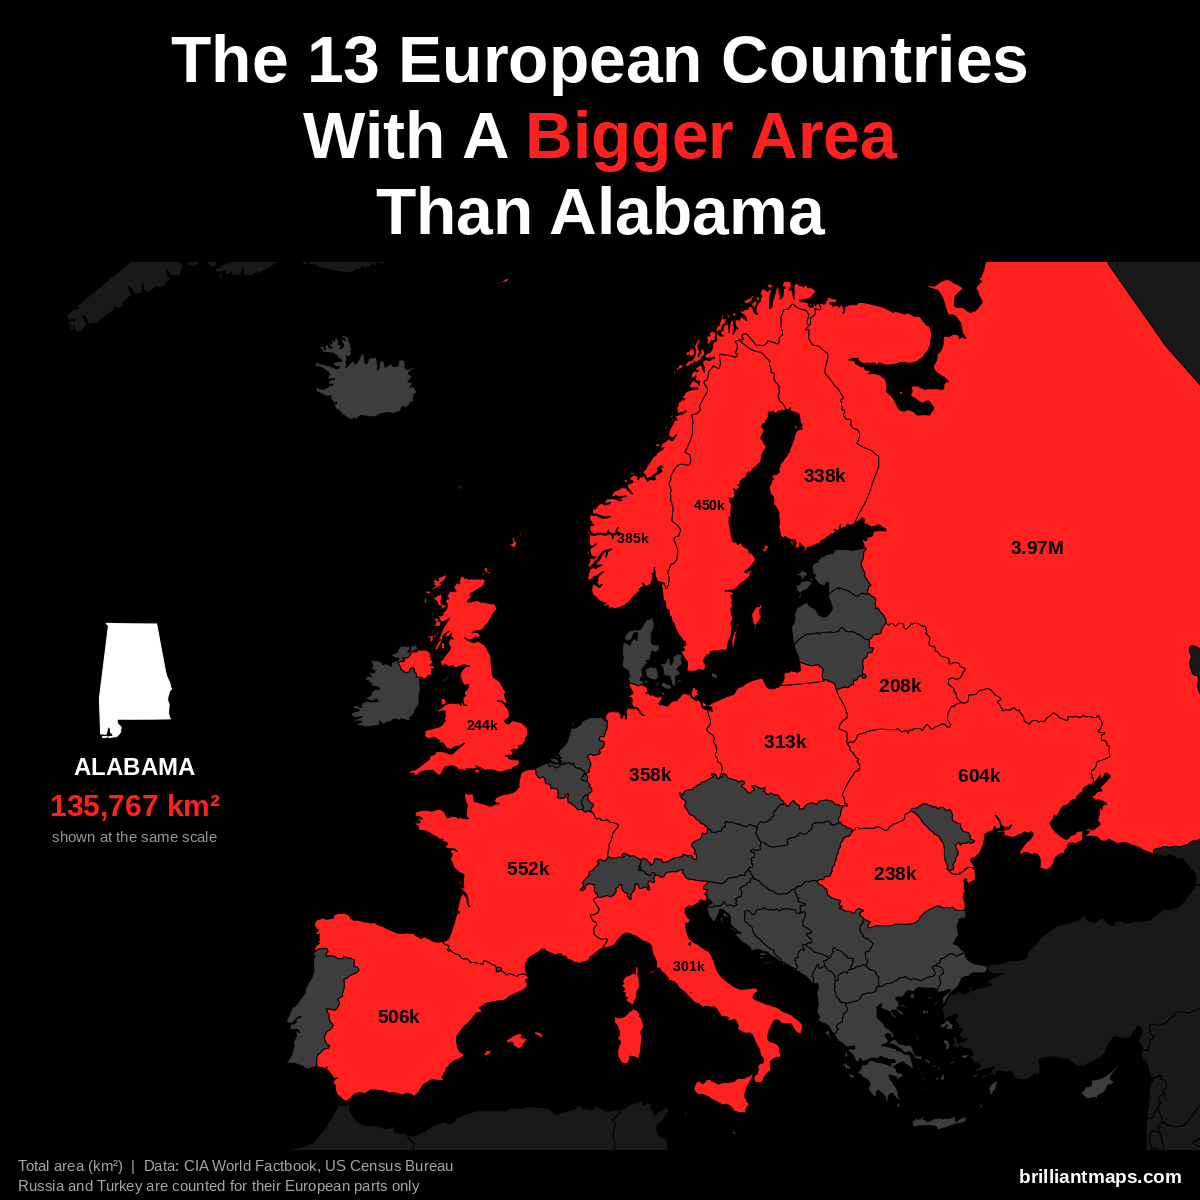
Alabama has a total area of 135,767 km² (52,420 sq mi). 13 European countries have a bigger area:
- Russia (European part): 3,969,100 km² (1,532,477 sq mi)
- Ukraine: 603,550 km² (233,032 sq mi)
- France: 551,695 km² (213,010 sq mi)
- Spain: 505,990 km² (195,364 sq mi)
- Sweden: 450,295 km² (173,860 sq mi)
- Norway: 385,207 km² (148,729 sq mi)
- Germany: 357,588 km² (138,065 sq mi)
- Finland: 338,455 km² (130,678 sq mi)
- Poland: 312,696 km² (120,733 sq mi)
- Italy: 301,340 km² (116,348 sq mi)
- United Kingdom: 243,610 km² (94,058 sq mi)
- Romania: 238,397 km² (92,046 sq mi)
- Belarus: 207,600 km² (80,155 sq mi)
Alabama Vs European Life Expectancy
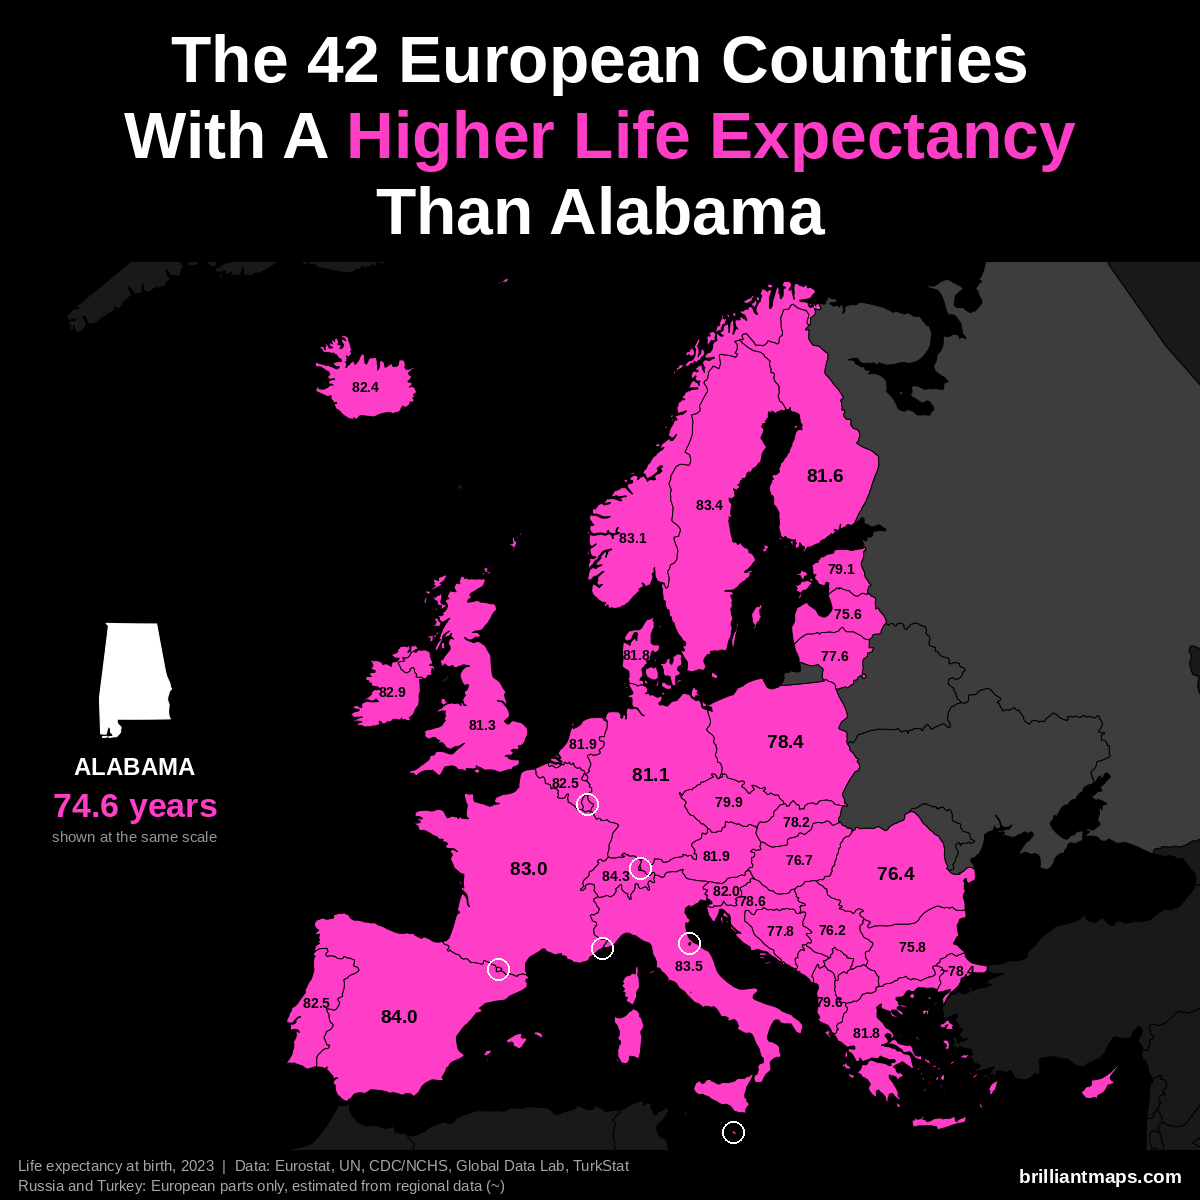
Alabama has a life expectancy at birth of 74.6 years (2023). 42 European countries have a higher life expectancy:
- Monaco: 86.4 years
- San Marino: 85.7 years
- Liechtenstein: 84.6 years
- Switzerland: 84.3 years
- Andorra: 84.0 years
- Spain: 84.0 years
- Italy: 83.5 years
- Luxembourg: 83.4 years
- Malta: 83.4 years
- Sweden: 83.4 years
- Norway: 83.1 years
- France: 83.0 years
- Cyprus: 82.9 years
- Ireland: 82.9 years
- Belgium: 82.5 years
- Portugal: 82.5 years
- Iceland: 82.4 years
- Slovenia: 82.0 years
- Austria: 81.9 years
- Netherlands: 81.9 years
- Denmark: 81.8 years
- Greece: 81.8 years
- Finland: 81.6 years
- United Kingdom: 81.3 years
- Germany: 81.1 years
- Czechia: 79.9 years
- Albania: 79.6 years
- Estonia: 79.1 years
- Croatia: 78.6 years
- Poland: 78.4 years
- Turkey (European part): ~78.4 years
- Slovakia: 78.2 years
- Kosovo: 78.0 years
- Bosnia and Herzegovina: 77.8 years
- Lithuania: 77.6 years
- Montenegro: 77.6 years
- North Macedonia: 77.4 years
- Hungary: 76.7 years
- Romania: 76.4 years
- Serbia: 76.2 years
- Bulgaria: 75.8 years
- Latvia: 75.6 years
Alaska vs Europe
Alaska Vs European Population
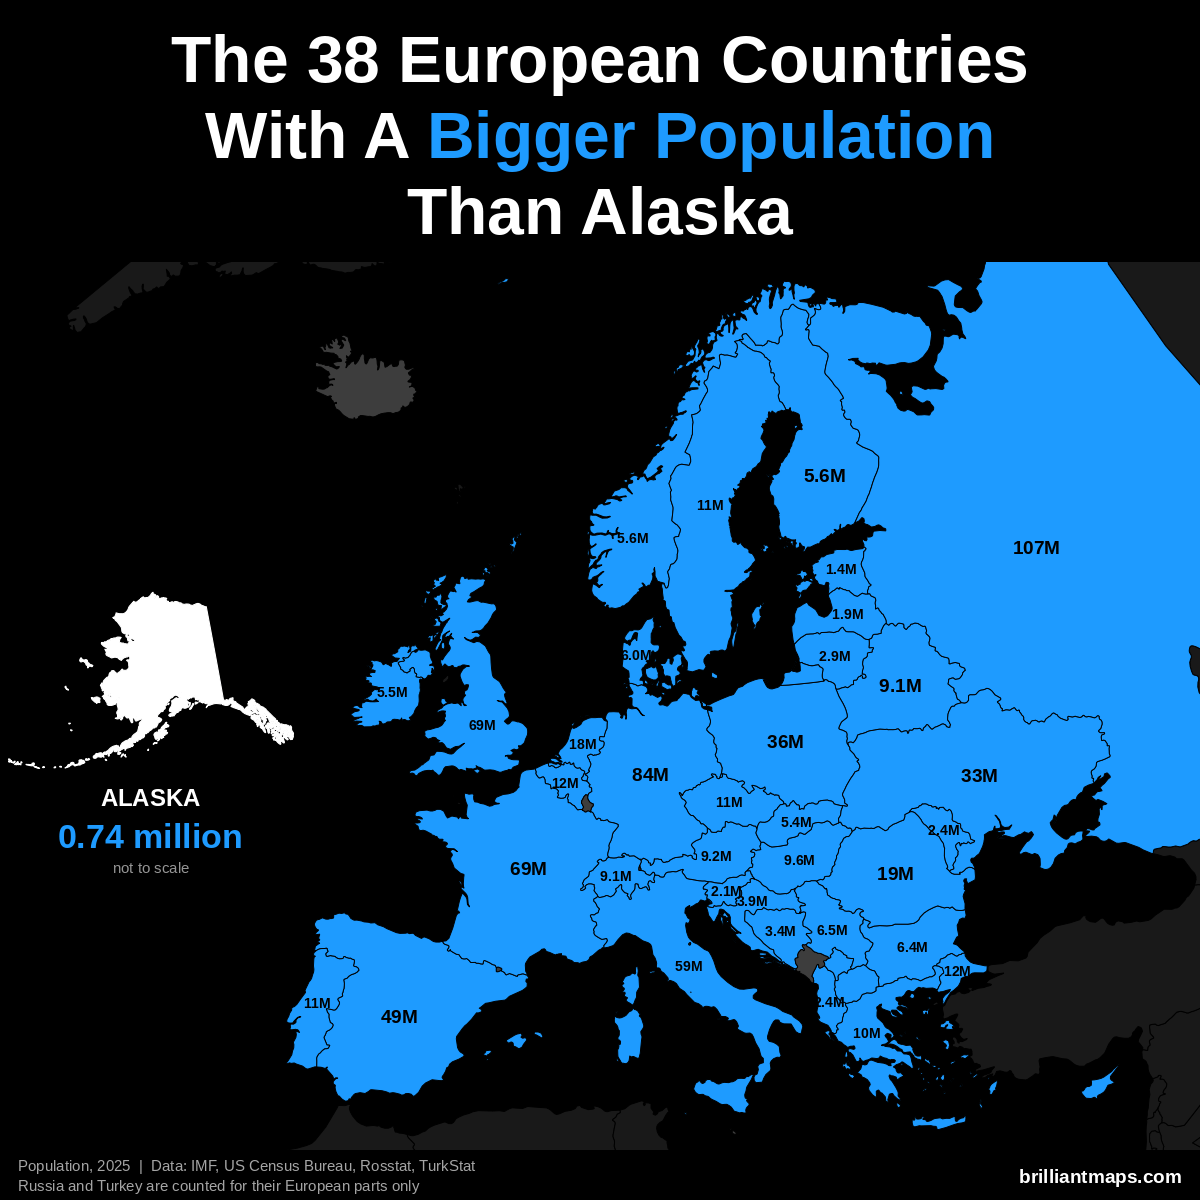
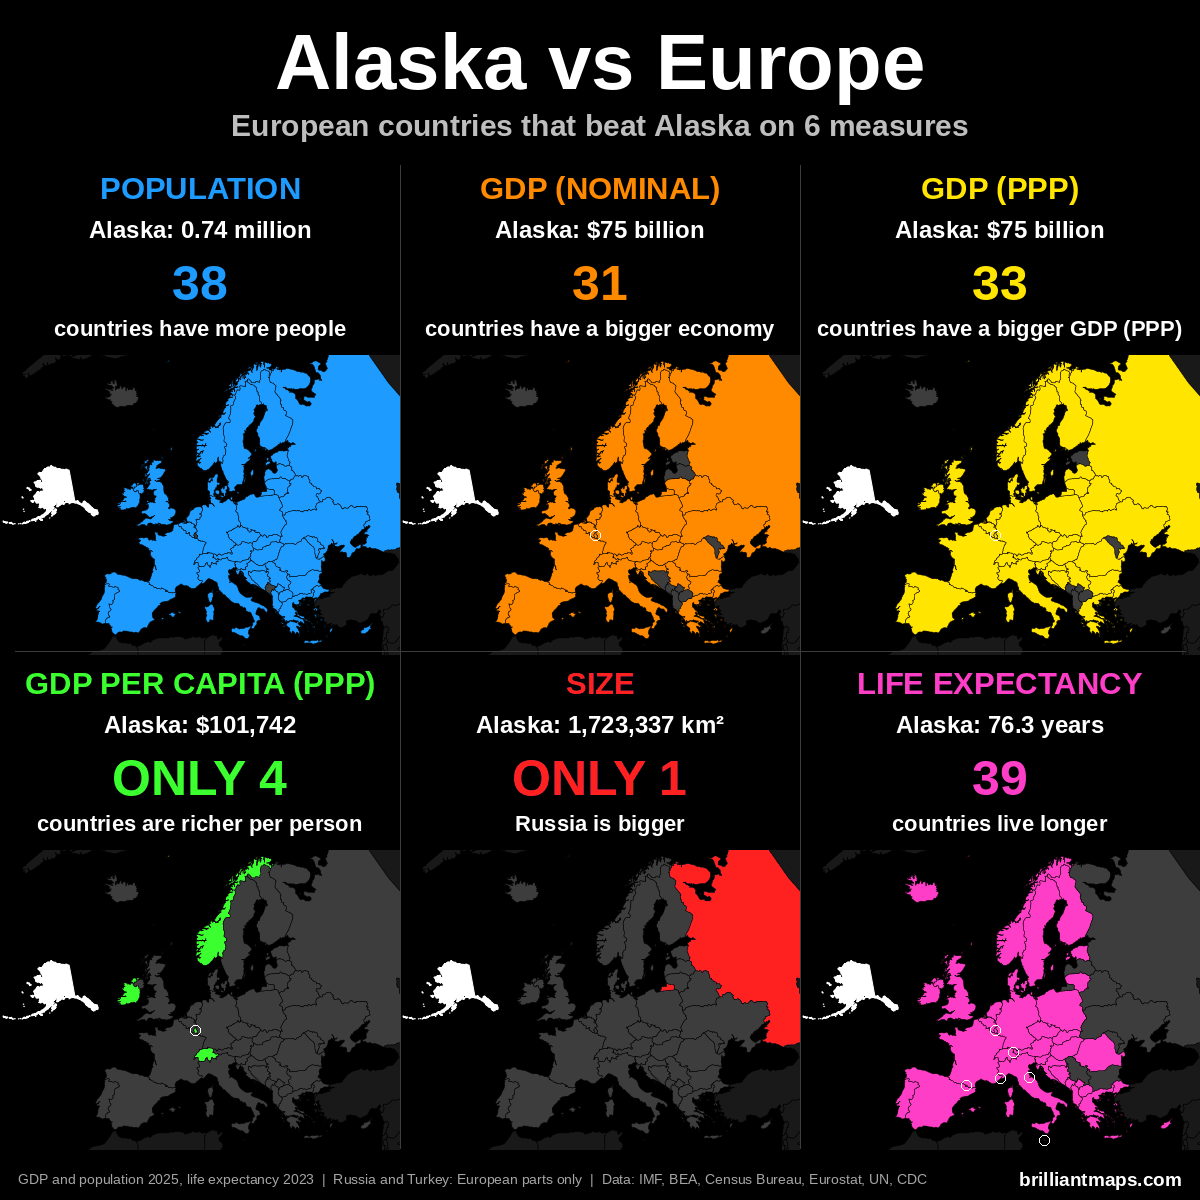
Alaska has a population of 737,270 (2025). 38 European countries have a bigger population:
- Russia (European part): 107.0 million
- Germany: 83.5 million
- United Kingdom: 69.5 million
- France: 68.9 million
- Italy: 58.9 million
- Spain: 49.5 million
- Poland: 36.5 million
- Ukraine: 32.9 million
- Romania: 19.0 million
- Netherlands: 18.0 million
- Turkey (European part): 12.2 million
- Belgium: 11.9 million
- Portugal: 10.8 million
- Czechia: 10.8 million
- Sweden: 10.7 million
- Greece: 10.4 million
- Hungary: 9.6 million
- Austria: 9.2 million
- Belarus: 9.1 million
- Switzerland: 9.1 million
- Serbia: 6.5 million
- Bulgaria: 6.4 million
- Denmark: 6.0 million
- Norway: 5.6 million
- Finland: 5.6 million
- Ireland: 5.5 million
- Slovakia: 5.4 million
- Croatia: 3.9 million
- Bosnia and Herzegovina: 3.4 million
- Lithuania: 2.9 million
- Moldova: 2.4 million
- Albania: 2.4 million
- Slovenia: 2.1 million
- Latvia: 1.9 million
- North Macedonia: 1.8 million
- Kosovo: 1.6 million
- Estonia: 1.4 million
- Cyprus: 983,000
Alaska Vs European GDP (Nominal)
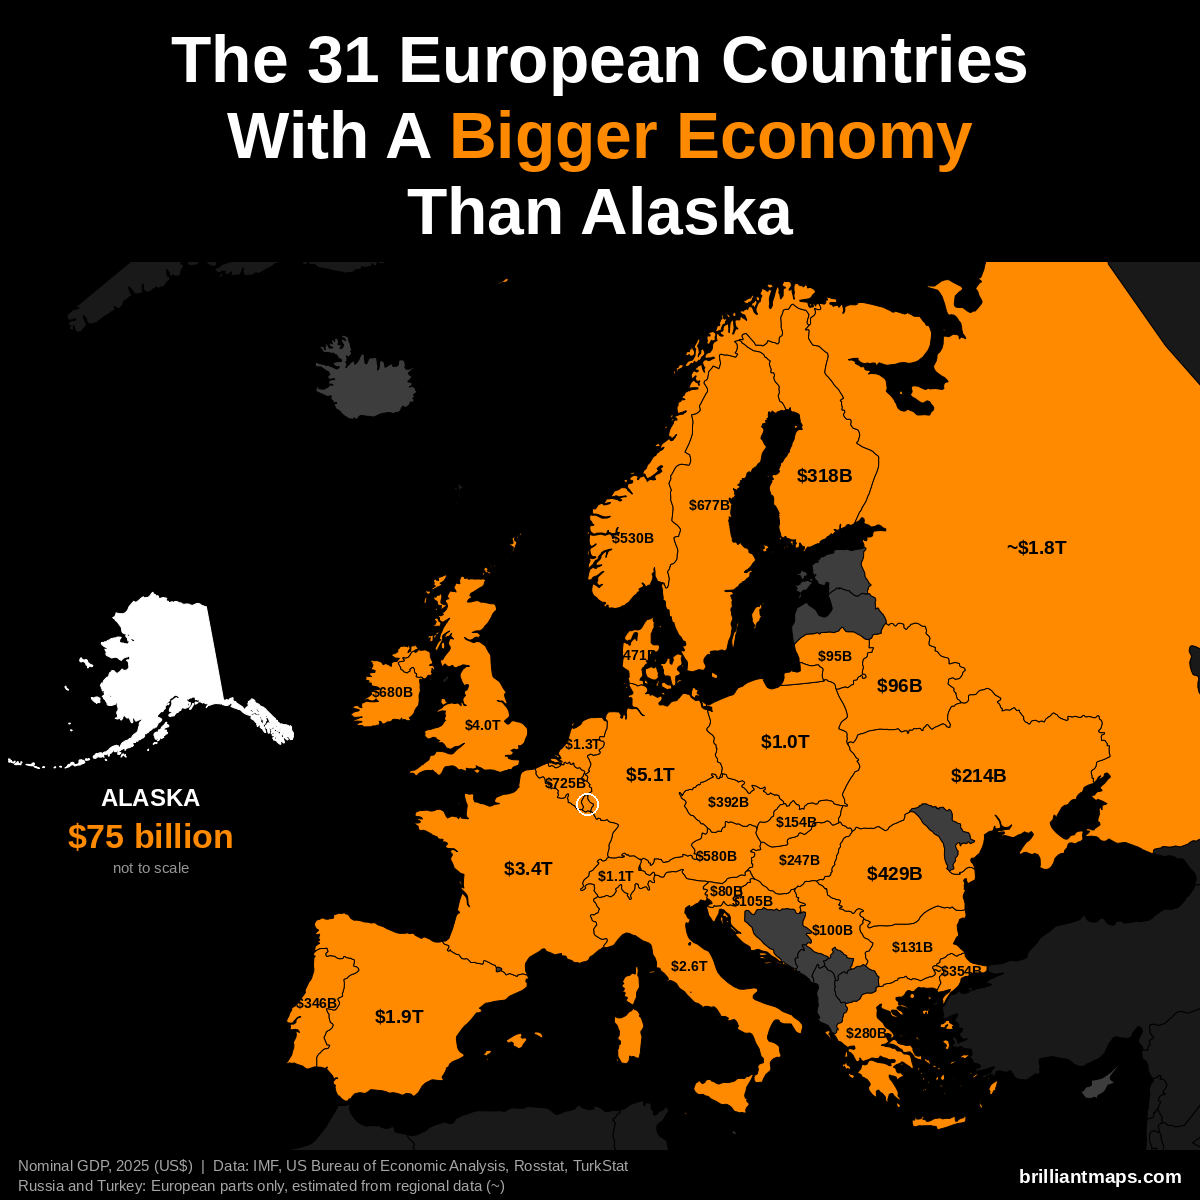
Alaska has a nominal GDP of $75 billion (2025). 31 European countries have a bigger economy:
- Germany: $5.12 trillion
- United Kingdom: $4.01 trillion
- France: $3.38 trillion
- Italy: $2.55 trillion
- Spain: $1.91 trillion
- Russia (European part): ~$1.83 trillion
- Netherlands: $1.32 trillion
- Switzerland: $1.06 trillion
- Poland: $1.04 trillion
- Belgium: $725 billion
- Ireland: $680 billion
- Sweden: $677 billion
- Austria: $580 billion
- Norway: $530 billion
- Denmark: $471 billion
- Romania: $429 billion
- Czechia: $392 billion
- Turkey (European part): ~$354 billion
- Portugal: $346 billion
- Finland: $318 billion
- Greece: $280 billion
- Hungary: $247 billion
- Ukraine: $214 billion
- Slovakia: $154 billion
- Bulgaria: $131 billion
- Croatia: $105 billion
- Luxembourg: $101 billion
- Serbia: $100 billion
- Belarus: $96 billion
- Lithuania: $95 billion
- Slovenia: $80 billion
Alaska Vs European GDP (PPP)
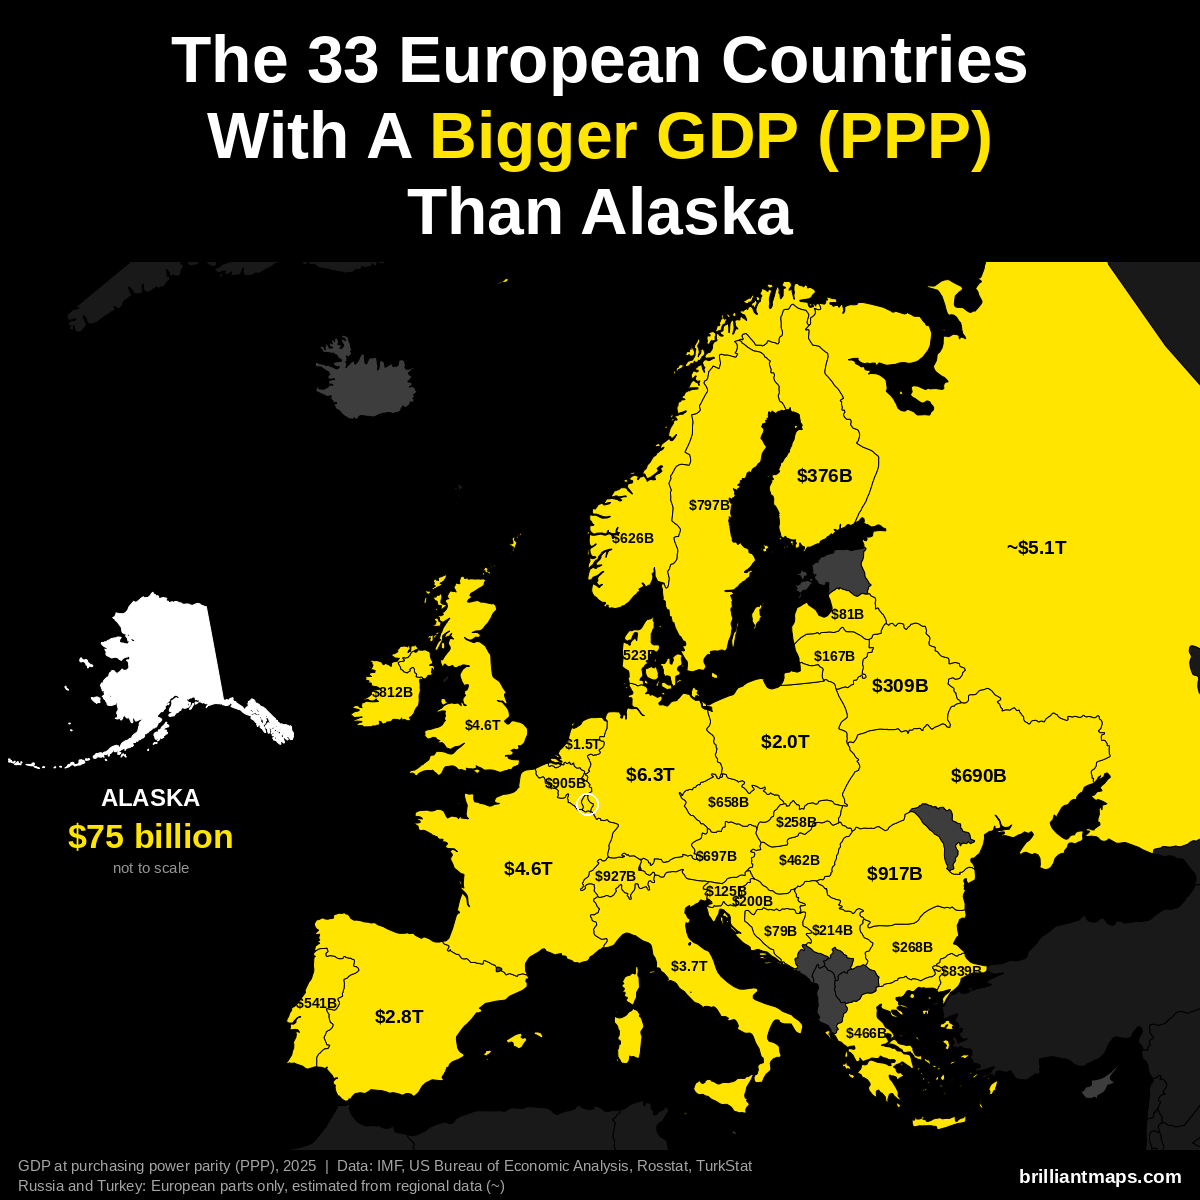
Alaska has a GDP of $75 billion (2025). US states are already measured in the dollars PPP is based on, so the figure is the same as nominal GDP. 33 European countries have a bigger GDP at purchasing power parity:
- Germany: $6.26 trillion
- Russia (European part): ~$5.14 trillion
- France: $4.58 trillion
- United Kingdom: $4.57 trillion
- Italy: $3.74 trillion
- Spain: $2.83 trillion
- Poland: $2.04 trillion
- Netherlands: $1.52 trillion
- Switzerland: $927 billion
- Romania: $917 billion
- Belgium: $905 billion
- Turkey (European part): ~$839 billion
- Ireland: $812 billion
- Sweden: $797 billion
- Austria: $697 billion
- Ukraine: $690 billion
- Czechia: $658 billion
- Norway: $626 billion
- Portugal: $541 billion
- Denmark: $523 billion
- Greece: $466 billion
- Hungary: $462 billion
- Finland: $376 billion
- Belarus: $309 billion
- Bulgaria: $268 billion
- Slovakia: $258 billion
- Serbia: $214 billion
- Croatia: $200 billion
- Lithuania: $167 billion
- Slovenia: $125 billion
- Luxembourg: $104 billion
- Latvia: $81 billion
- Bosnia and Herzegovina: $79 billion
Alaska Vs European GDP Per Capita (PPP)
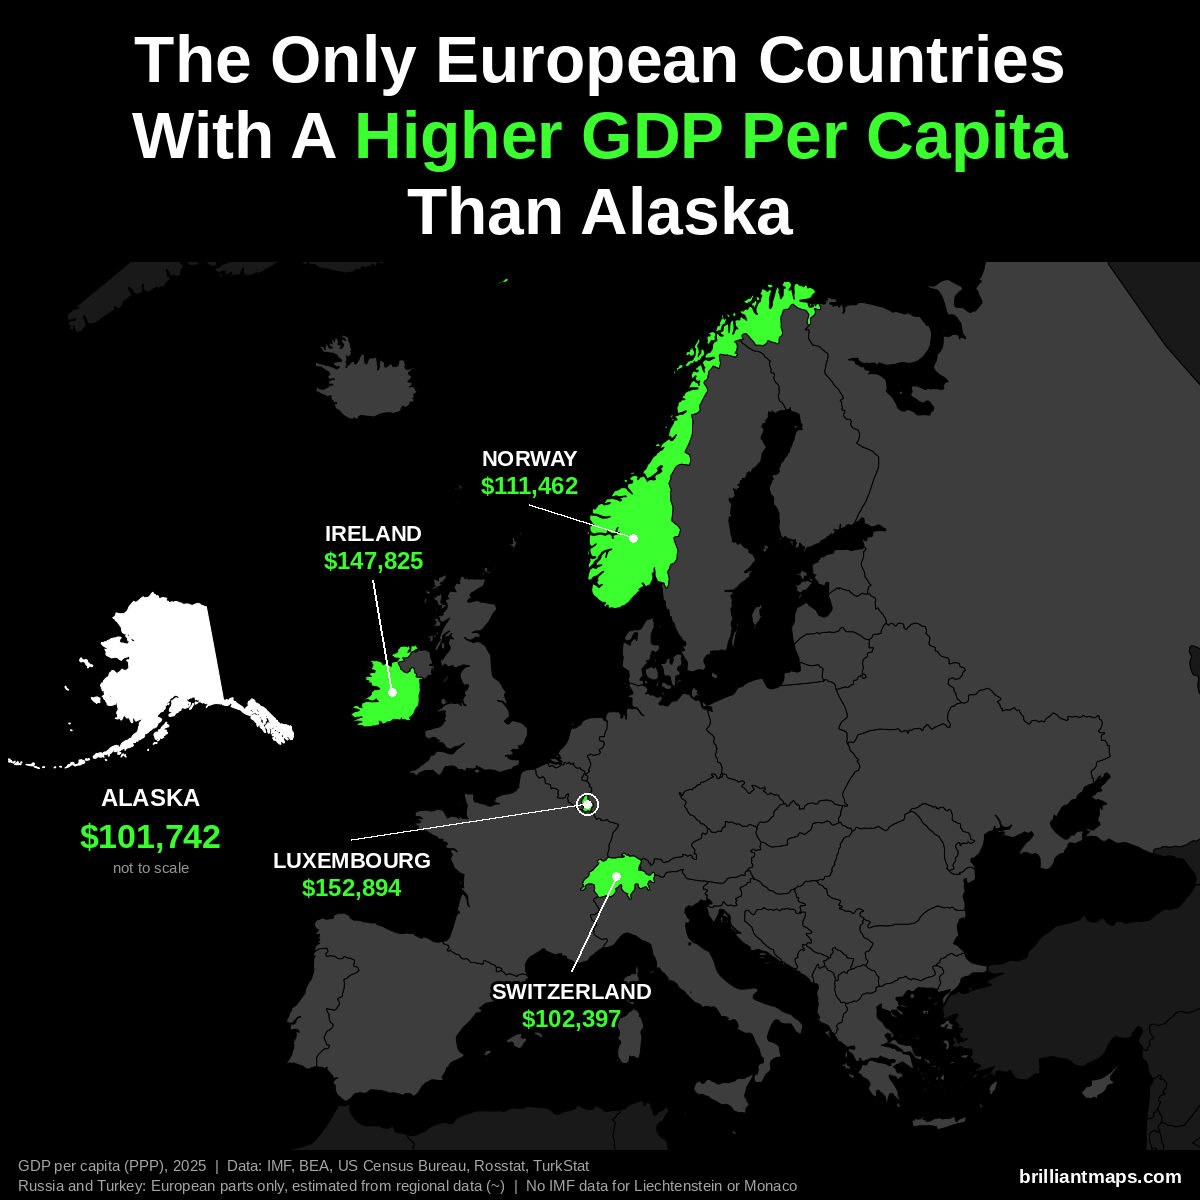
Alaska has a GDP per capita of $101,742 (2025). Only 4 European countries have a higher GDP per capita at purchasing power parity:
- Luxembourg: $152,894
- Ireland: $147,825
- Norway: $111,462
- Switzerland: $102,397
Liechtenstein and Monaco are not covered by the IMF data and are not counted here.
Alaska Vs European Size
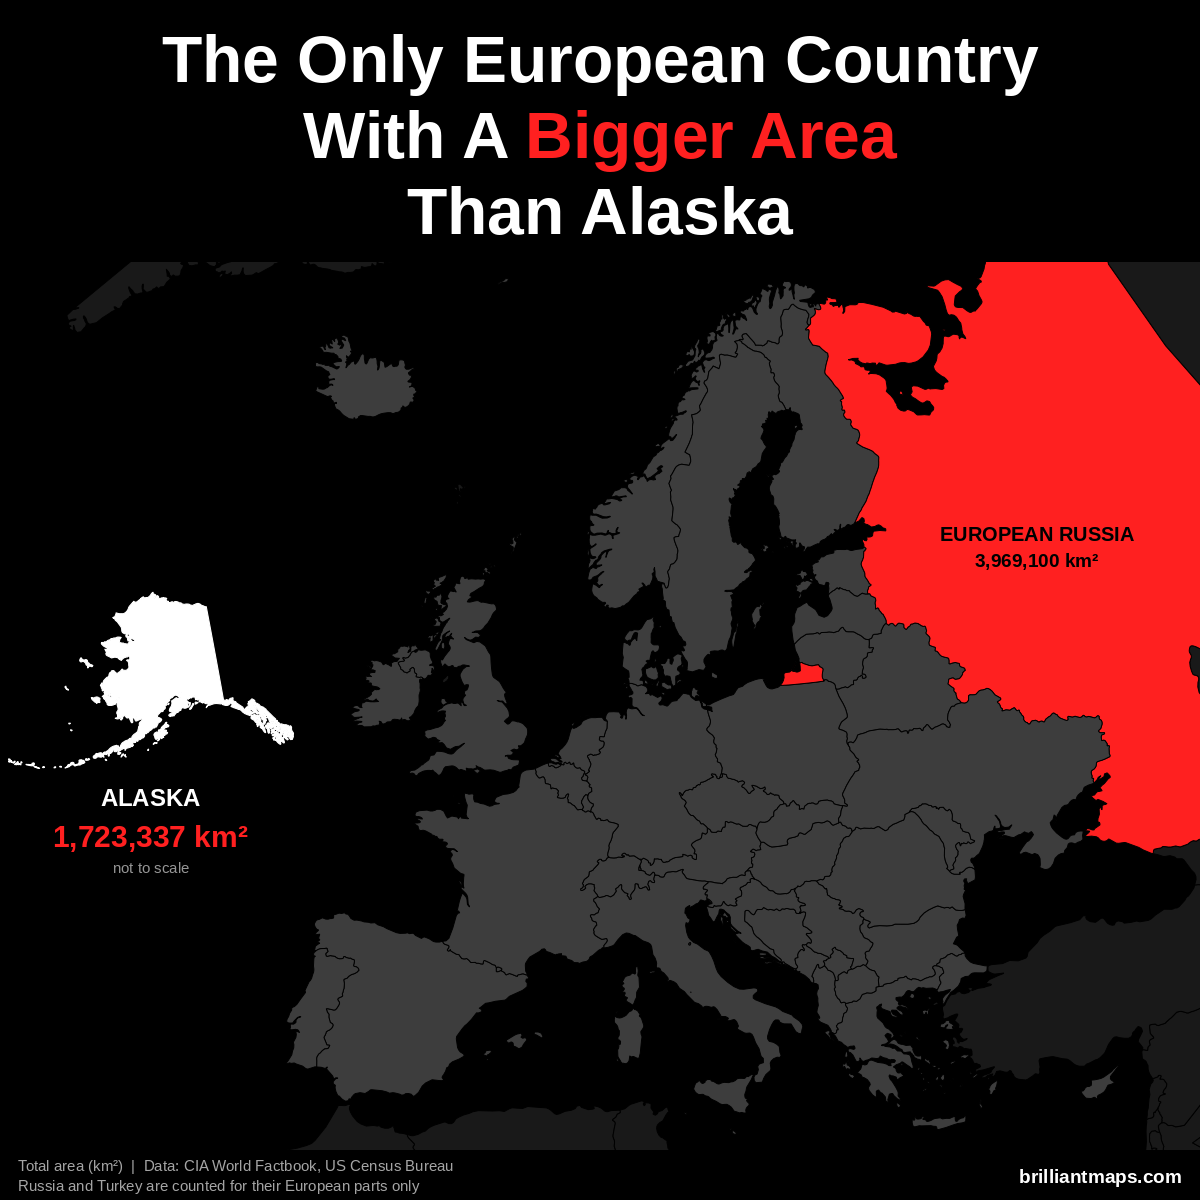
Alaska has a total area of 1,723,337 km² (665,384 sq mi). Only 1 European country has a bigger area:
- Russia (European part): 3,969,100 km² (1,532,477 sq mi)
Alaska Vs European Life Expectancy
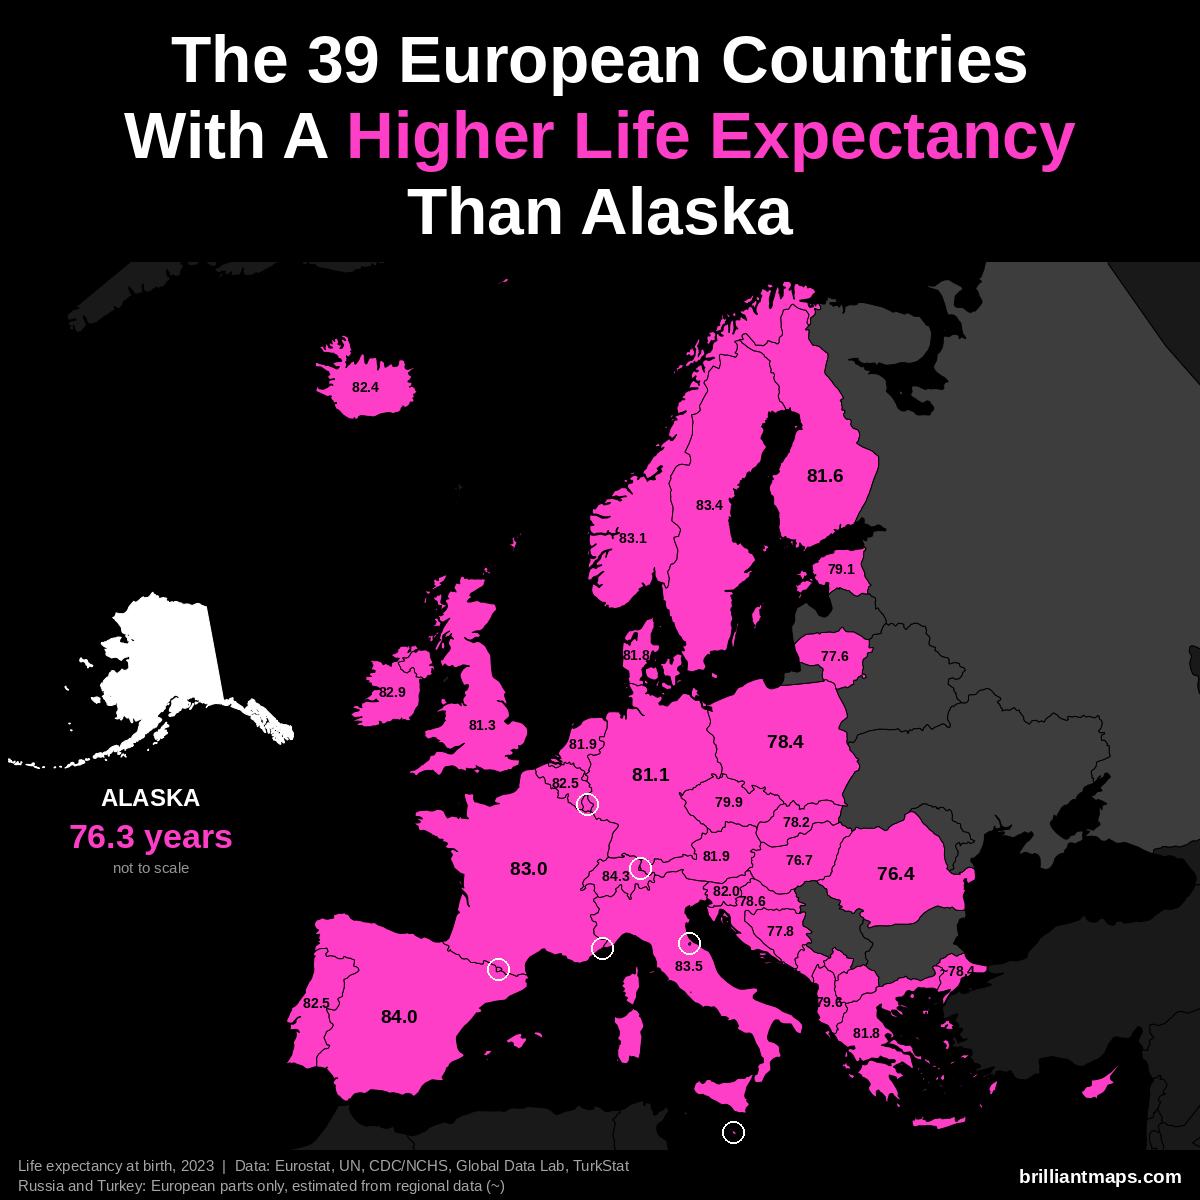
Alaska has a life expectancy at birth of 76.3 years (2023). 39 European countries have a higher life expectancy:
- Monaco: 86.4 years
- San Marino: 85.7 years
- Liechtenstein: 84.6 years
- Switzerland: 84.3 years
- Andorra: 84.0 years
- Spain: 84.0 years
- Italy: 83.5 years
- Luxembourg: 83.4 years
- Malta: 83.4 years
- Sweden: 83.4 years
- Norway: 83.1 years
- France: 83.0 years
- Cyprus: 82.9 years
- Ireland: 82.9 years
- Belgium: 82.5 years
- Portugal: 82.5 years
- Iceland: 82.4 years
- Slovenia: 82.0 years
- Austria: 81.9 years
- Netherlands: 81.9 years
- Denmark: 81.8 years
- Greece: 81.8 years
- Finland: 81.6 years
- United Kingdom: 81.3 years
- Germany: 81.1 years
- Czechia: 79.9 years
- Albania: 79.6 years
- Estonia: 79.1 years
- Croatia: 78.6 years
- Poland: 78.4 years
- Turkey (European part): ~78.4 years
- Slovakia: 78.2 years
- Kosovo: 78.0 years
- Bosnia and Herzegovina: 77.8 years
- Lithuania: 77.6 years
- Montenegro: 77.6 years
- North Macedonia: 77.4 years
- Hungary: 76.7 years
- Romania: 76.4 years
Arizona vs Europe
Arizona Vs European Population
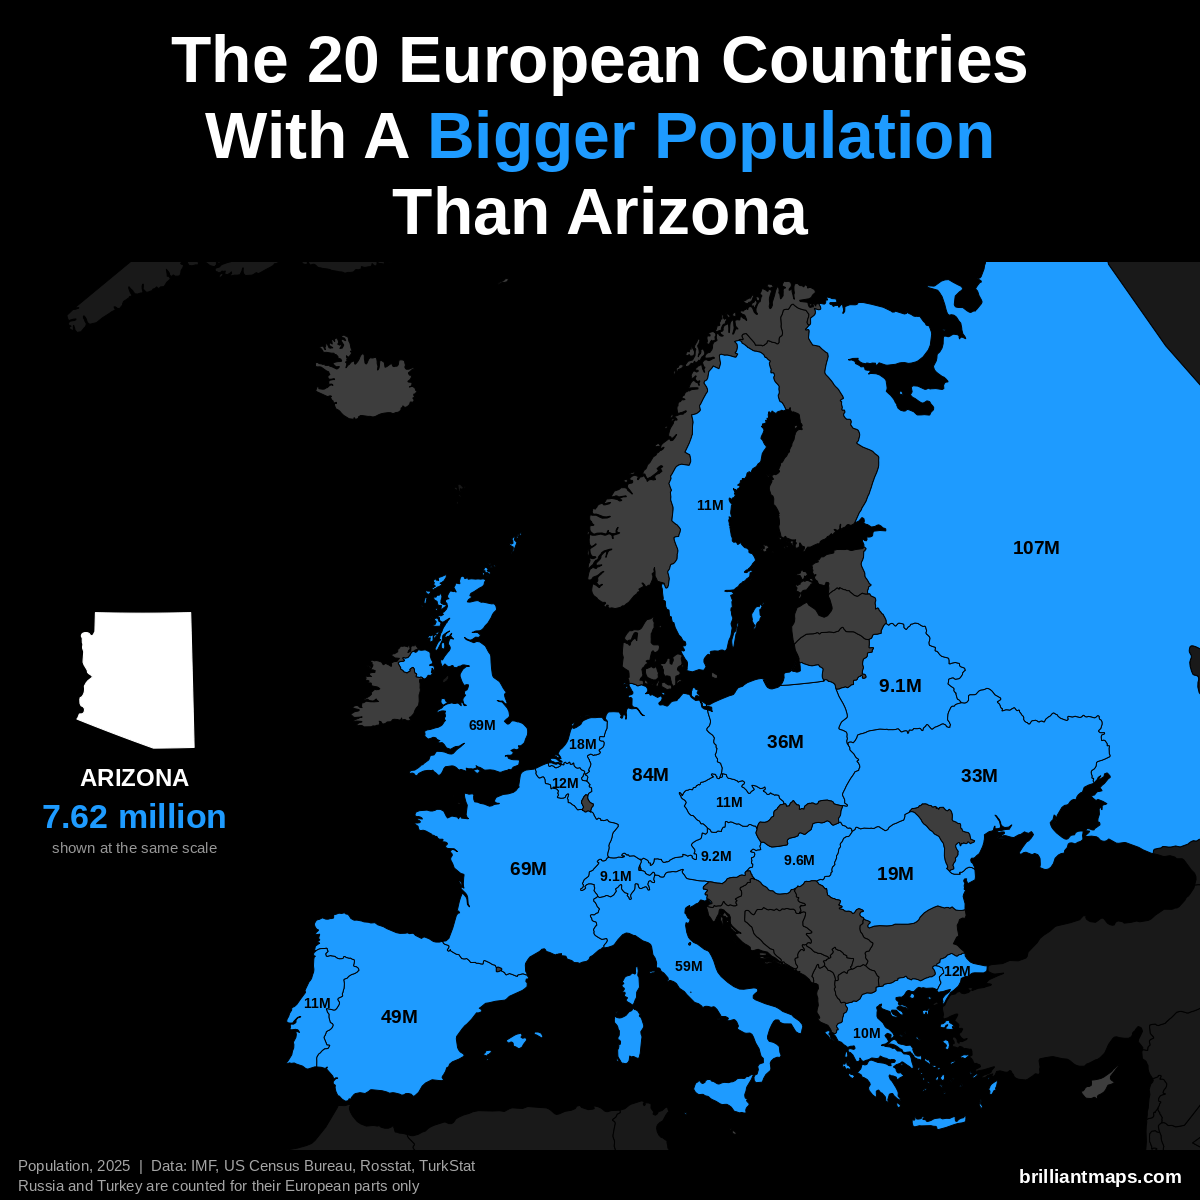
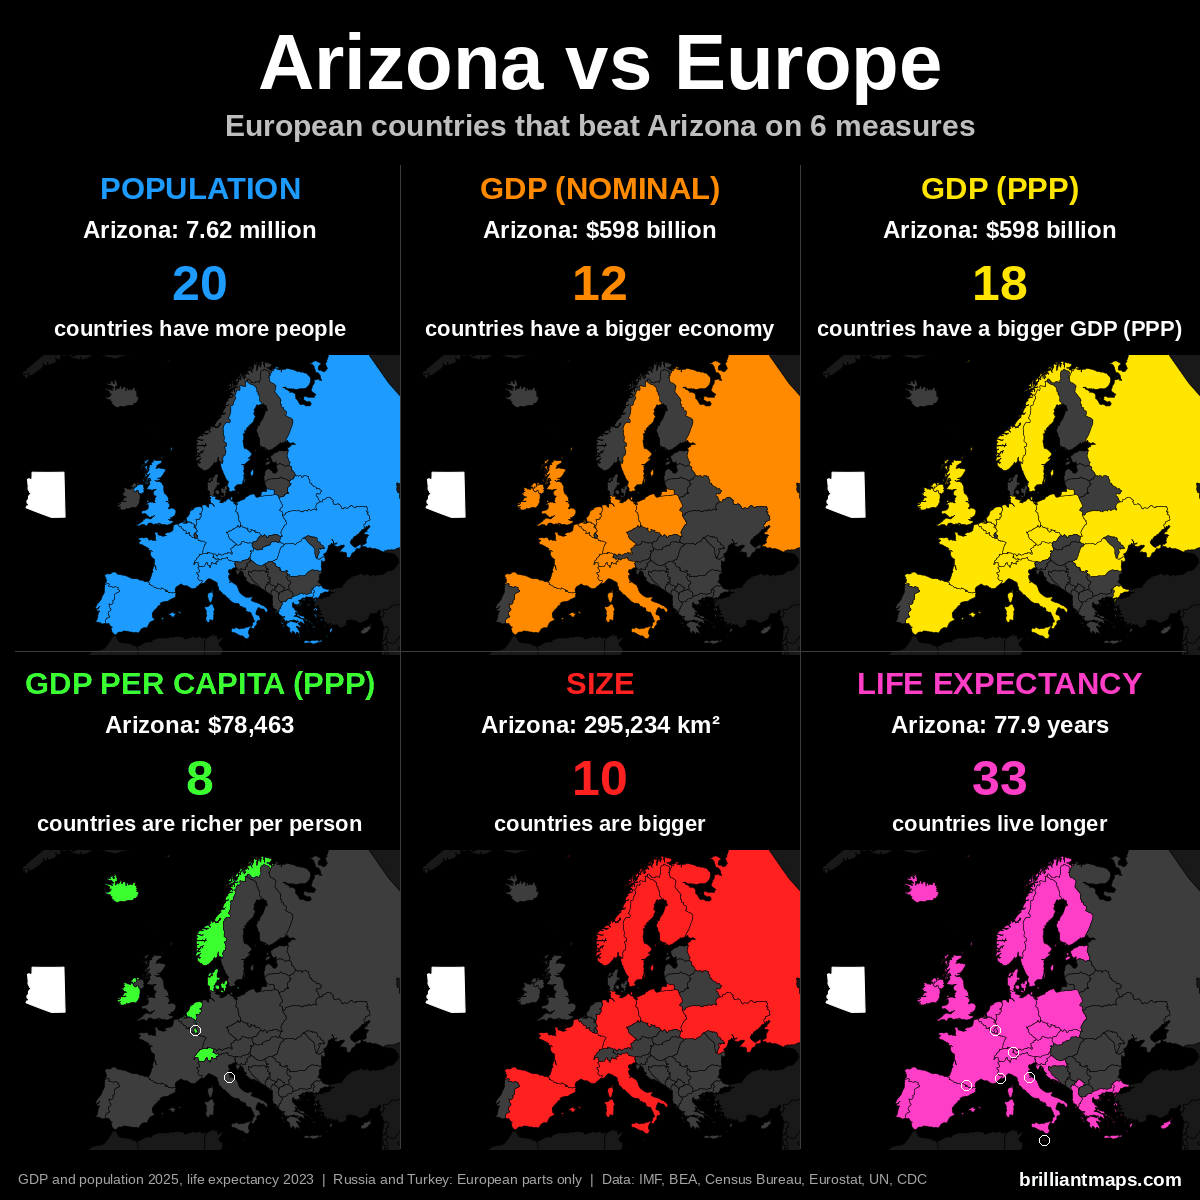
Arizona has a population of 7.6 million (2025). 20 European countries have a bigger population:
- Russia (European part): 107.0 million
- Germany: 83.5 million
- United Kingdom: 69.5 million
- France: 68.9 million
- Italy: 58.9 million
- Spain: 49.5 million
- Poland: 36.5 million
- Ukraine: 32.9 million
- Romania: 19.0 million
- Netherlands: 18.0 million
- Turkey (European part): 12.2 million
- Belgium: 11.9 million
- Portugal: 10.8 million
- Czechia: 10.8 million
- Sweden: 10.7 million
- Greece: 10.4 million
- Hungary: 9.6 million
- Austria: 9.2 million
- Belarus: 9.1 million
- Switzerland: 9.1 million
Arizona Vs European GDP (Nominal)
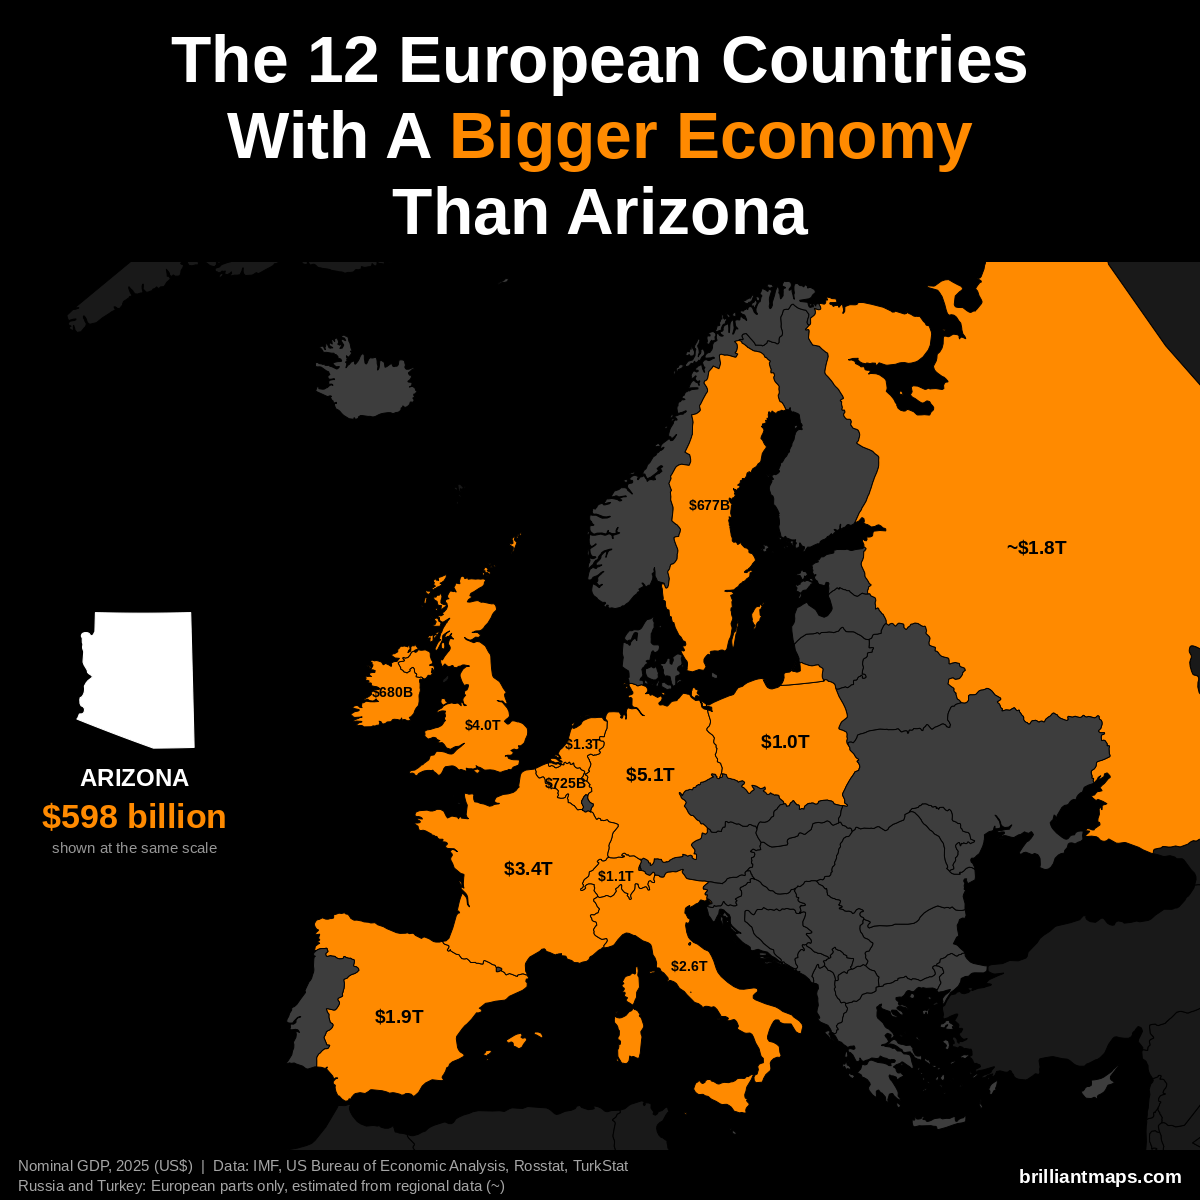
Arizona has a nominal GDP of $598 billion (2025). 12 European countries have a bigger economy:
- Germany: $5.12 trillion
- United Kingdom: $4.01 trillion
- France: $3.38 trillion
- Italy: $2.55 trillion
- Spain: $1.91 trillion
- Russia (European part): ~$1.83 trillion
- Netherlands: $1.32 trillion
- Switzerland: $1.06 trillion
- Poland: $1.04 trillion
- Belgium: $725 billion
- Ireland: $680 billion
- Sweden: $677 billion
Arizona Vs European GDP (PPP)
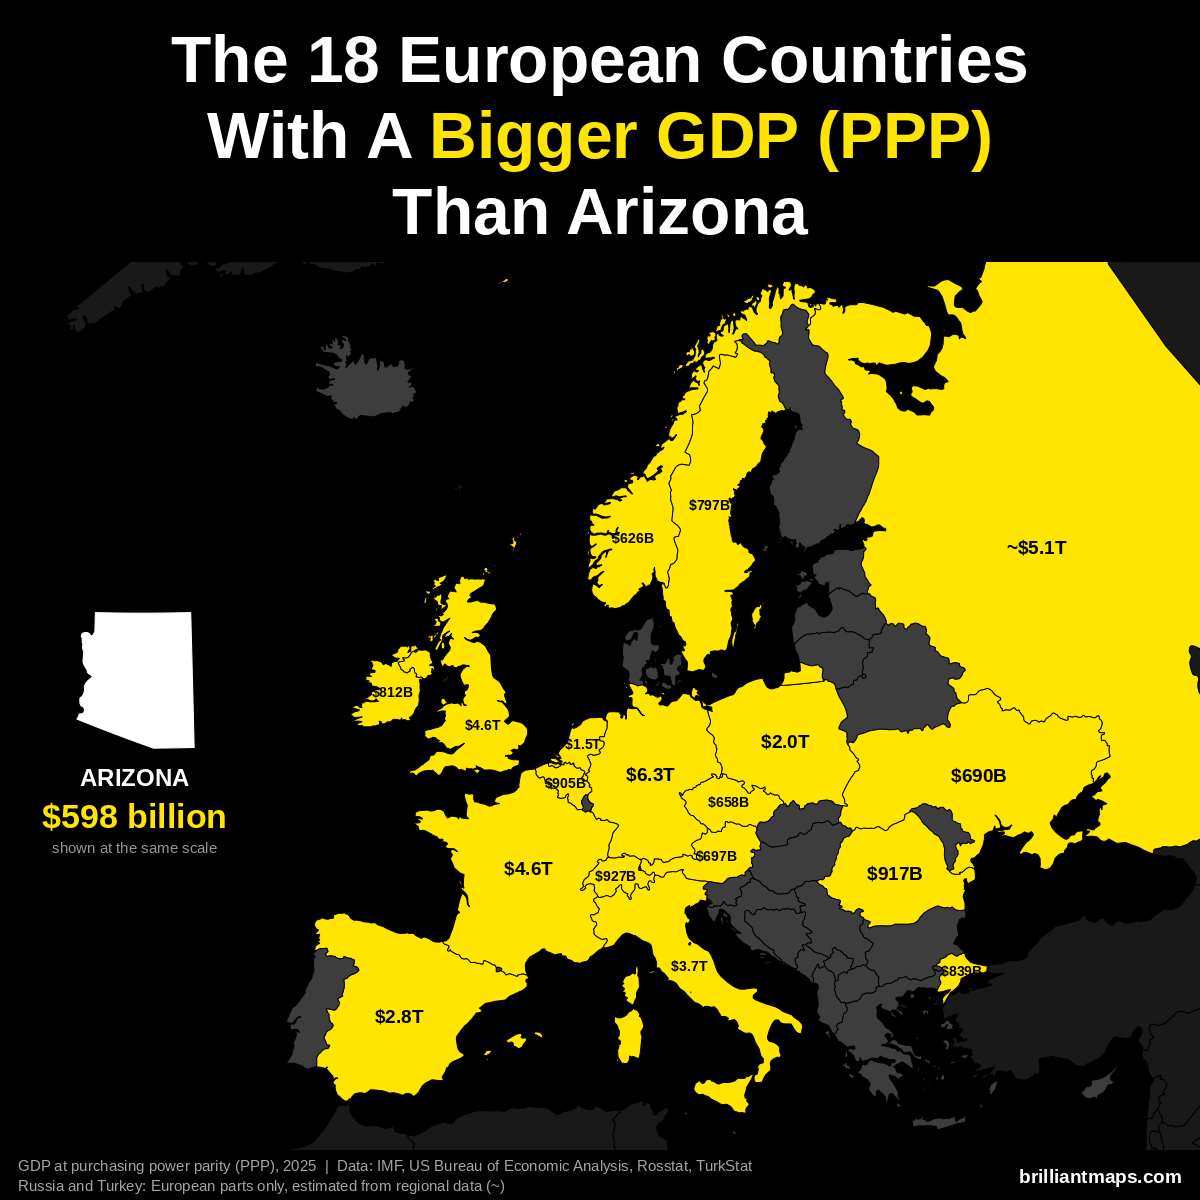
Arizona has a GDP of $598 billion (2025). US states are already measured in the dollars PPP is based on, so the figure is the same as nominal GDP. 18 European countries have a bigger GDP at purchasing power parity:
- Germany: $6.26 trillion
- Russia (European part): ~$5.14 trillion
- France: $4.58 trillion
- United Kingdom: $4.57 trillion
- Italy: $3.74 trillion
- Spain: $2.83 trillion
- Poland: $2.04 trillion
- Netherlands: $1.52 trillion
- Switzerland: $927 billion
- Romania: $917 billion
- Belgium: $905 billion
- Turkey (European part): ~$839 billion
- Ireland: $812 billion
- Sweden: $797 billion
- Austria: $697 billion
- Ukraine: $690 billion
- Czechia: $658 billion
- Norway: $626 billion
Arizona Vs European GDP Per Capita (PPP)
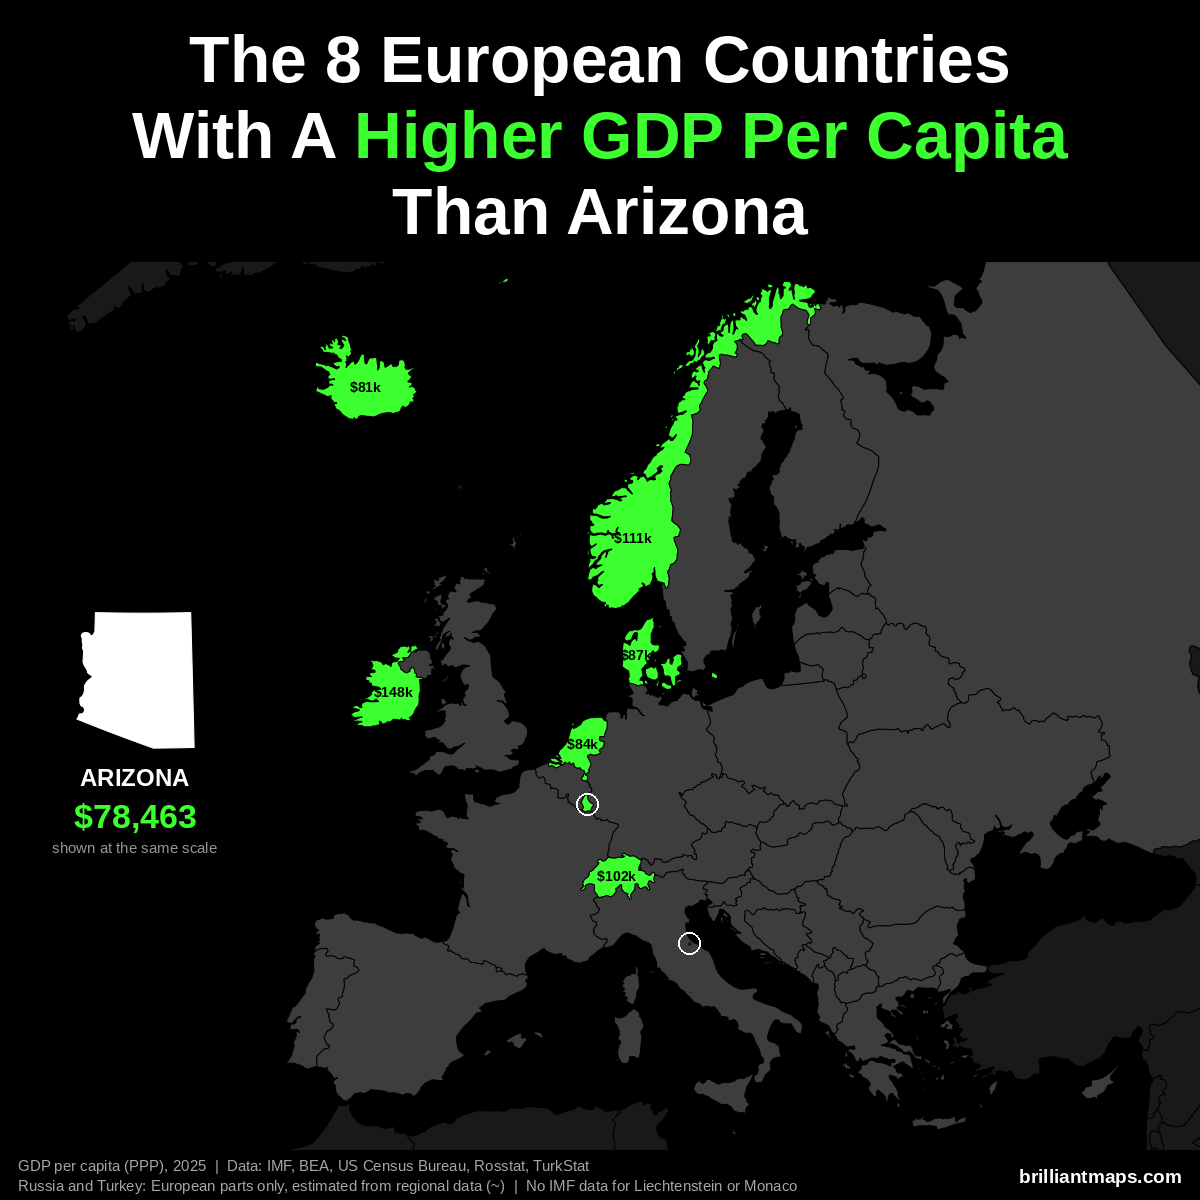
Arizona has a GDP per capita of $78,463 (2025). 8 European countries have a higher GDP per capita at purchasing power parity:
- Luxembourg: $152,894
- Ireland: $147,825
- Norway: $111,462
- Switzerland: $102,397
- Denmark: $87,303
- Netherlands: $84,445
- San Marino: $83,838
- Iceland: $80,915
Liechtenstein and Monaco are not covered by the IMF data and are not counted here.
Arizona Vs European Size
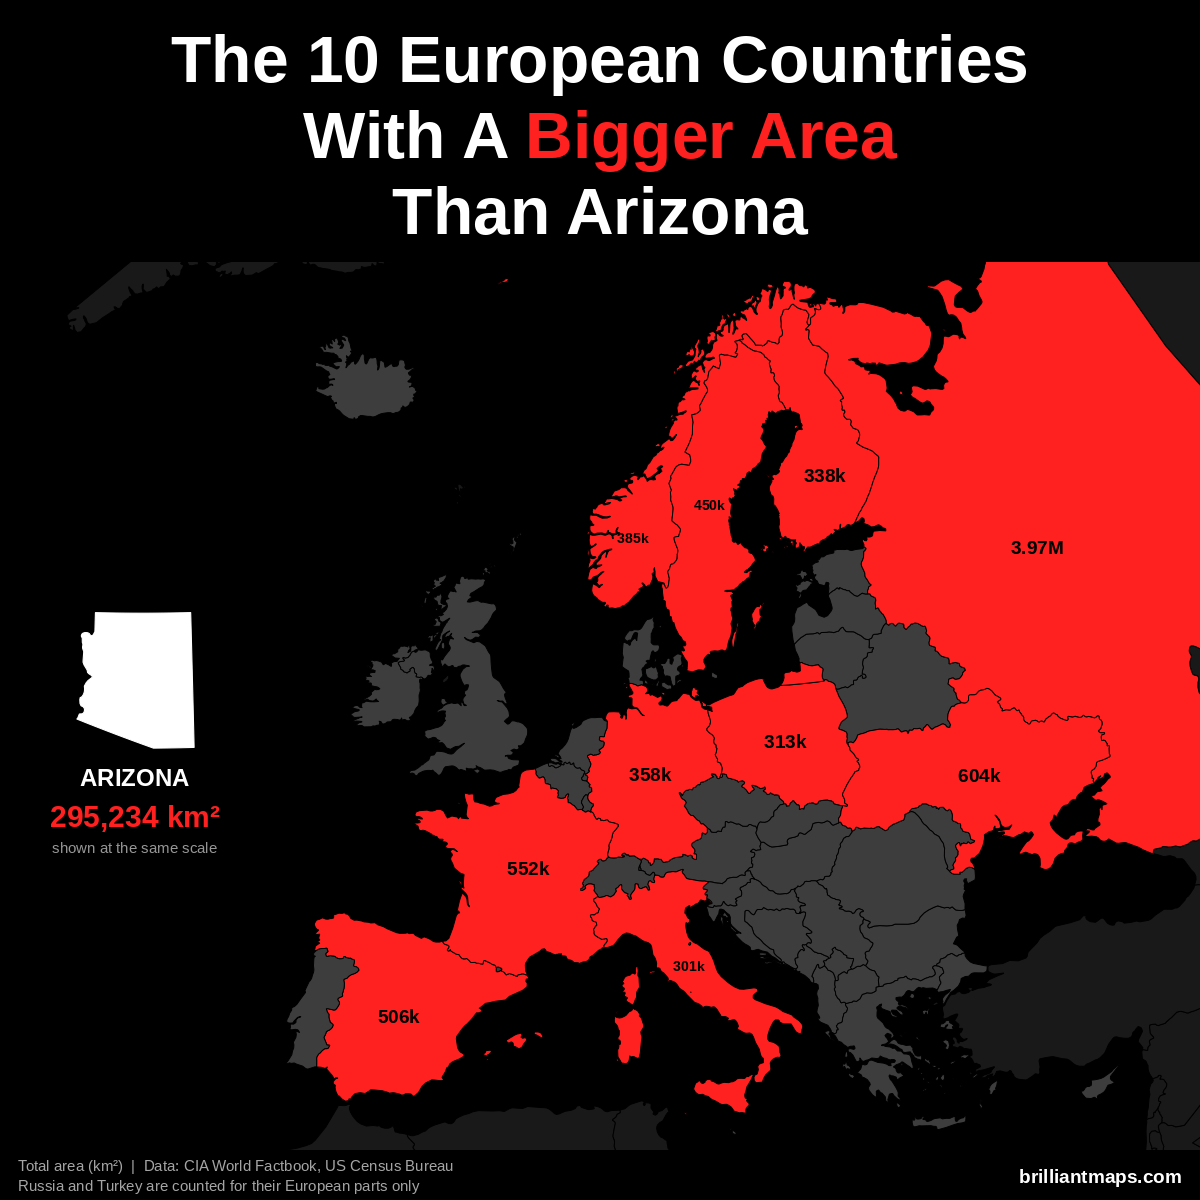
Arizona has a total area of 295,234 km² (113,990 sq mi). 10 European countries have a bigger area:
- Russia (European part): 3,969,100 km² (1,532,477 sq mi)
- Ukraine: 603,550 km² (233,032 sq mi)
- France: 551,695 km² (213,010 sq mi)
- Spain: 505,990 km² (195,364 sq mi)
- Sweden: 450,295 km² (173,860 sq mi)
- Norway: 385,207 km² (148,729 sq mi)
- Germany: 357,588 km² (138,065 sq mi)
- Finland: 338,455 km² (130,678 sq mi)
- Poland: 312,696 km² (120,733 sq mi)
- Italy: 301,340 km² (116,348 sq mi)
Arizona Vs European Life Expectancy
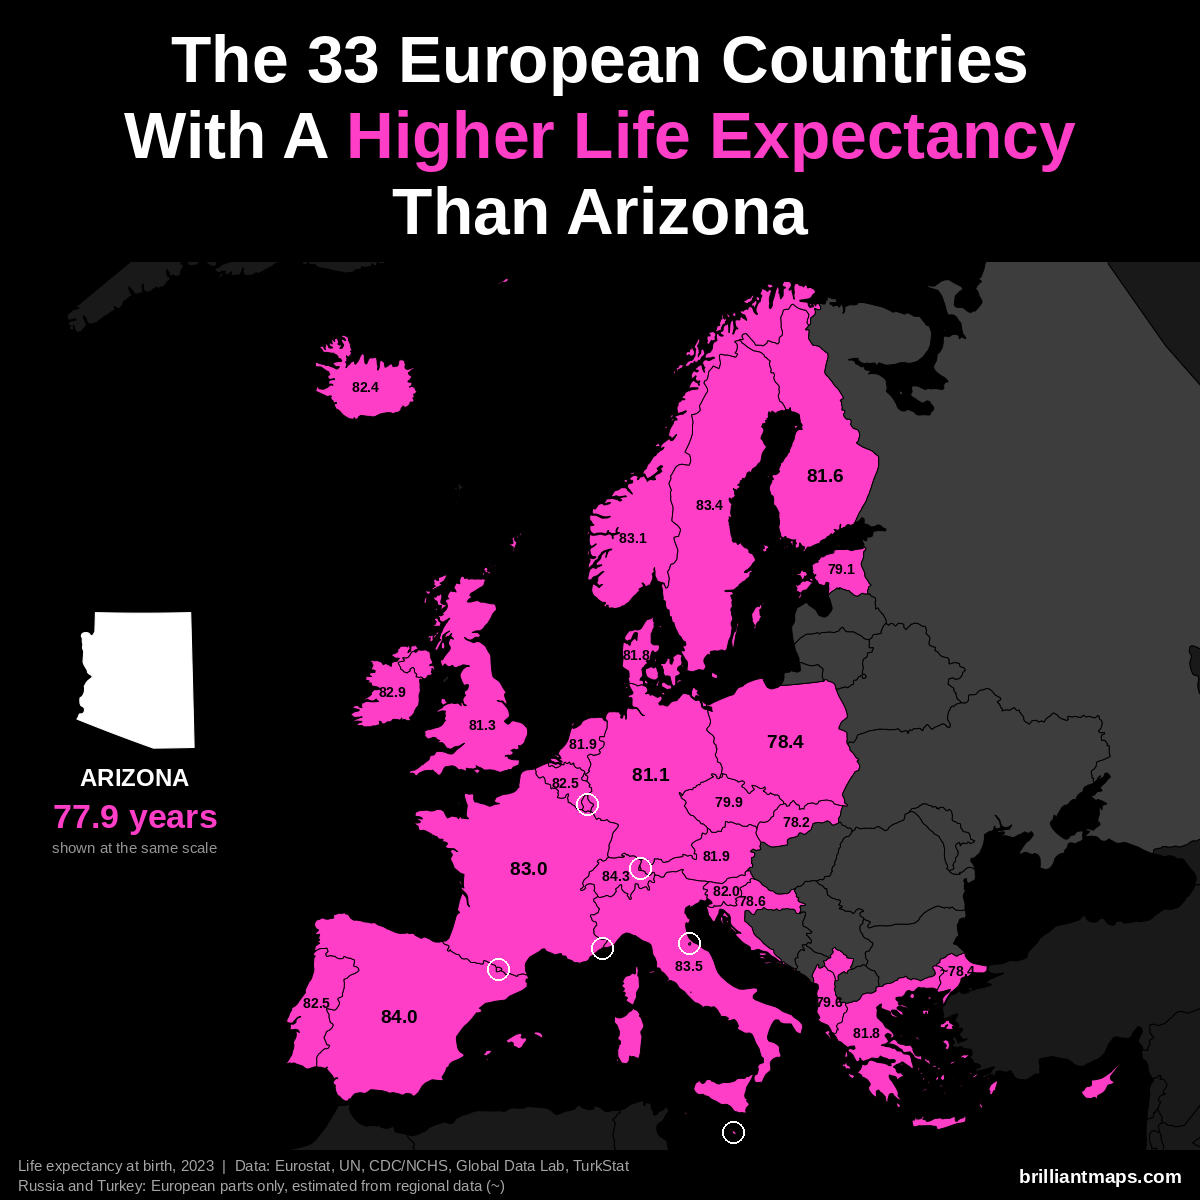
Arizona has a life expectancy at birth of 77.9 years (2023). 33 European countries have a higher life expectancy:
- Monaco: 86.4 years
- San Marino: 85.7 years
- Liechtenstein: 84.6 years
- Switzerland: 84.3 years
- Andorra: 84.0 years
- Spain: 84.0 years
- Italy: 83.5 years
- Luxembourg: 83.4 years
- Malta: 83.4 years
- Sweden: 83.4 years
- Norway: 83.1 years
- France: 83.0 years
- Cyprus: 82.9 years
- Ireland: 82.9 years
- Belgium: 82.5 years
- Portugal: 82.5 years
- Iceland: 82.4 years
- Slovenia: 82.0 years
- Austria: 81.9 years
- Netherlands: 81.9 years
- Denmark: 81.8 years
- Greece: 81.8 years
- Finland: 81.6 years
- United Kingdom: 81.3 years
- Germany: 81.1 years
- Czechia: 79.9 years
- Albania: 79.6 years
- Estonia: 79.1 years
- Croatia: 78.6 years
- Poland: 78.4 years
- Turkey (European part): ~78.4 years
- Slovakia: 78.2 years
- Kosovo: 78.0 years
Arkansas vs Europe
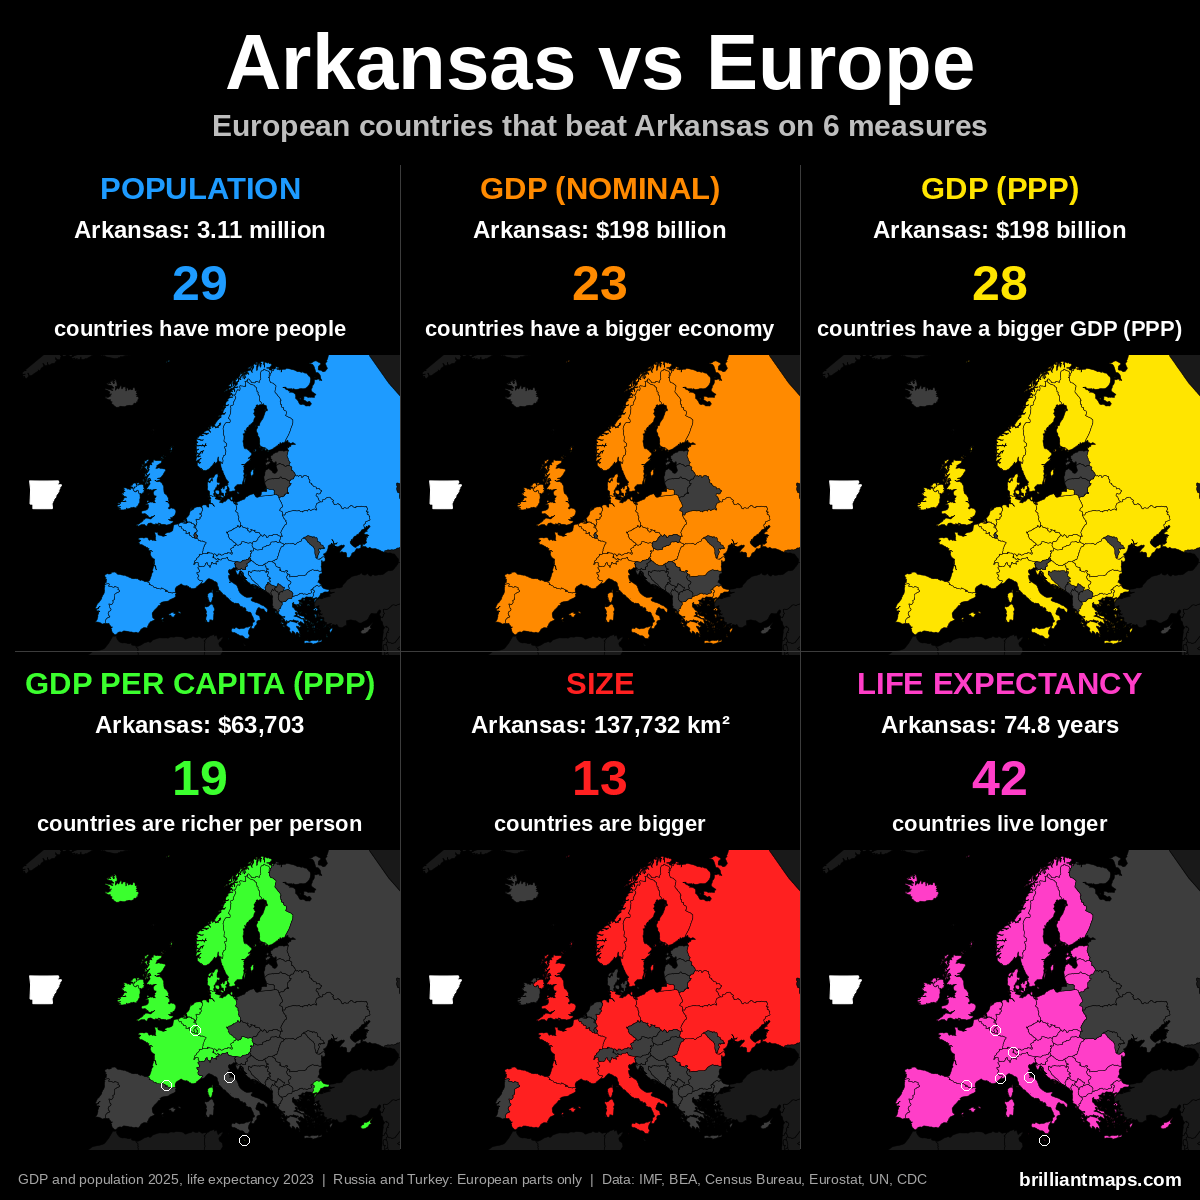
Arkansas Vs European Population
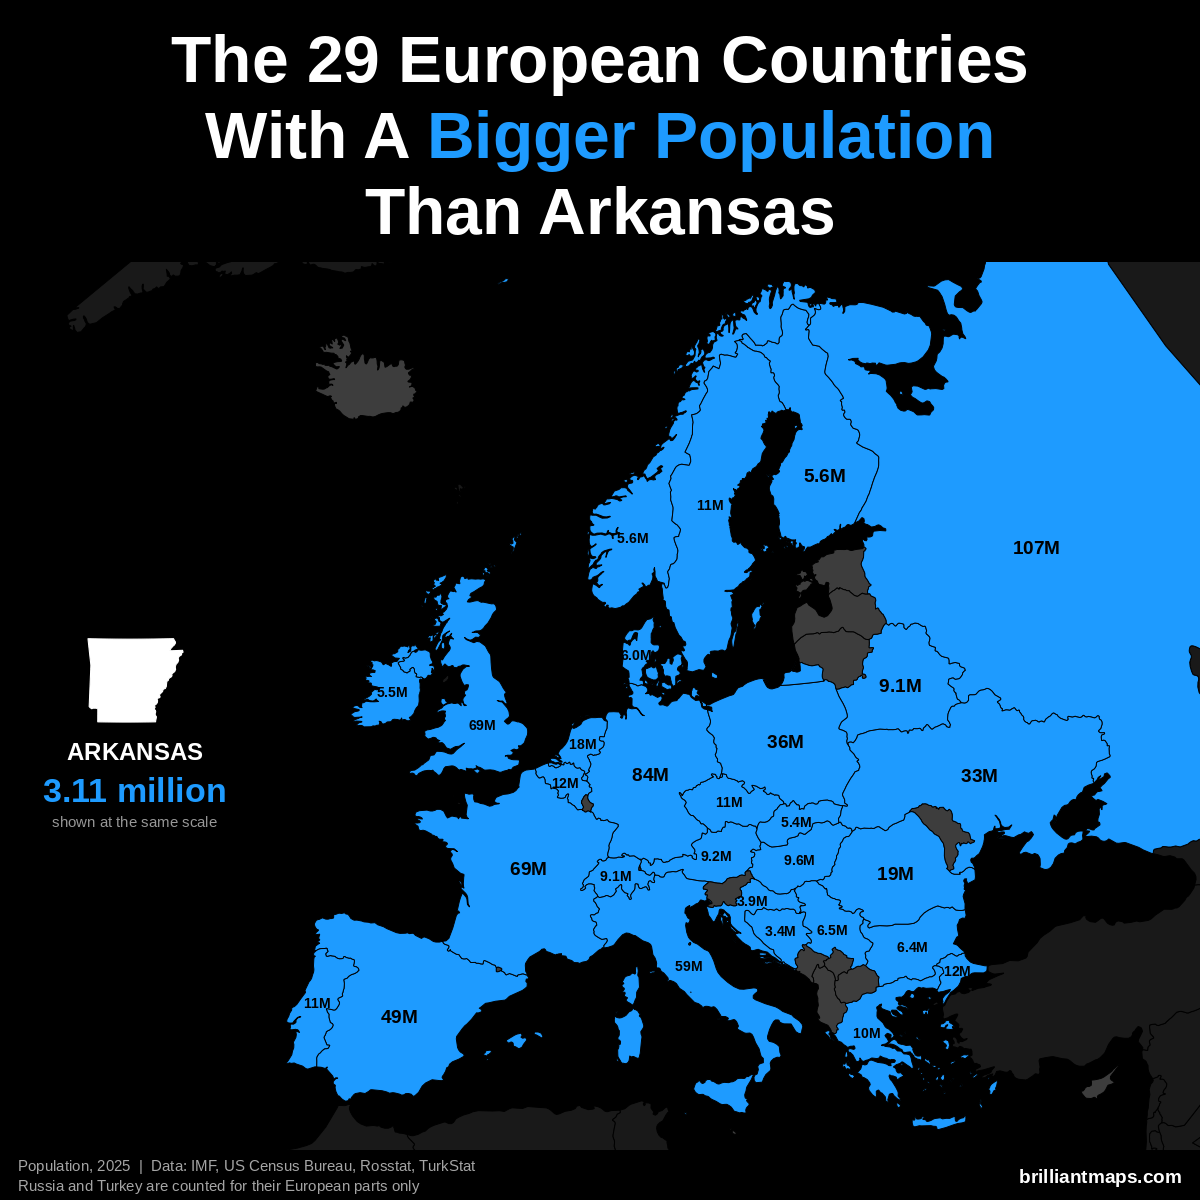
Arkansas has a population of 3.1 million (2025). 29 European countries have a bigger population:
- Russia (European part): 107.0 million
- Germany: 83.5 million
- United Kingdom: 69.5 million
- France: 68.9 million
- Italy: 58.9 million
- Spain: 49.5 million
- Poland: 36.5 million
- Ukraine: 32.9 million
- Romania: 19.0 million
- Netherlands: 18.0 million
- Turkey (European part): 12.2 million
- Belgium: 11.9 million
- Portugal: 10.8 million
- Czechia: 10.8 million
- Sweden: 10.7 million
- Greece: 10.4 million
- Hungary: 9.6 million
- Austria: 9.2 million
- Belarus: 9.1 million
- Switzerland: 9.1 million
- Serbia: 6.5 million
- Bulgaria: 6.4 million
- Denmark: 6.0 million
- Norway: 5.6 million
- Finland: 5.6 million
- Ireland: 5.5 million
- Slovakia: 5.4 million
- Croatia: 3.9 million
- Bosnia and Herzegovina: 3.4 million
Arkansas Vs European GDP (Nominal)
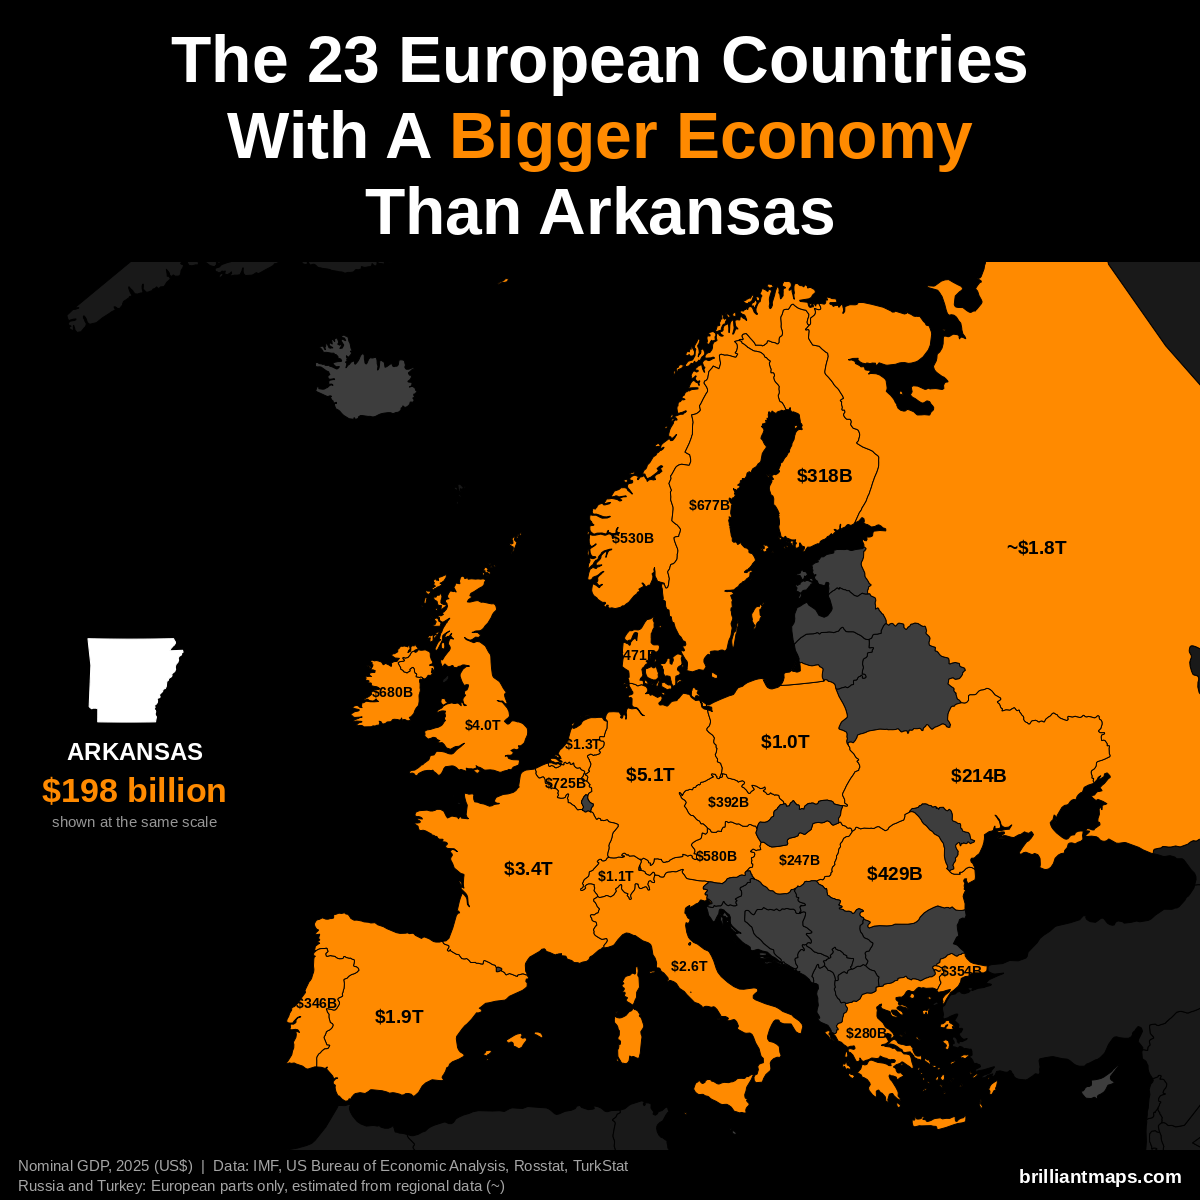
Arkansas has a nominal GDP of $198 billion (2025). 23 European countries have a bigger economy:
- Germany: $5.12 trillion
- United Kingdom: $4.01 trillion
- France: $3.38 trillion
- Italy: $2.55 trillion
- Spain: $1.91 trillion
- Russia (European part): ~$1.83 trillion
- Netherlands: $1.32 trillion
- Switzerland: $1.06 trillion
- Poland: $1.04 trillion
- Belgium: $725 billion
- Ireland: $680 billion
- Sweden: $677 billion
- Austria: $580 billion
- Norway: $530 billion
- Denmark: $471 billion
- Romania: $429 billion
- Czechia: $392 billion
- Turkey (European part): ~$354 billion
- Portugal: $346 billion
- Finland: $318 billion
- Greece: $280 billion
- Hungary: $247 billion
- Ukraine: $214 billion
Arkansas Vs European GDP (PPP)
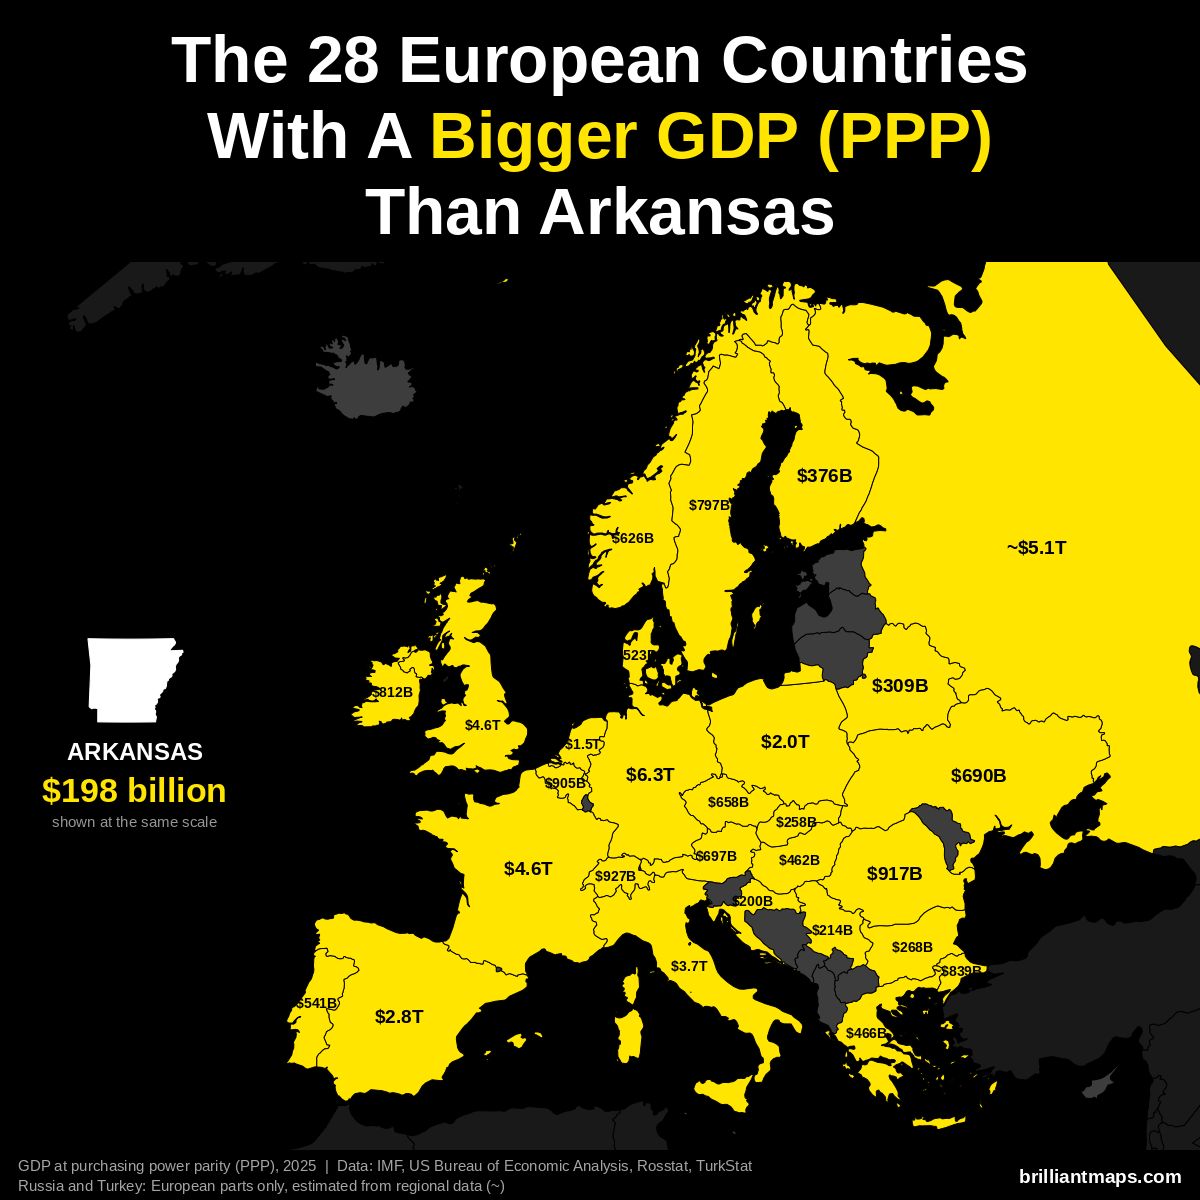
Arkansas has a GDP of $198 billion (2025). US states are already measured in the dollars PPP is based on, so the figure is the same as nominal GDP. 28 European countries have a bigger GDP at purchasing power parity:
- Germany: $6.26 trillion
- Russia (European part): ~$5.14 trillion
- France: $4.58 trillion
- United Kingdom: $4.57 trillion
- Italy: $3.74 trillion
- Spain: $2.83 trillion
- Poland: $2.04 trillion
- Netherlands: $1.52 trillion
- Switzerland: $927 billion
- Romania: $917 billion
- Belgium: $905 billion
- Turkey (European part): ~$839 billion
- Ireland: $812 billion
- Sweden: $797 billion
- Austria: $697 billion
- Ukraine: $690 billion
- Czechia: $658 billion
- Norway: $626 billion
- Portugal: $541 billion
- Denmark: $523 billion
- Greece: $466 billion
- Hungary: $462 billion
- Finland: $376 billion
- Belarus: $309 billion
- Bulgaria: $268 billion
- Slovakia: $258 billion
- Serbia: $214 billion
- Croatia: $200 billion
Arkansas Vs European GDP Per Capita (PPP)
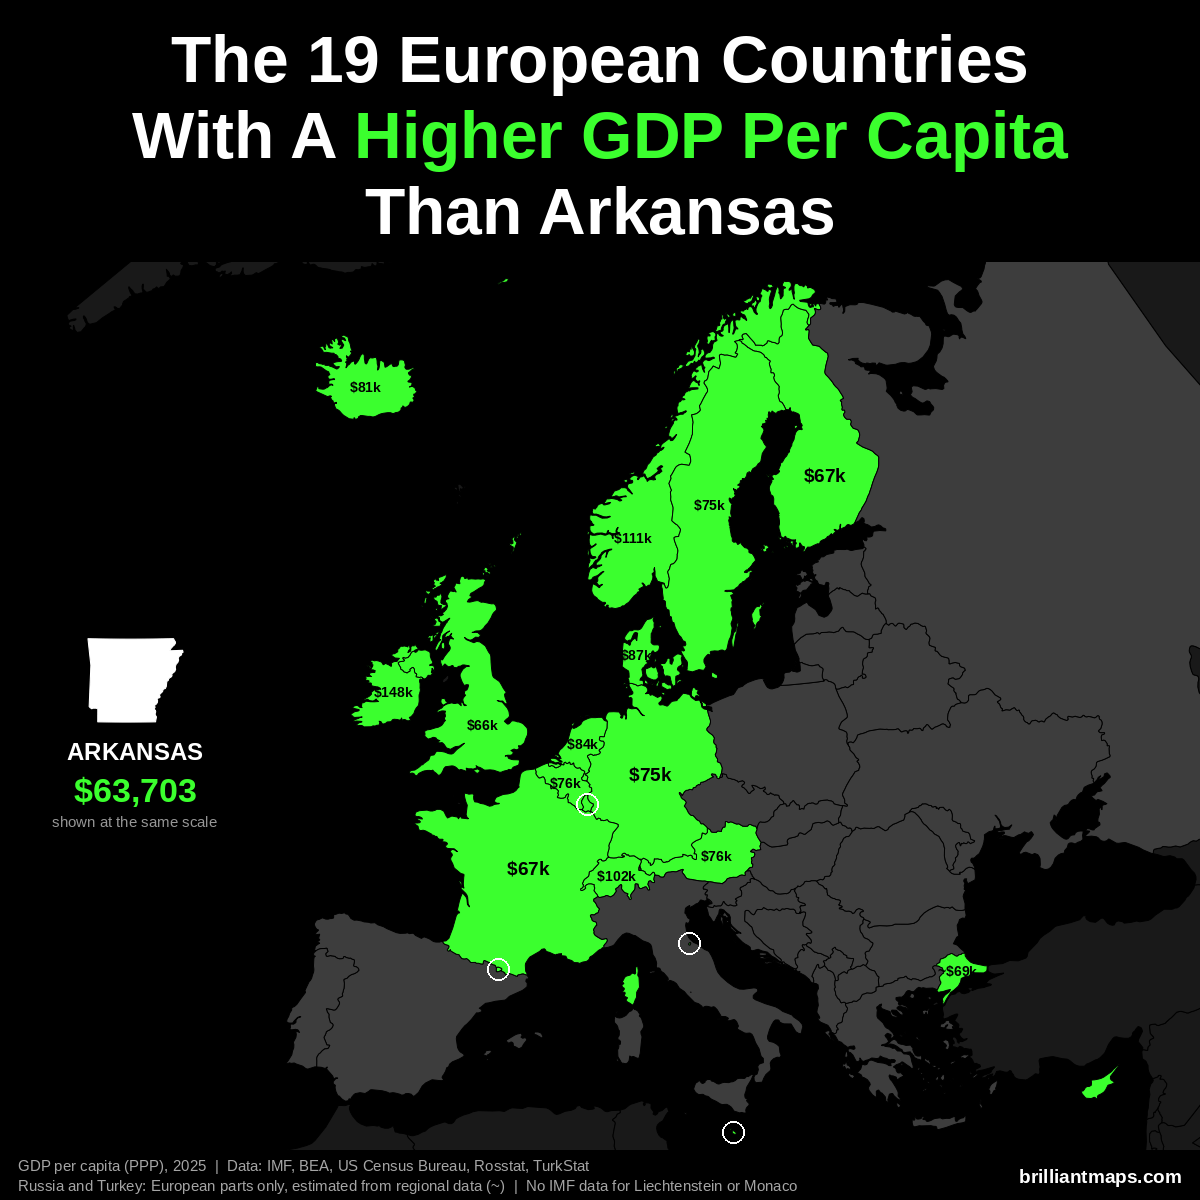
Arkansas has a GDP per capita of $63,703 (2025). 19 European countries have a higher GDP per capita at purchasing power parity:
- Luxembourg: $152,894
- Ireland: $147,825
- Norway: $111,462
- Switzerland: $102,397
- Denmark: $87,303
- Netherlands: $84,445
- San Marino: $83,838
- Iceland: $80,915
- Belgium: $76,136
- Austria: $75,965
- Malta: $75,687
- Germany: $74,901
- Sweden: $74,651
- Andorra: $74,059
- Turkey (European part): ~$68,800
- Finland: $67,097
- France: $66,559
- United Kingdom: $65,758
- Cyprus: $65,038
Liechtenstein and Monaco are not covered by the IMF data and are not counted here.
Arkansas Vs European Size
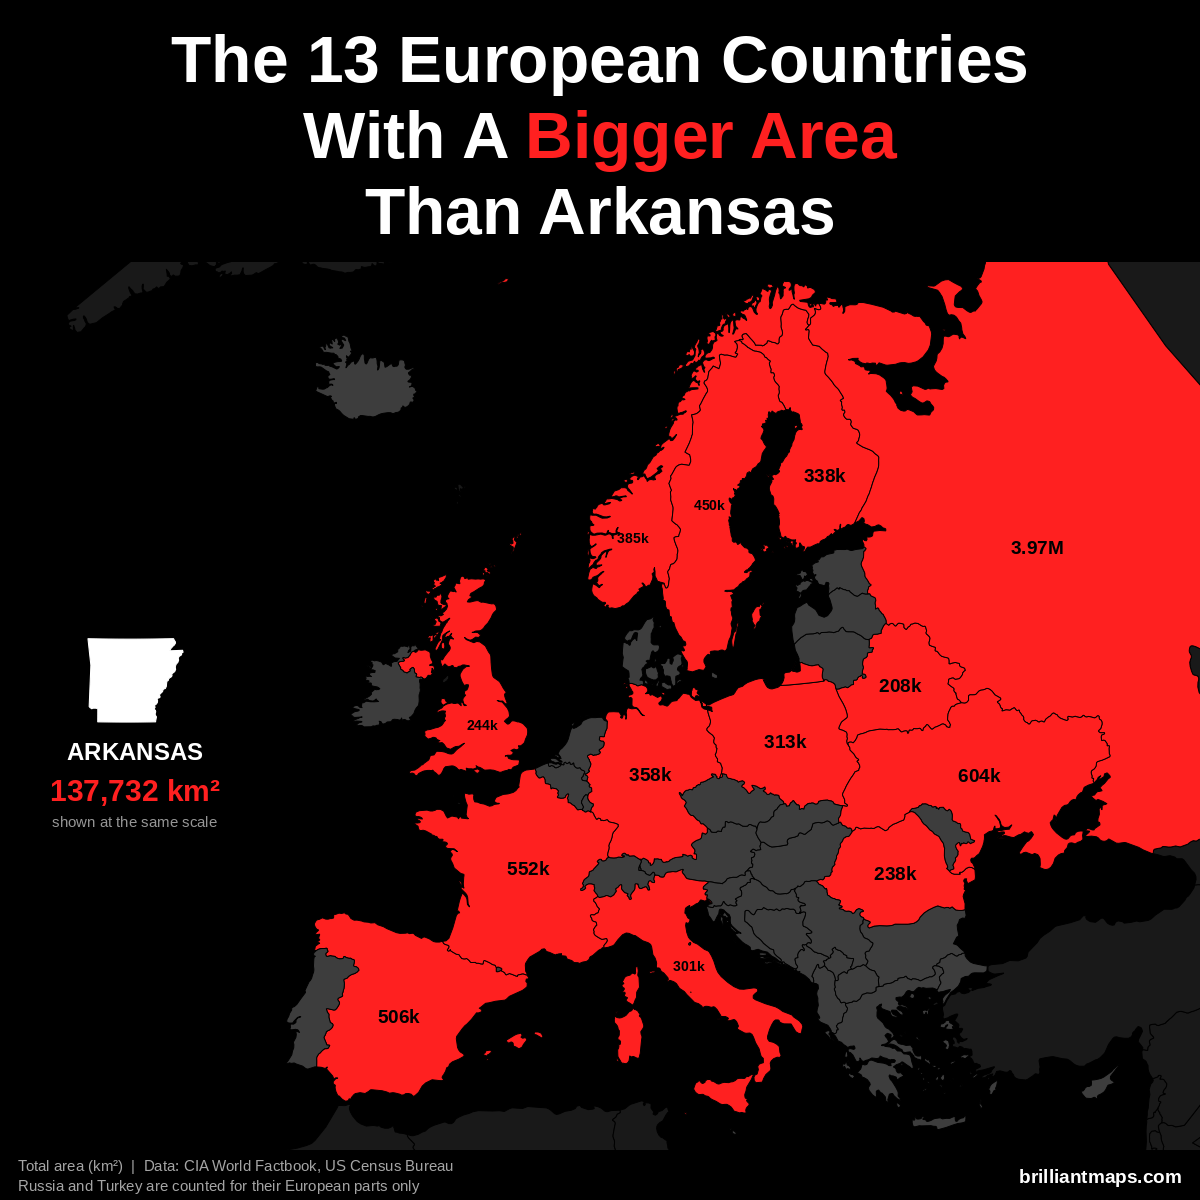
Arkansas has a total area of 137,732 km² (53,179 sq mi). 13 European countries have a bigger area:
- Russia (European part): 3,969,100 km² (1,532,477 sq mi)
- Ukraine: 603,550 km² (233,032 sq mi)
- France: 551,695 km² (213,010 sq mi)
- Spain: 505,990 km² (195,364 sq mi)
- Sweden: 450,295 km² (173,860 sq mi)
- Norway: 385,207 km² (148,729 sq mi)
- Germany: 357,588 km² (138,065 sq mi)
- Finland: 338,455 km² (130,678 sq mi)
- Poland: 312,696 km² (120,733 sq mi)
- Italy: 301,340 km² (116,348 sq mi)
- United Kingdom: 243,610 km² (94,058 sq mi)
- Romania: 238,397 km² (92,046 sq mi)
- Belarus: 207,600 km² (80,155 sq mi)
Arkansas Vs European Life Expectancy
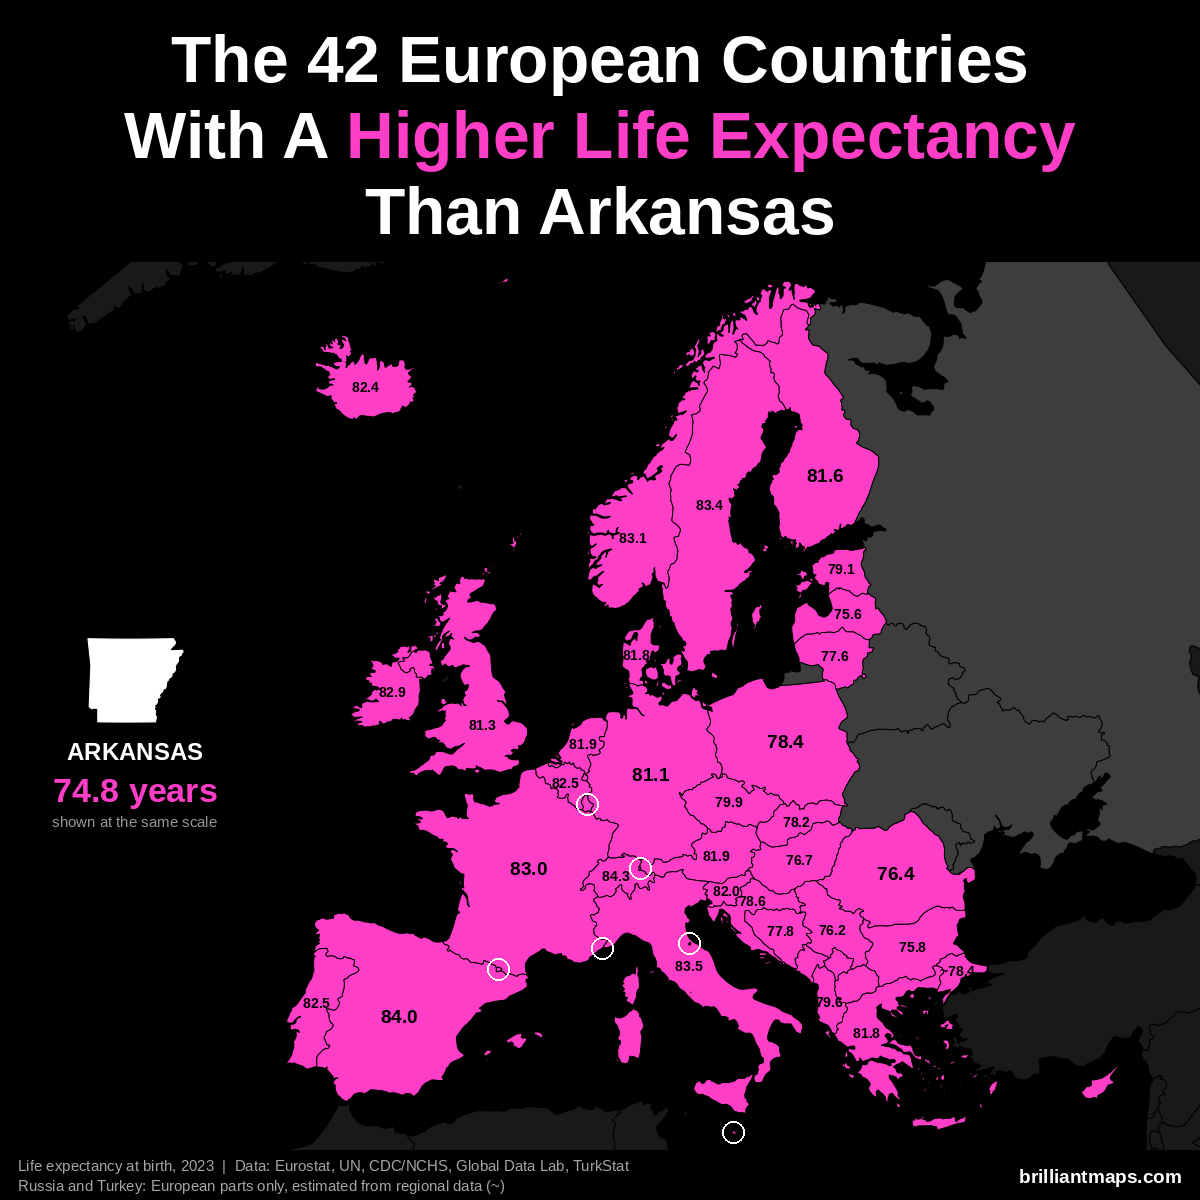
Arkansas has a life expectancy at birth of 74.8 years (2023). 42 European countries have a higher life expectancy:
- Monaco: 86.4 years
- San Marino: 85.7 years
- Liechtenstein: 84.6 years
- Switzerland: 84.3 years
- Andorra: 84.0 years
- Spain: 84.0 years
- Italy: 83.5 years
- Luxembourg: 83.4 years
- Malta: 83.4 years
- Sweden: 83.4 years
- Norway: 83.1 years
- France: 83.0 years
- Cyprus: 82.9 years
- Ireland: 82.9 years
- Belgium: 82.5 years
- Portugal: 82.5 years
- Iceland: 82.4 years
- Slovenia: 82.0 years
- Austria: 81.9 years
- Netherlands: 81.9 years
- Denmark: 81.8 years
- Greece: 81.8 years
- Finland: 81.6 years
- United Kingdom: 81.3 years
- Germany: 81.1 years
- Czechia: 79.9 years
- Albania: 79.6 years
- Estonia: 79.1 years
- Croatia: 78.6 years
- Poland: 78.4 years
- Turkey (European part): ~78.4 years
- Slovakia: 78.2 years
- Kosovo: 78.0 years
- Bosnia and Herzegovina: 77.8 years
- Lithuania: 77.6 years
- Montenegro: 77.6 years
- North Macedonia: 77.4 years
- Hungary: 76.7 years
- Romania: 76.4 years
- Serbia: 76.2 years
- Bulgaria: 75.8 years
- Latvia: 75.6 years
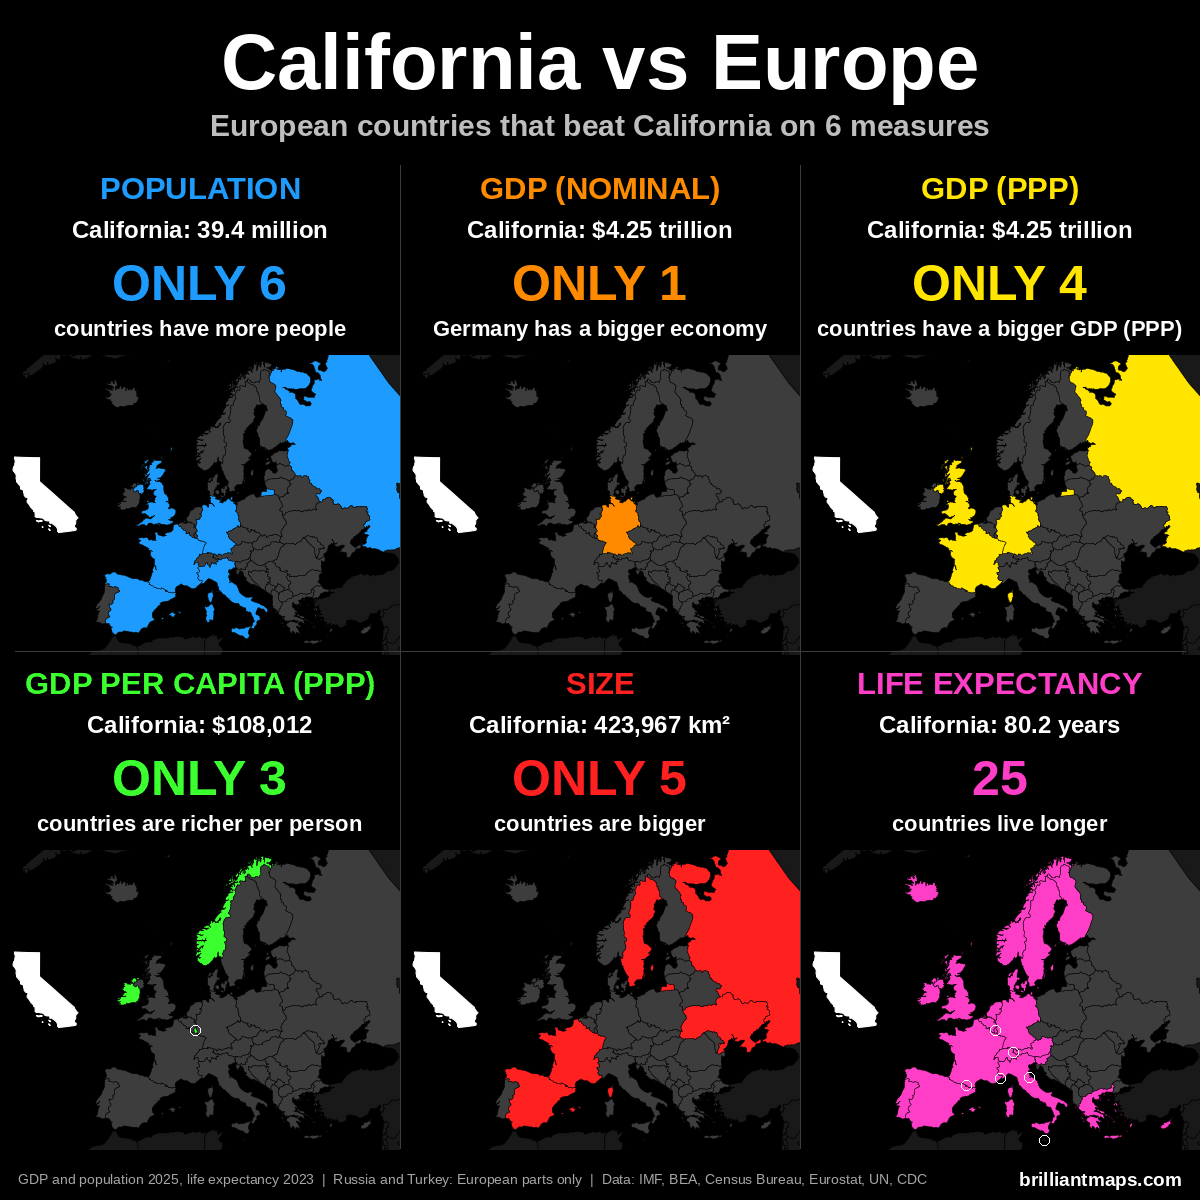
California vs Europe
California Vs European Population
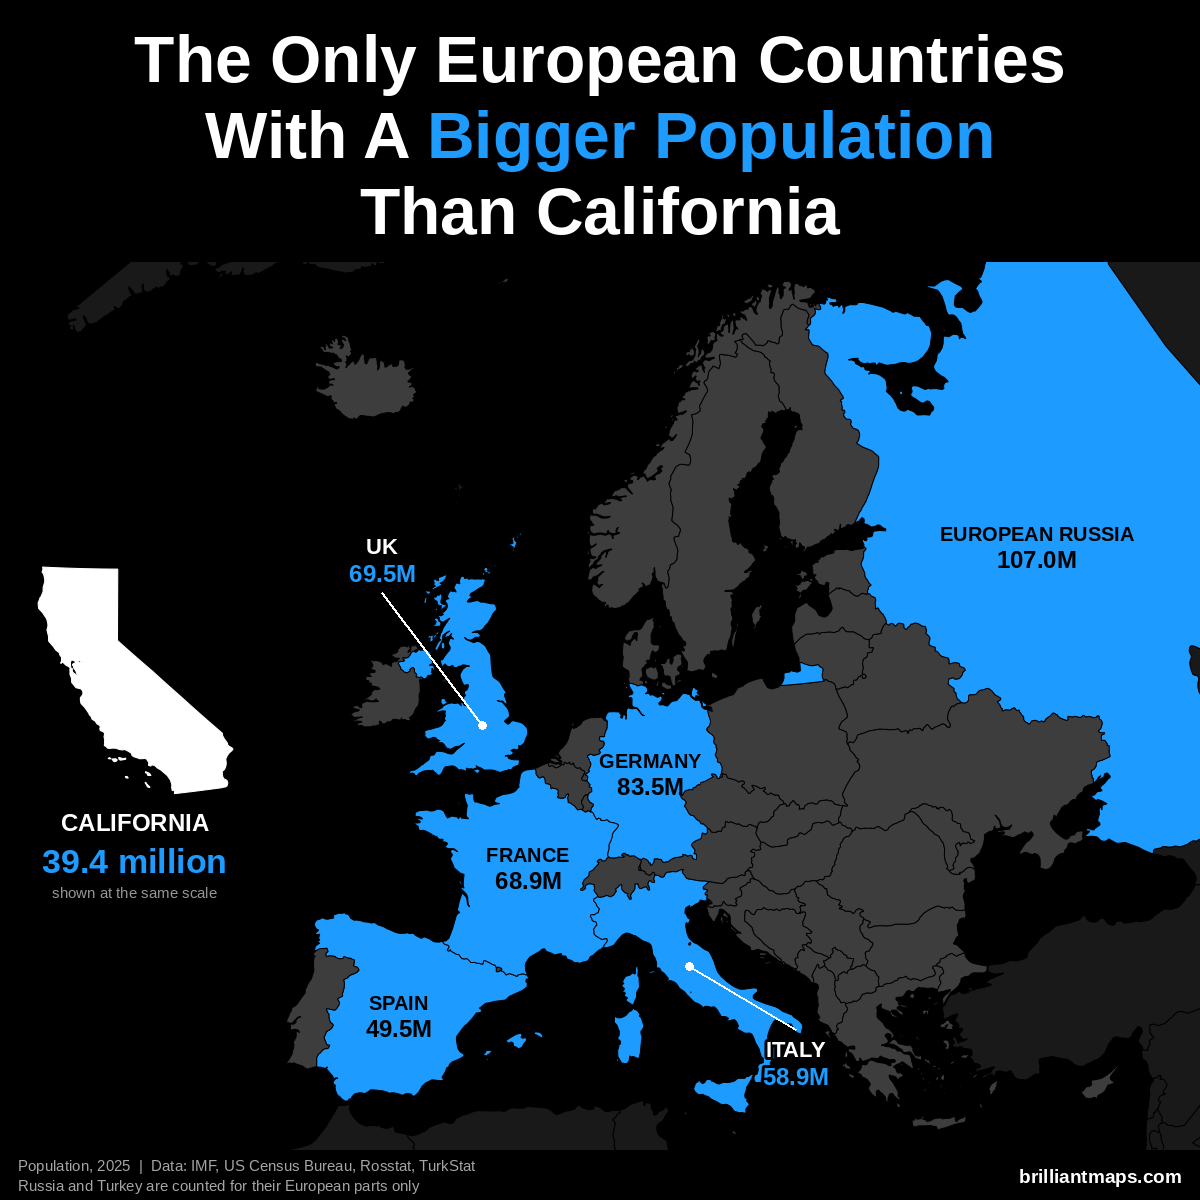
California has a population of 39.4 million (2025). Only 6 European countries have a bigger population:
- Russia (European part): 107.0 million
- Germany: 83.5 million
- United Kingdom: 69.5 million
- France: 68.9 million
- Italy: 58.9 million
- Spain: 49.5 million
California Vs European GDP (Nominal)
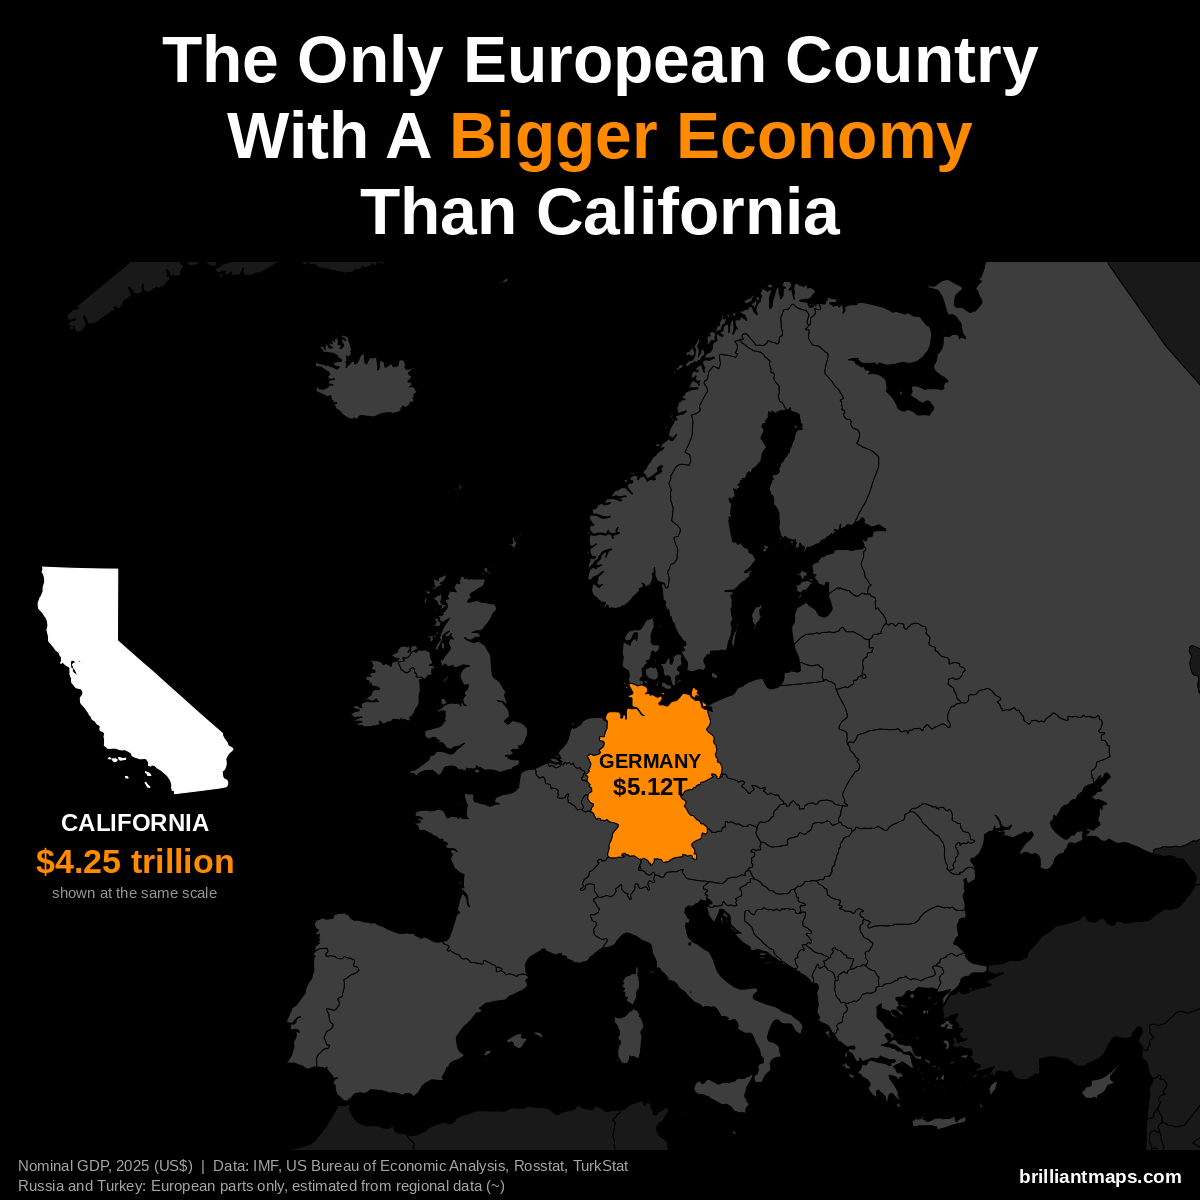
California has a nominal GDP of $4.25 trillion (2025). Only 1 European country has a bigger economy:
- Germany: $5.12 trillion
California Vs European GDP (PPP)
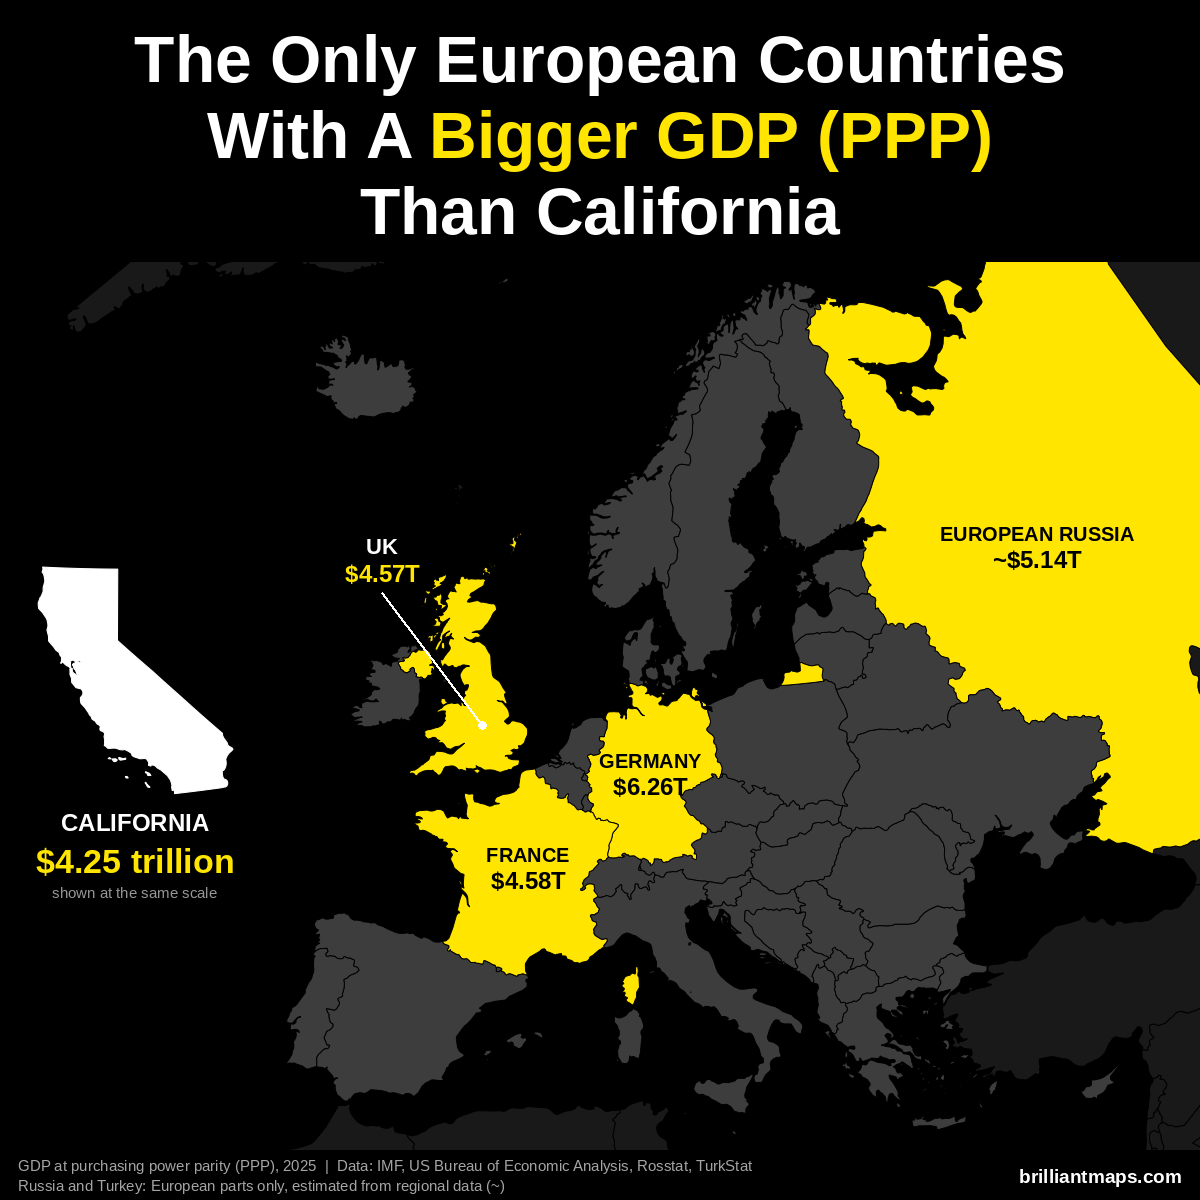
California has a GDP of $4.25 trillion (2025). US states are already measured in the dollars PPP is based on, so the figure is the same as nominal GDP. Only 4 European countries have a bigger GDP at purchasing power parity:
- Germany: $6.26 trillion
- Russia (European part): ~$5.14 trillion
- France: $4.58 trillion
- United Kingdom: $4.57 trillion
California Vs European GDP Per Capita (PPP)
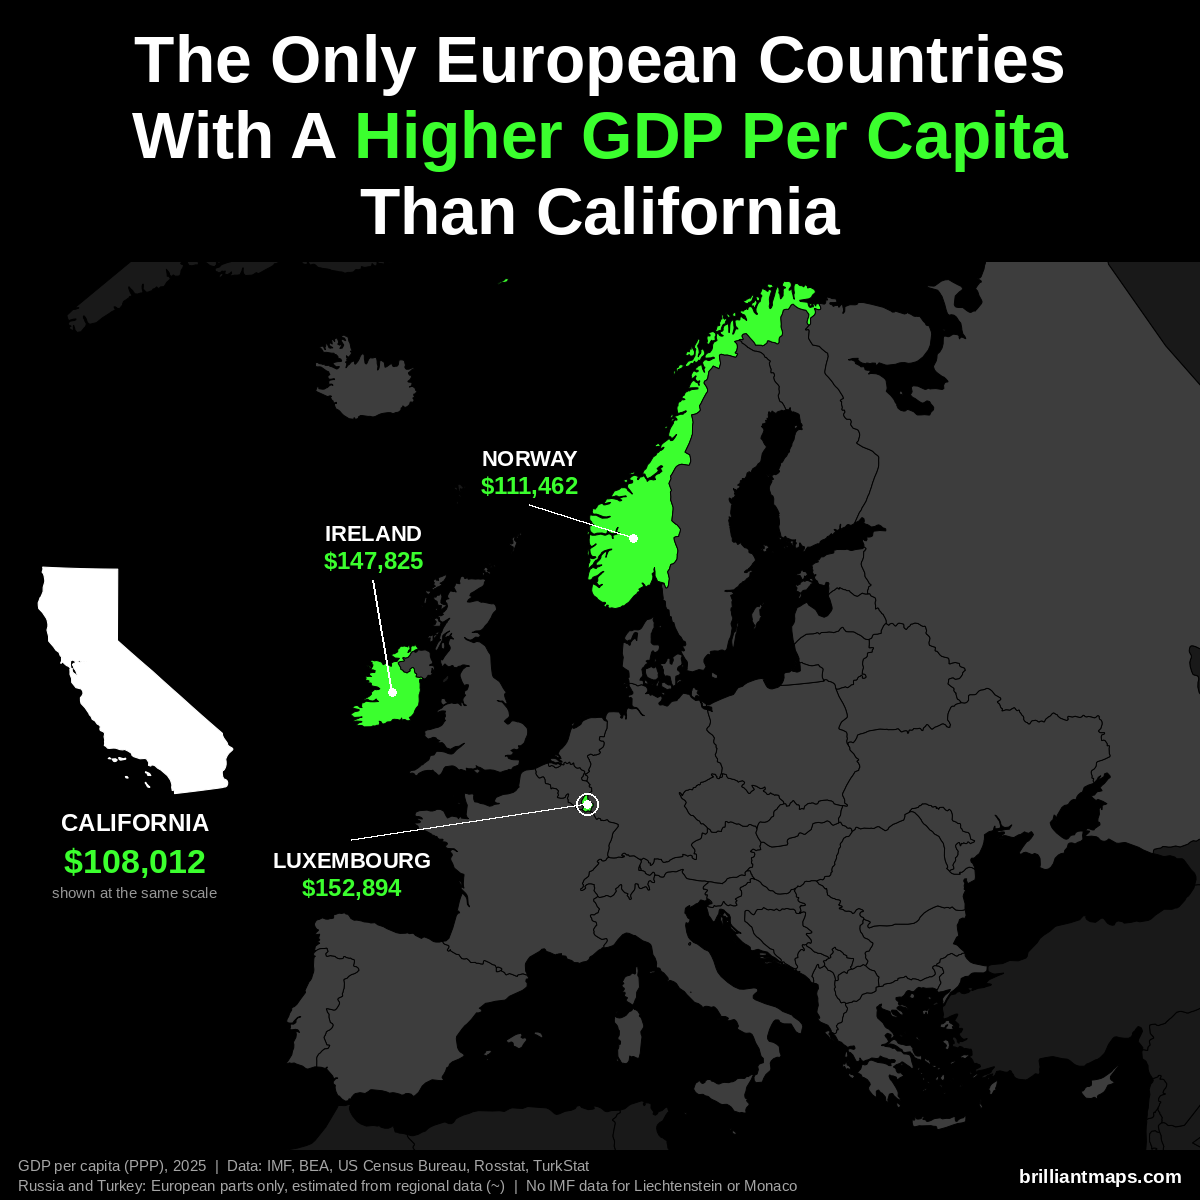
California has a GDP per capita of $108,012 (2025). Only 3 European countries have a higher GDP per capita at purchasing power parity:
- Luxembourg: $152,894
- Ireland: $147,825
- Norway: $111,462
Liechtenstein and Monaco are not covered by the IMF data and are not counted here.
California Vs European Size
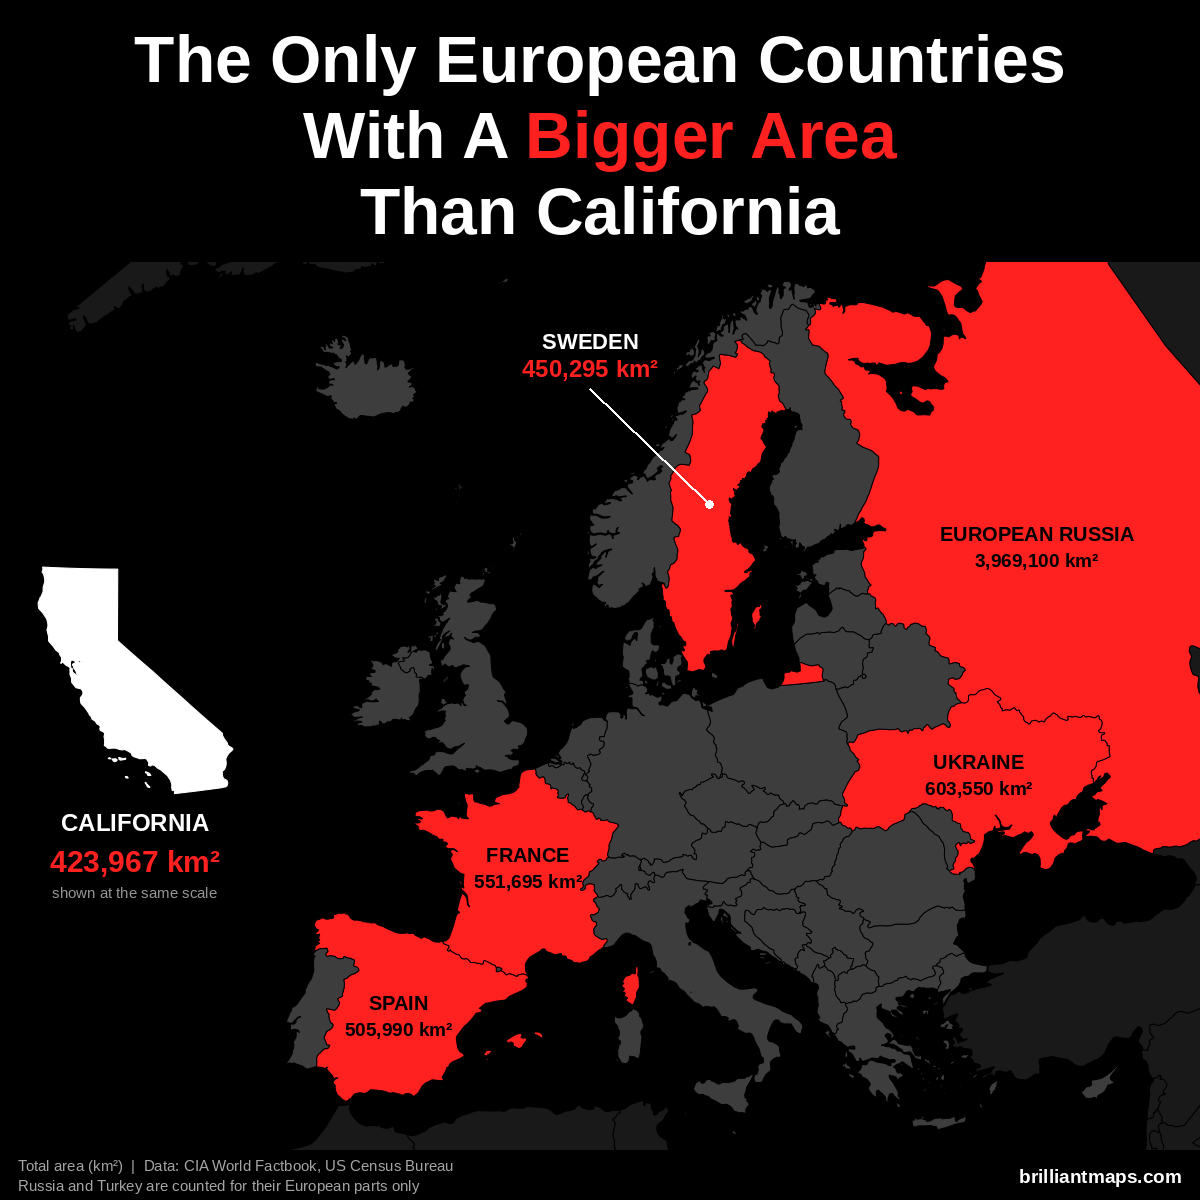
California has a total area of 423,967 km² (163,694 sq mi). Only 5 European countries have a bigger area:
- Russia (European part): 3,969,100 km² (1,532,477 sq mi)
- Ukraine: 603,550 km² (233,032 sq mi)
- France: 551,695 km² (213,010 sq mi)
- Spain: 505,990 km² (195,364 sq mi)
- Sweden: 450,295 km² (173,860 sq mi)
California Vs European Life Expectancy
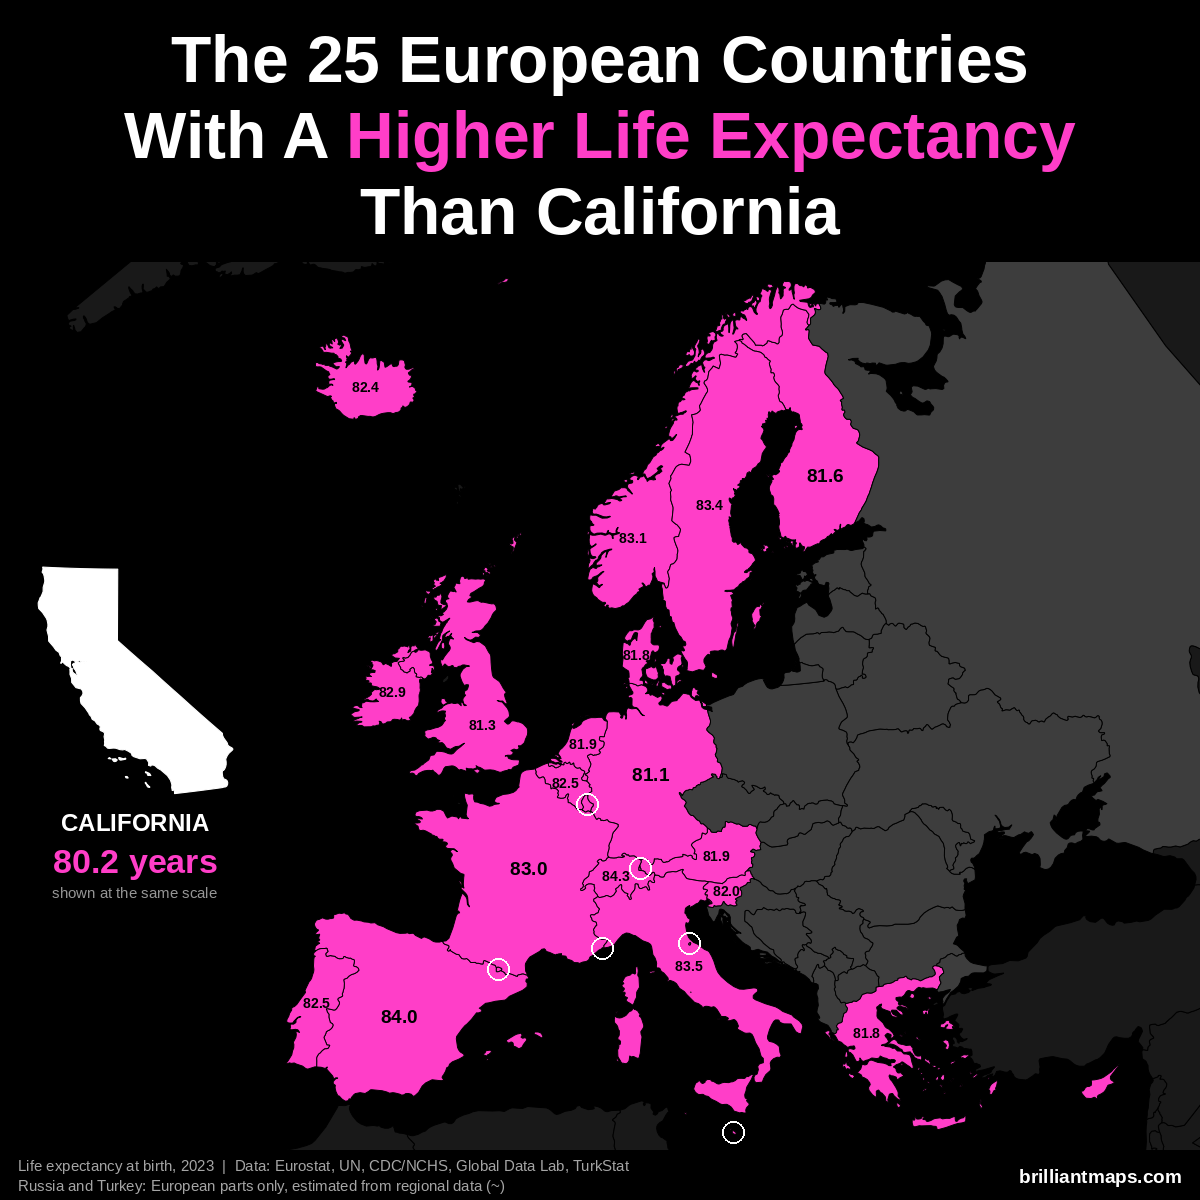
California has a life expectancy at birth of 80.2 years (2023). 25 European countries have a higher life expectancy:
- Monaco: 86.4 years
- San Marino: 85.7 years
- Liechtenstein: 84.6 years
- Switzerland: 84.3 years
- Andorra: 84.0 years
- Spain: 84.0 years
- Italy: 83.5 years
- Luxembourg: 83.4 years
- Malta: 83.4 years
- Sweden: 83.4 years
- Norway: 83.1 years
- France: 83.0 years
- Cyprus: 82.9 years
- Ireland: 82.9 years
- Belgium: 82.5 years
- Portugal: 82.5 years
- Iceland: 82.4 years
- Slovenia: 82.0 years
- Austria: 81.9 years
- Netherlands: 81.9 years
- Denmark: 81.8 years
- Greece: 81.8 years
- Finland: 81.6 years
- United Kingdom: 81.3 years
- Germany: 81.1 years
Colorado vs Europe
Colorado Vs European Population
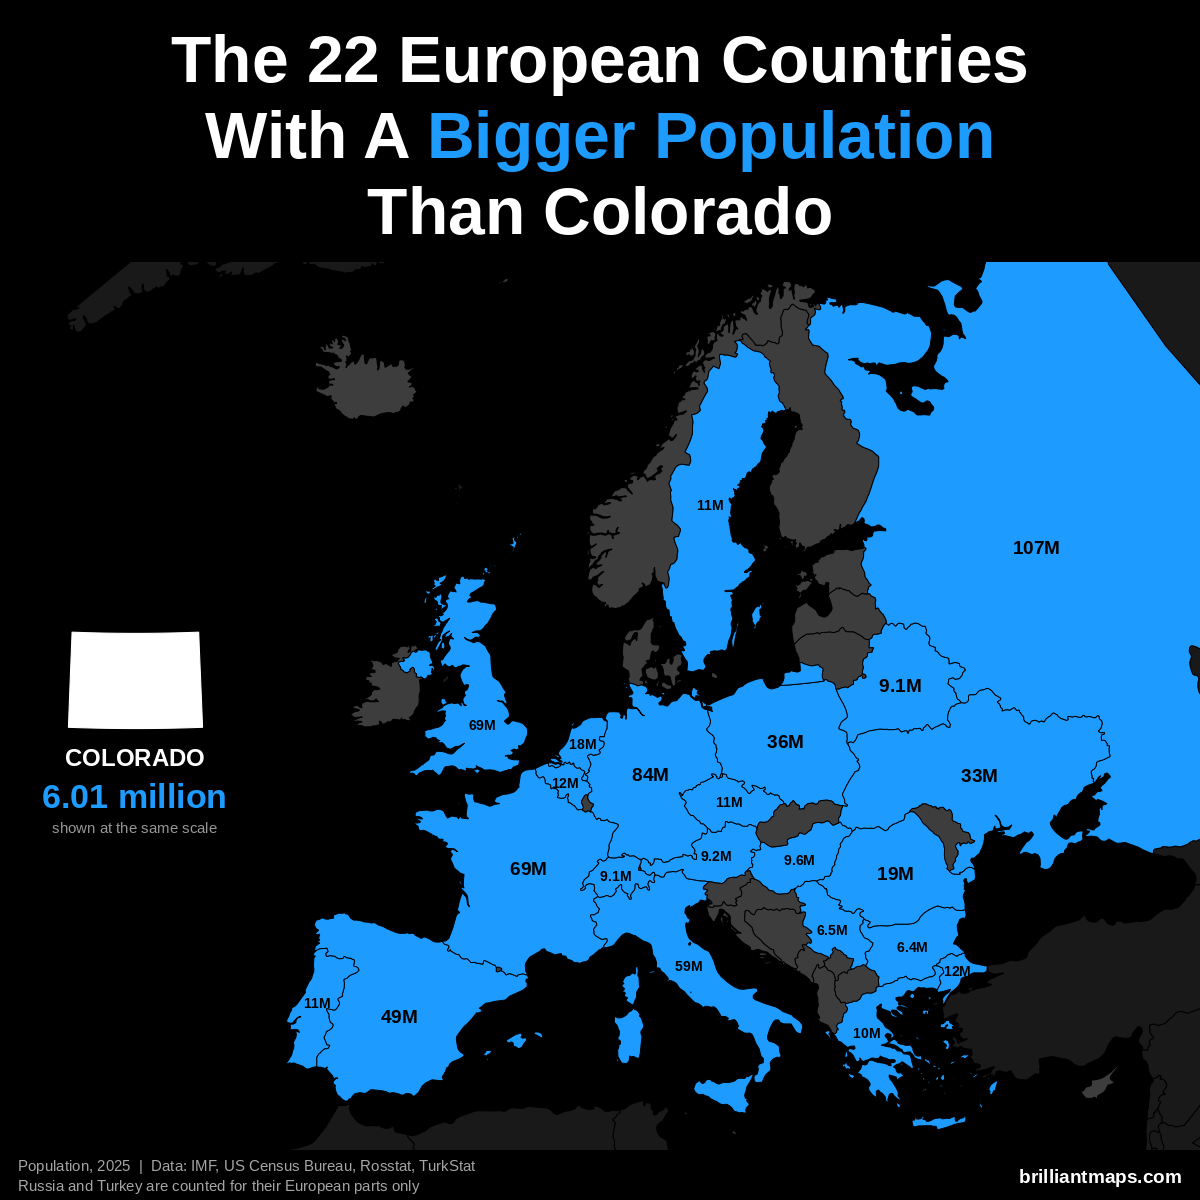
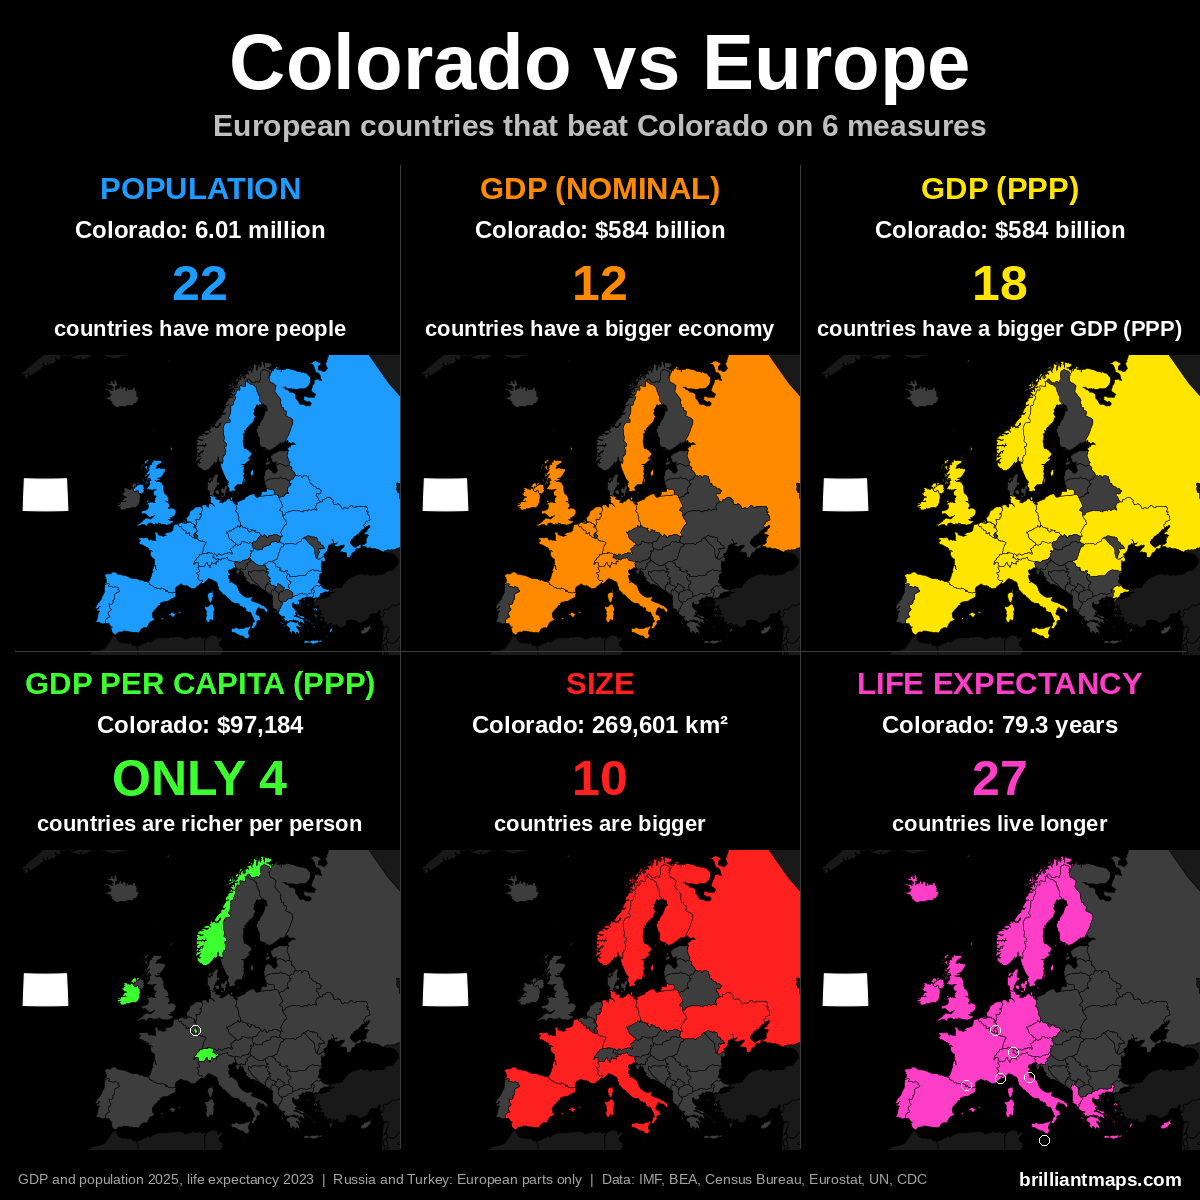
Colorado has a population of 6.0 million (2025). 22 European countries have a bigger population:
- Russia (European part): 107.0 million
- Germany: 83.5 million
- United Kingdom: 69.5 million
- France: 68.9 million
- Italy: 58.9 million
- Spain: 49.5 million
- Poland: 36.5 million
- Ukraine: 32.9 million
- Romania: 19.0 million
- Netherlands: 18.0 million
- Turkey (European part): 12.2 million
- Belgium: 11.9 million
- Portugal: 10.8 million
- Czechia: 10.8 million
- Sweden: 10.7 million
- Greece: 10.4 million
- Hungary: 9.6 million
- Austria: 9.2 million
- Belarus: 9.1 million
- Switzerland: 9.1 million
- Serbia: 6.5 million
- Bulgaria: 6.4 million
Colorado Vs European GDP (Nominal)
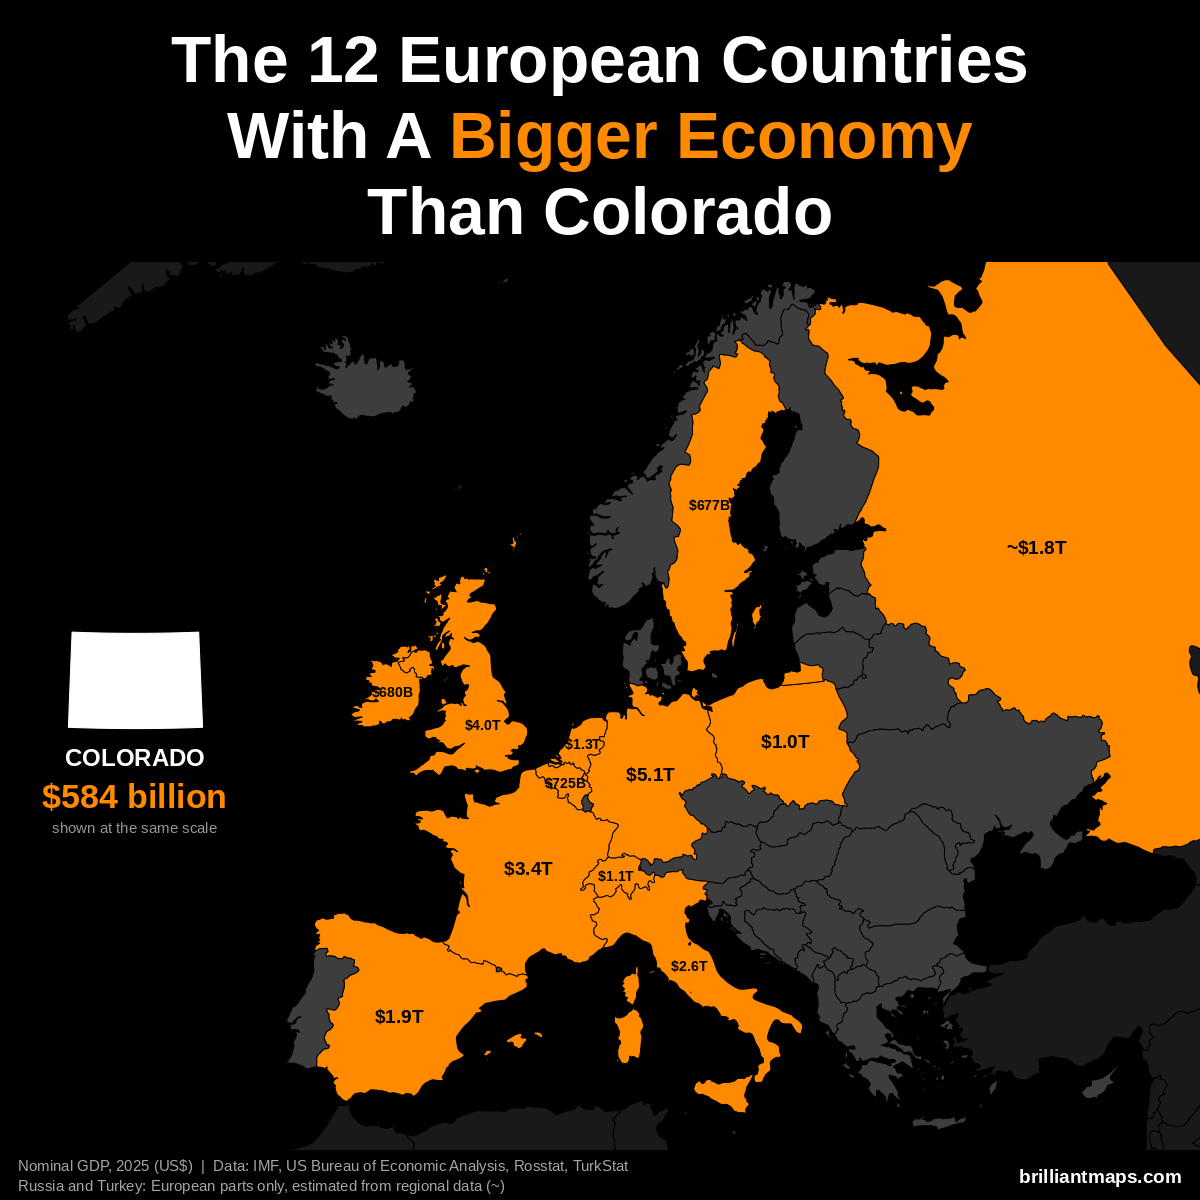
Colorado has a nominal GDP of $584 billion (2025). 12 European countries have a bigger economy:
- Germany: $5.12 trillion
- United Kingdom: $4.01 trillion
- France: $3.38 trillion
- Italy: $2.55 trillion
- Spain: $1.91 trillion
- Russia (European part): ~$1.83 trillion
- Netherlands: $1.32 trillion
- Switzerland: $1.06 trillion
- Poland: $1.04 trillion
- Belgium: $725 billion
- Ireland: $680 billion
- Sweden: $677 billion
Colorado Vs European GDP (PPP)
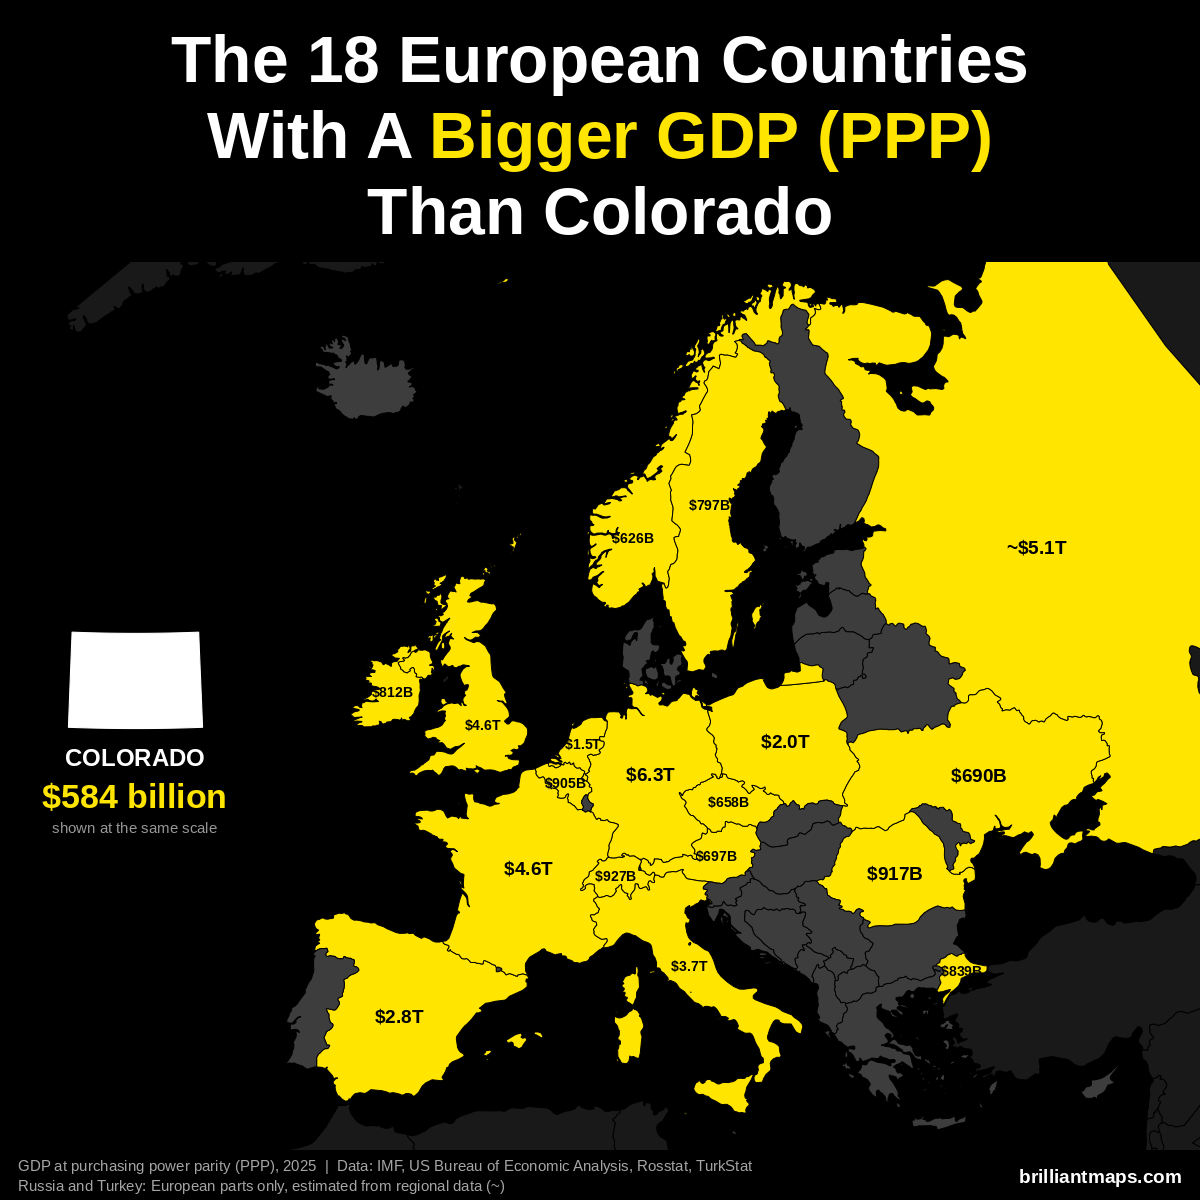
Colorado has a GDP of $584 billion (2025). US states are already measured in the dollars PPP is based on, so the figure is the same as nominal GDP. 18 European countries have a bigger GDP at purchasing power parity:
- Germany: $6.26 trillion
- Russia (European part): ~$5.14 trillion
- France: $4.58 trillion
- United Kingdom: $4.57 trillion
- Italy: $3.74 trillion
- Spain: $2.83 trillion
- Poland: $2.04 trillion
- Netherlands: $1.52 trillion
- Switzerland: $927 billion
- Romania: $917 billion
- Belgium: $905 billion
- Turkey (European part): ~$839 billion
- Ireland: $812 billion
- Sweden: $797 billion
- Austria: $697 billion
- Ukraine: $690 billion
- Czechia: $658 billion
- Norway: $626 billion
Colorado Vs European GDP Per Capita (PPP)
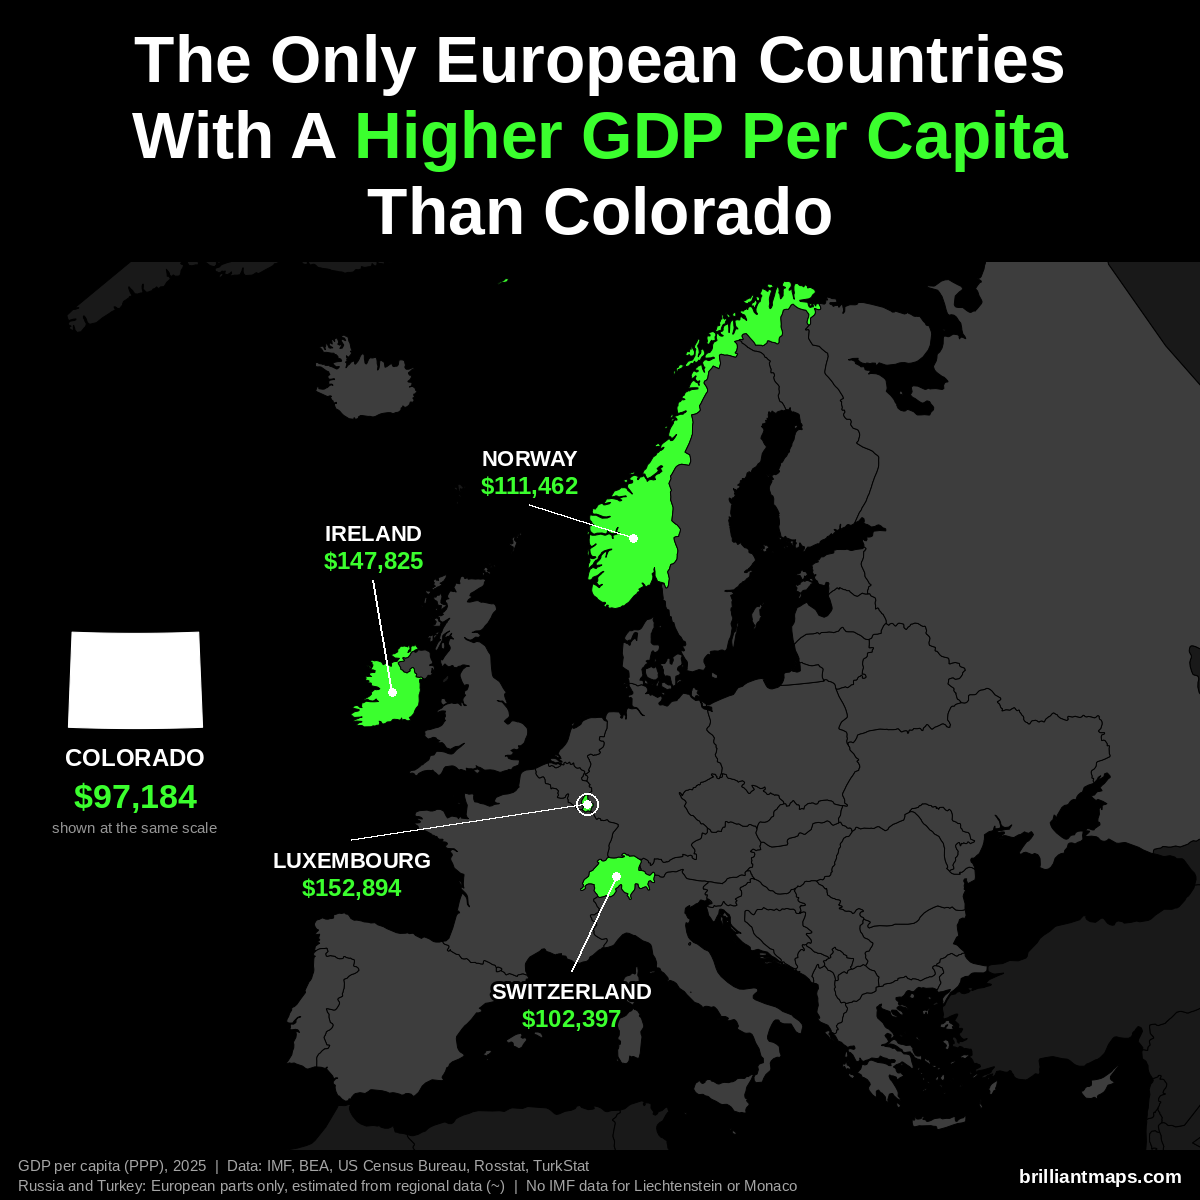
Colorado has a GDP per capita of $97,184 (2025). Only 4 European countries have a higher GDP per capita at purchasing power parity:
- Luxembourg: $152,894
- Ireland: $147,825
- Norway: $111,462
- Switzerland: $102,397
Liechtenstein and Monaco are not covered by the IMF data and are not counted here.
Colorado Vs European Size
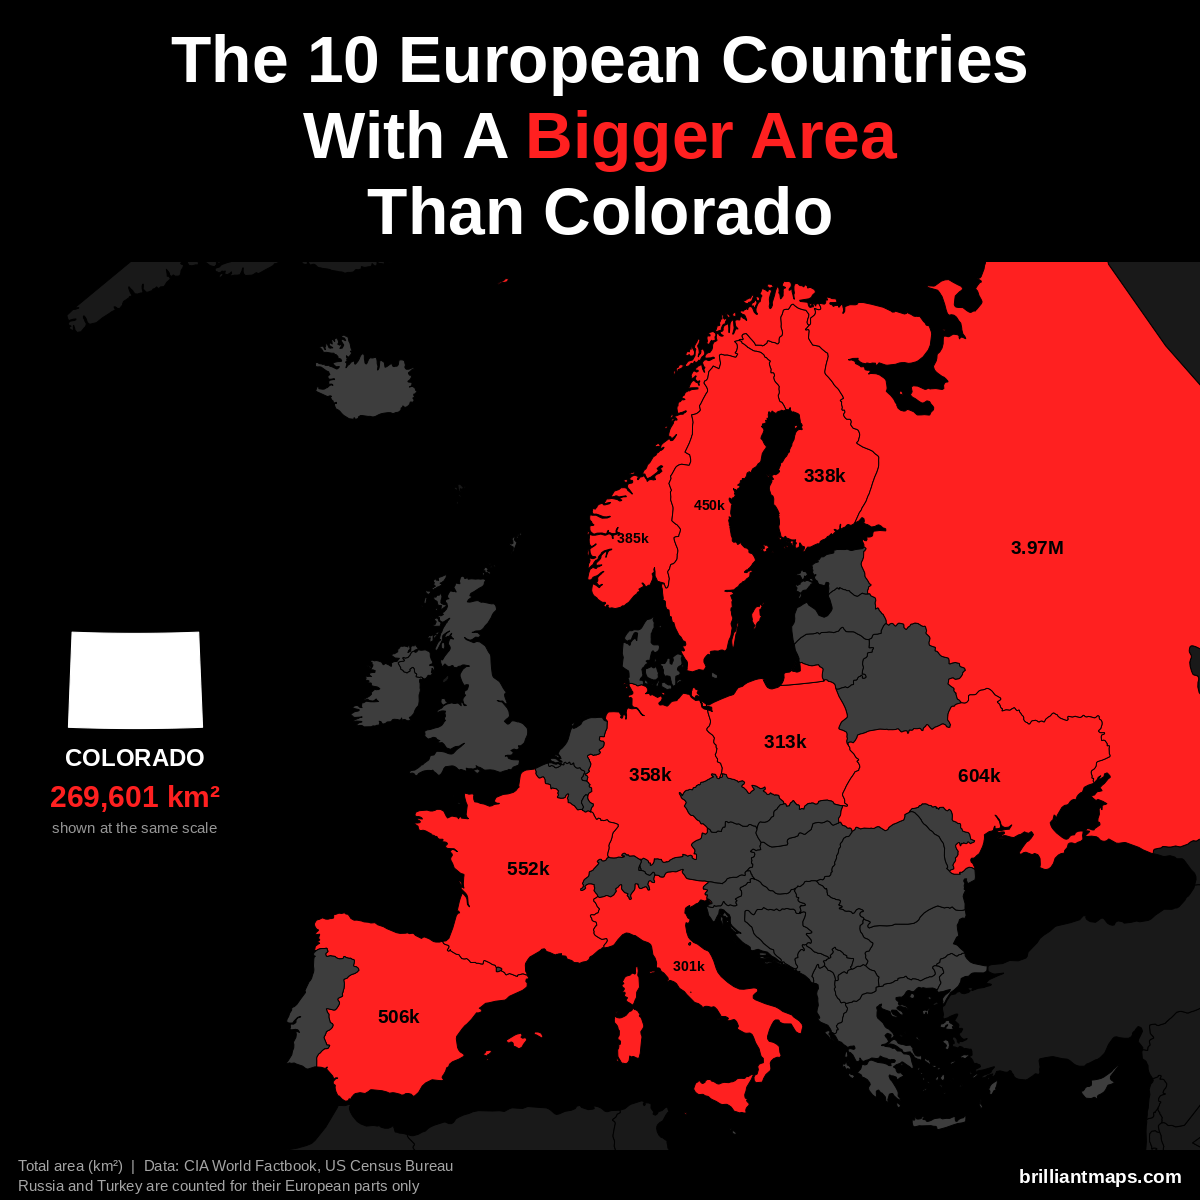
Colorado has a total area of 269,601 km² (104,093 sq mi). 10 European countries have a bigger area:
- Russia (European part): 3,969,100 km² (1,532,477 sq mi)
- Ukraine: 603,550 km² (233,032 sq mi)
- France: 551,695 km² (213,010 sq mi)
- Spain: 505,990 km² (195,364 sq mi)
- Sweden: 450,295 km² (173,860 sq mi)
- Norway: 385,207 km² (148,729 sq mi)
- Germany: 357,588 km² (138,065 sq mi)
- Finland: 338,455 km² (130,678 sq mi)
- Poland: 312,696 km² (120,733 sq mi)
- Italy: 301,340 km² (116,348 sq mi)
Colorado Vs European Life Expectancy
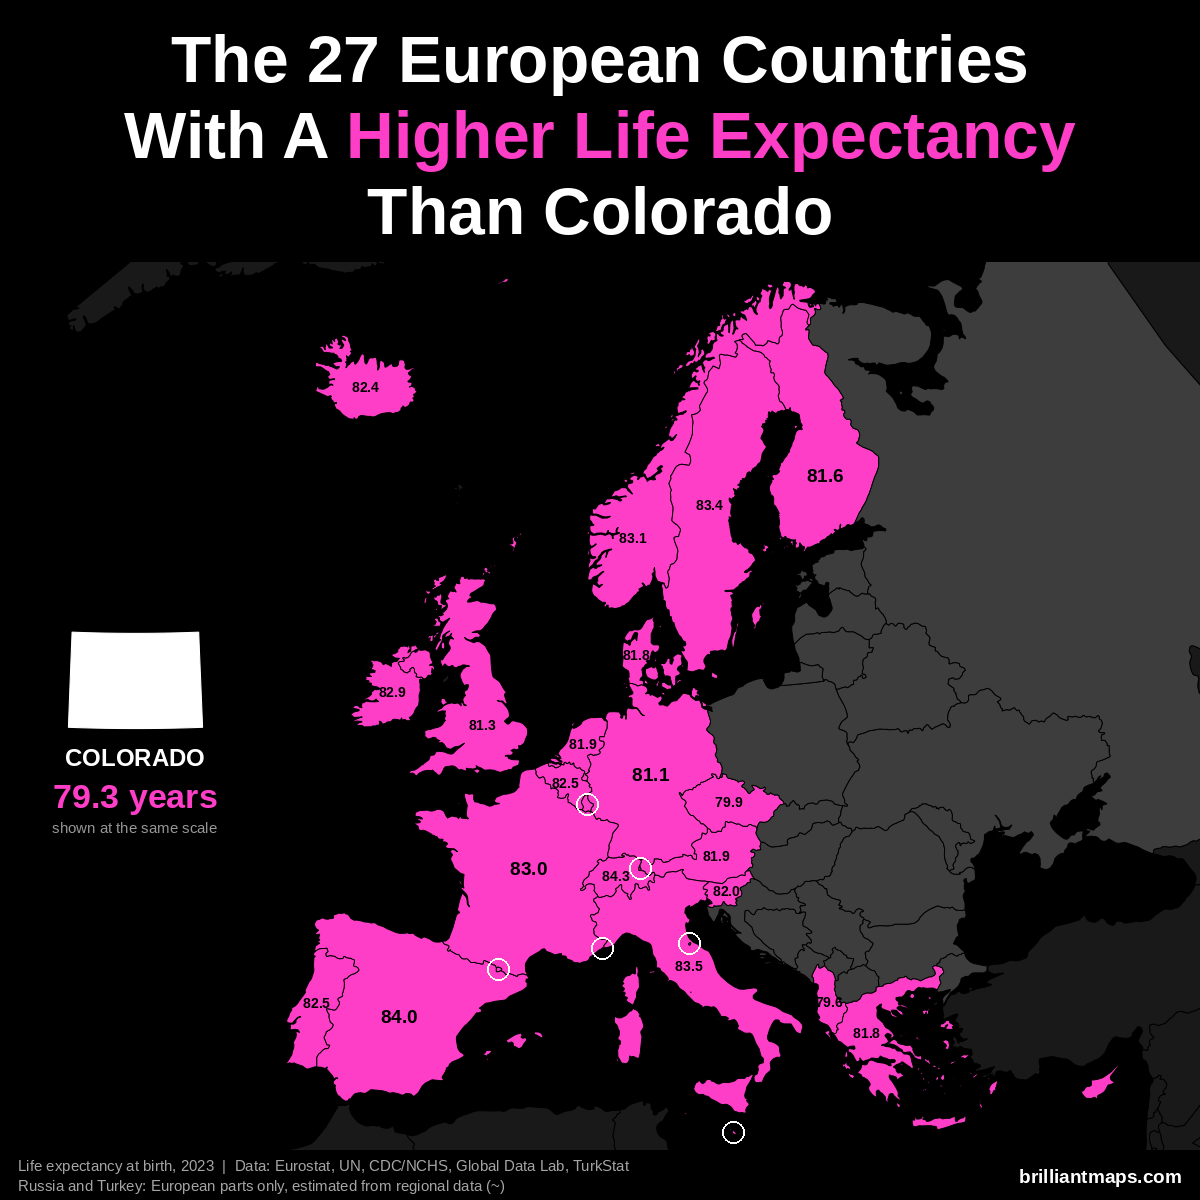
Colorado has a life expectancy at birth of 79.3 years (2023). 27 European countries have a higher life expectancy:
- Monaco: 86.4 years
- San Marino: 85.7 years
- Liechtenstein: 84.6 years
- Switzerland: 84.3 years
- Andorra: 84.0 years
- Spain: 84.0 years
- Italy: 83.5 years
- Luxembourg: 83.4 years
- Malta: 83.4 years
- Sweden: 83.4 years
- Norway: 83.1 years
- France: 83.0 years
- Cyprus: 82.9 years
- Ireland: 82.9 years
- Belgium: 82.5 years
- Portugal: 82.5 years
- Iceland: 82.4 years
- Slovenia: 82.0 years
- Austria: 81.9 years
- Netherlands: 81.9 years
- Denmark: 81.8 years
- Greece: 81.8 years
- Finland: 81.6 years
- United Kingdom: 81.3 years
- Germany: 81.1 years
- Czechia: 79.9 years
- Albania: 79.6 years
Connecticut vs Europe
Connecticut Vs European Population
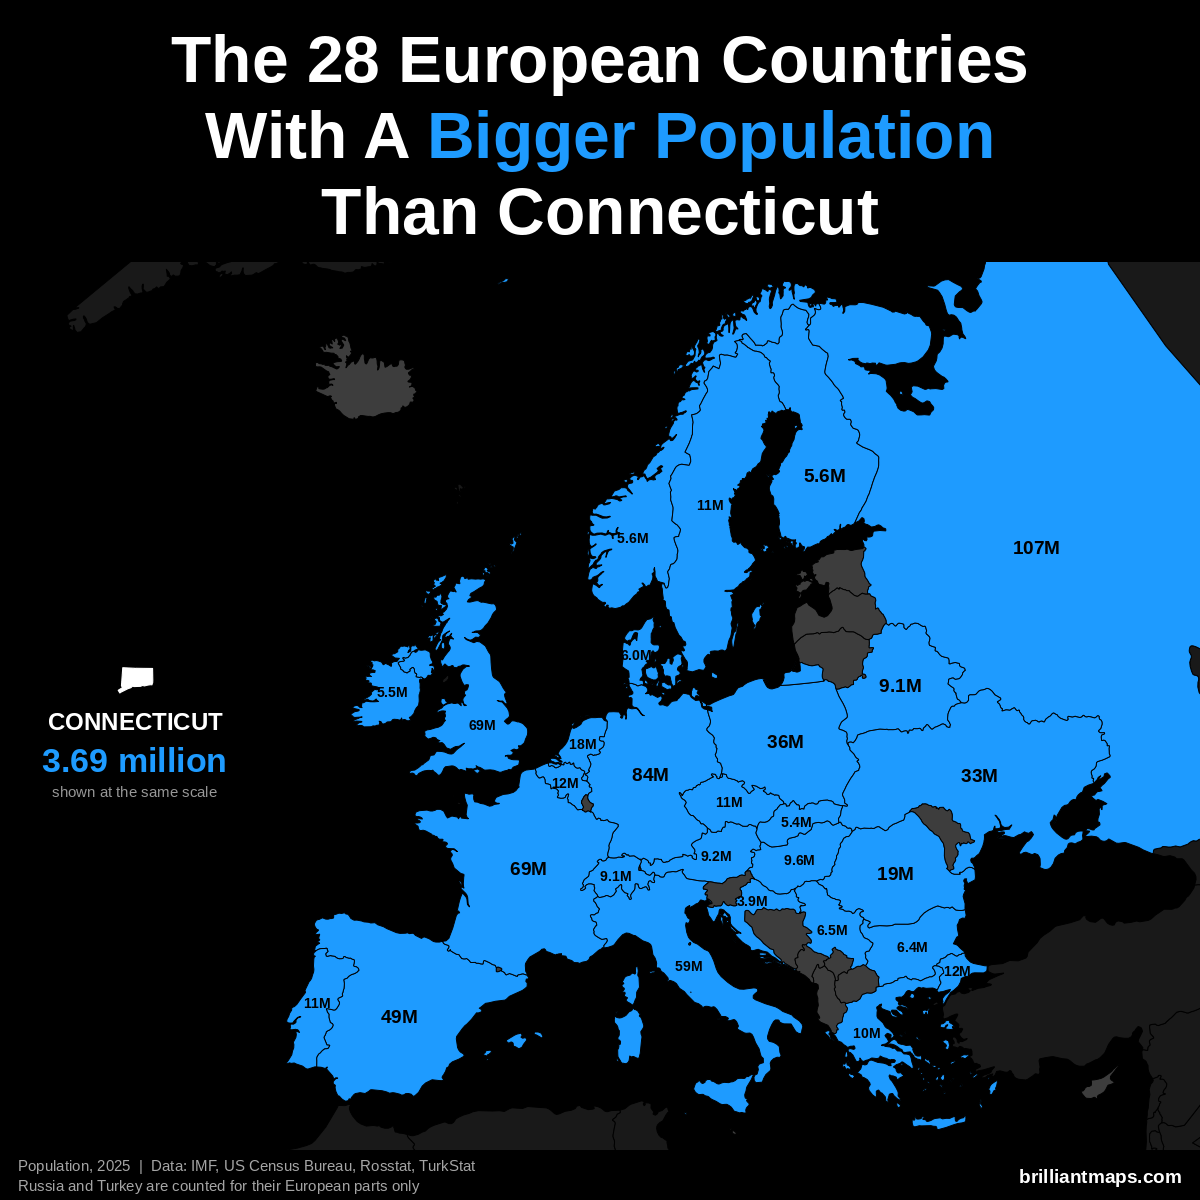
Connecticut has a population of 3.7 million (2025). 28 European countries have a bigger population:
- Russia (European part): 107.0 million
- Germany: 83.5 million
- United Kingdom: 69.5 million
- France: 68.9 million
- Italy: 58.9 million
- Spain: 49.5 million
- Poland: 36.5 million
- Ukraine: 32.9 million
- Romania: 19.0 million
- Netherlands: 18.0 million
- Turkey (European part): 12.2 million
- Belgium: 11.9 million
- Portugal: 10.8 million
- Czechia: 10.8 million
- Sweden: 10.7 million
- Greece: 10.4 million
- Hungary: 9.6 million
- Austria: 9.2 million
- Belarus: 9.1 million
- Switzerland: 9.1 million
- Serbia: 6.5 million
- Bulgaria: 6.4 million
- Denmark: 6.0 million
- Norway: 5.6 million
- Finland: 5.6 million
- Ireland: 5.5 million
- Slovakia: 5.4 million
- Croatia: 3.9 million
Connecticut Vs European GDP (Nominal)
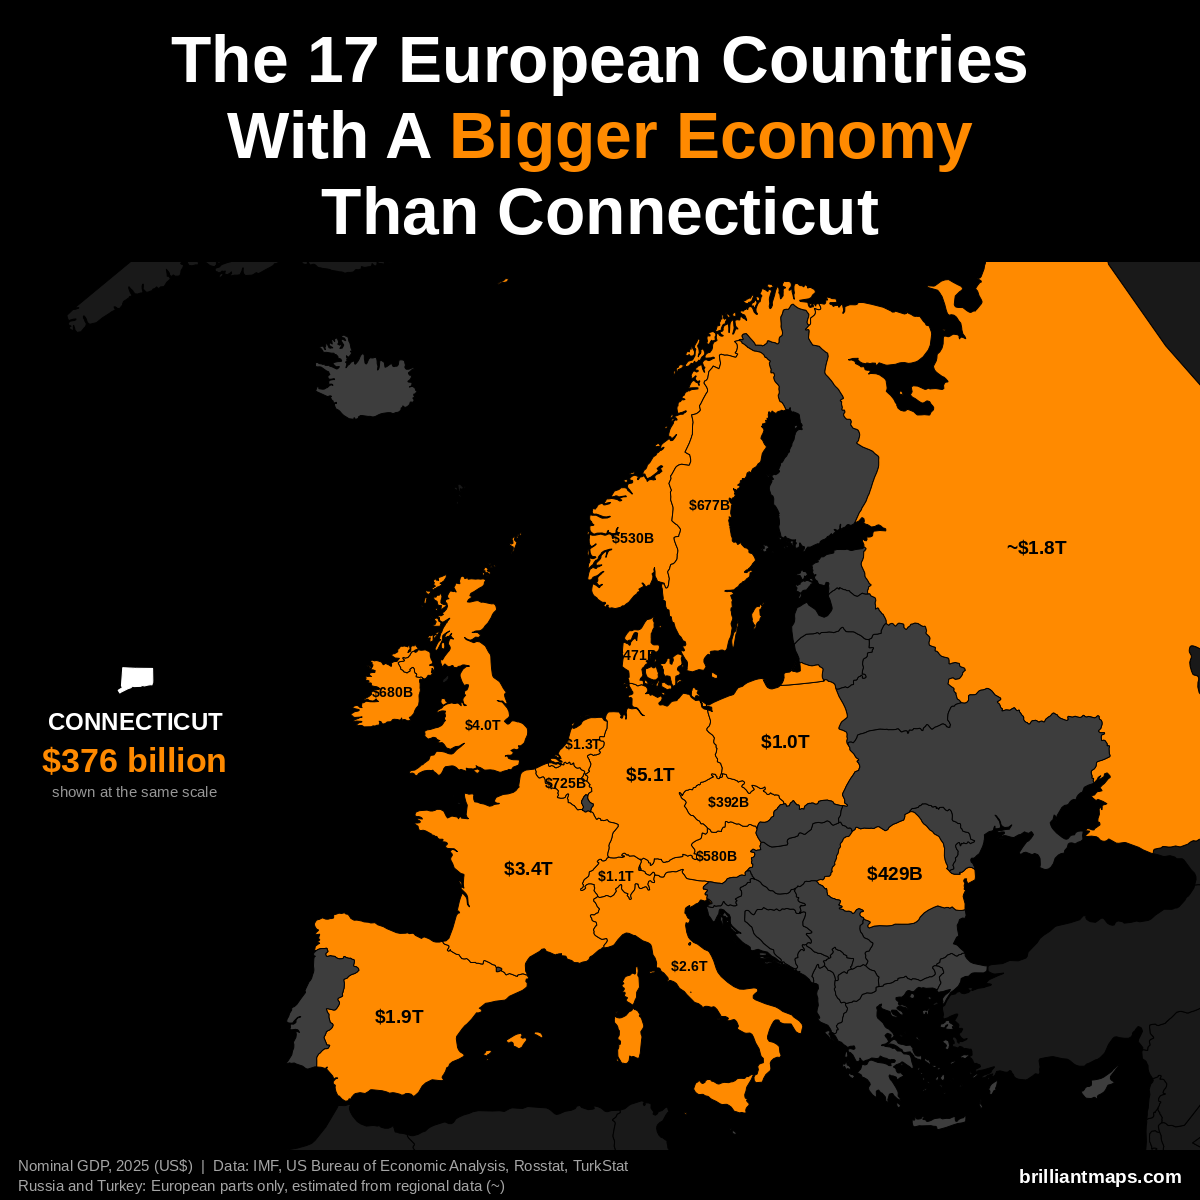
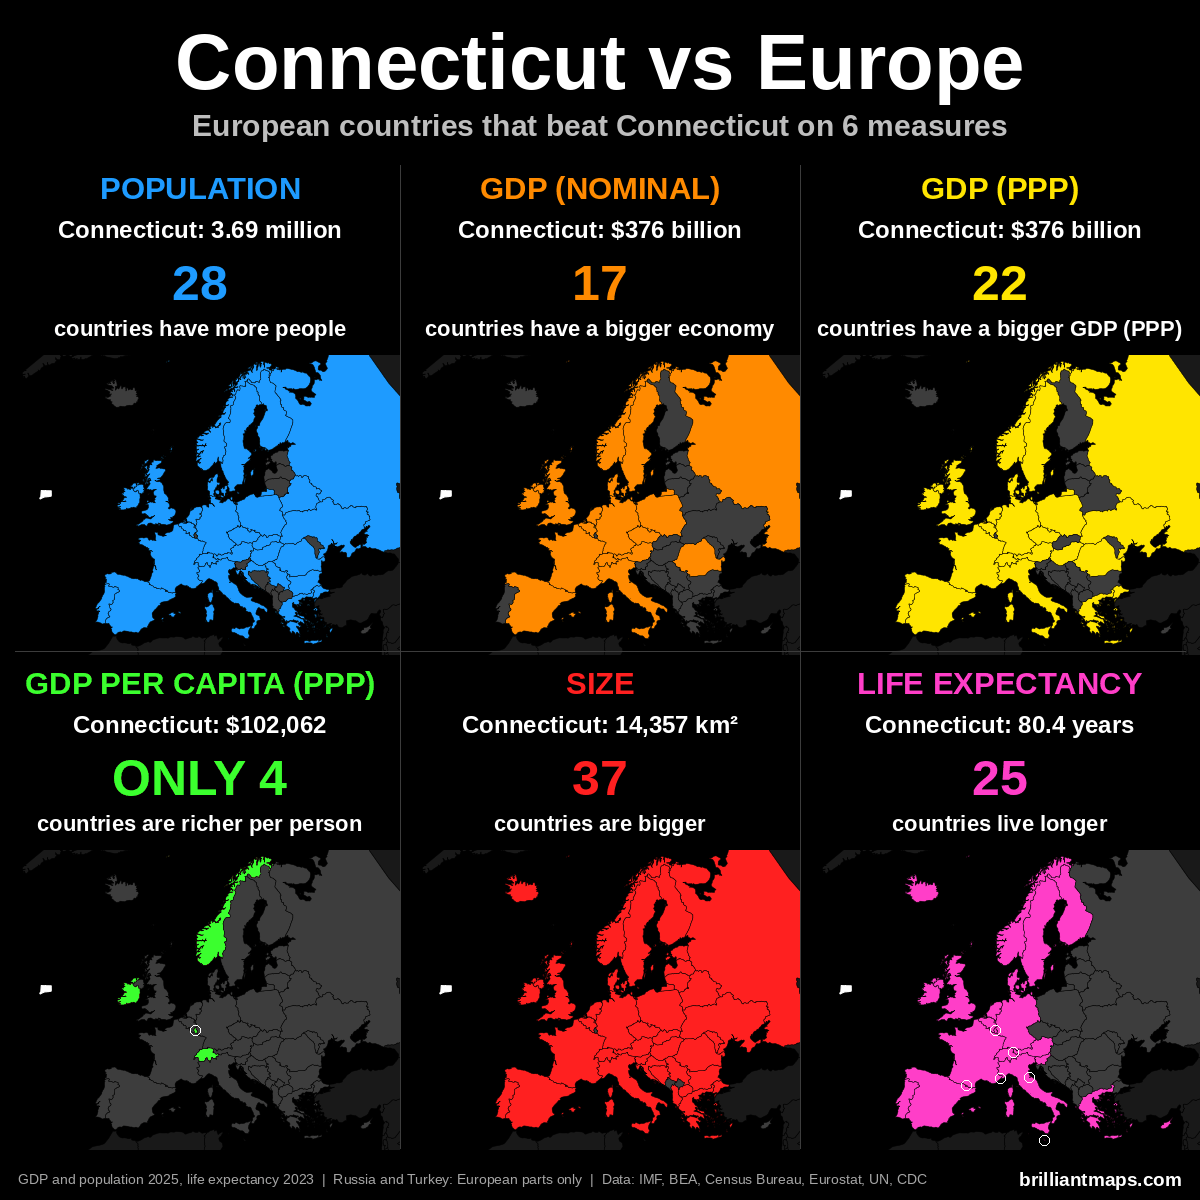
Connecticut has a nominal GDP of $376 billion (2025). 17 European countries have a bigger economy:
- Germany: $5.12 trillion
- United Kingdom: $4.01 trillion
- France: $3.38 trillion
- Italy: $2.55 trillion
- Spain: $1.91 trillion
- Russia (European part): ~$1.83 trillion
- Netherlands: $1.32 trillion
- Switzerland: $1.06 trillion
- Poland: $1.04 trillion
- Belgium: $725 billion
- Ireland: $680 billion
- Sweden: $677 billion
- Austria: $580 billion
- Norway: $530 billion
- Denmark: $471 billion
- Romania: $429 billion
- Czechia: $392 billion
Connecticut Vs European GDP (PPP)
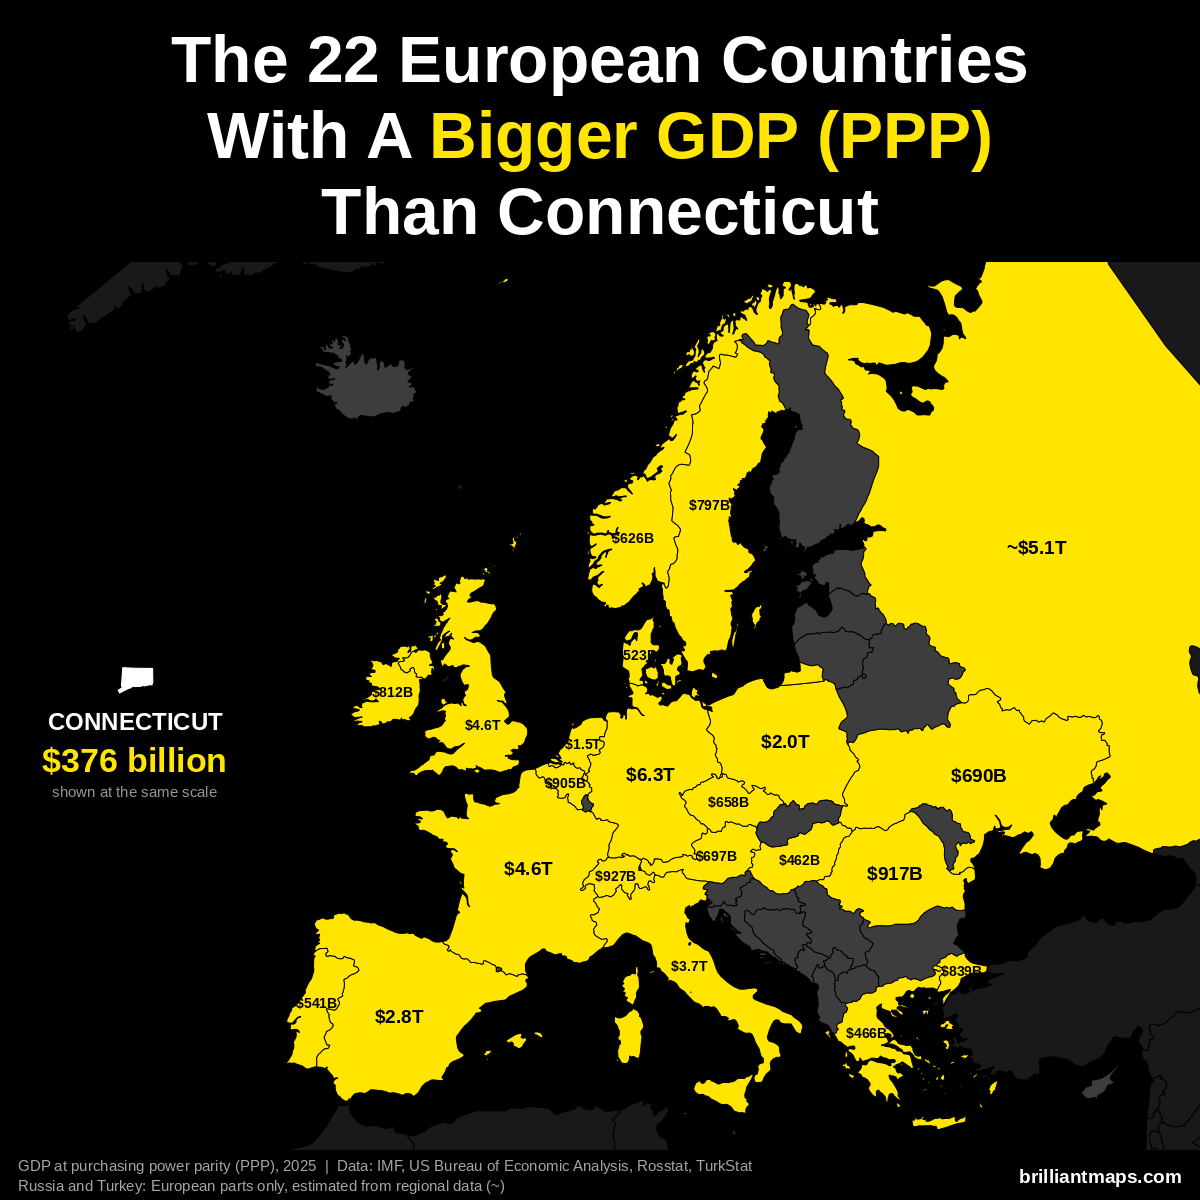
Connecticut has a GDP of $376 billion (2025). US states are already measured in the dollars PPP is based on, so the figure is the same as nominal GDP. 22 European countries have a bigger GDP at purchasing power parity:
- Germany: $6.26 trillion
- Russia (European part): ~$5.14 trillion
- France: $4.58 trillion
- United Kingdom: $4.57 trillion
- Italy: $3.74 trillion
- Spain: $2.83 trillion
- Poland: $2.04 trillion
- Netherlands: $1.52 trillion
- Switzerland: $927 billion
- Romania: $917 billion
- Belgium: $905 billion
- Turkey (European part): ~$839 billion
- Ireland: $812 billion
- Sweden: $797 billion
- Austria: $697 billion
- Ukraine: $690 billion
- Czechia: $658 billion
- Norway: $626 billion
- Portugal: $541 billion
- Denmark: $523 billion
- Greece: $466 billion
- Hungary: $462 billion
Connecticut Vs European GDP Per Capita (PPP)
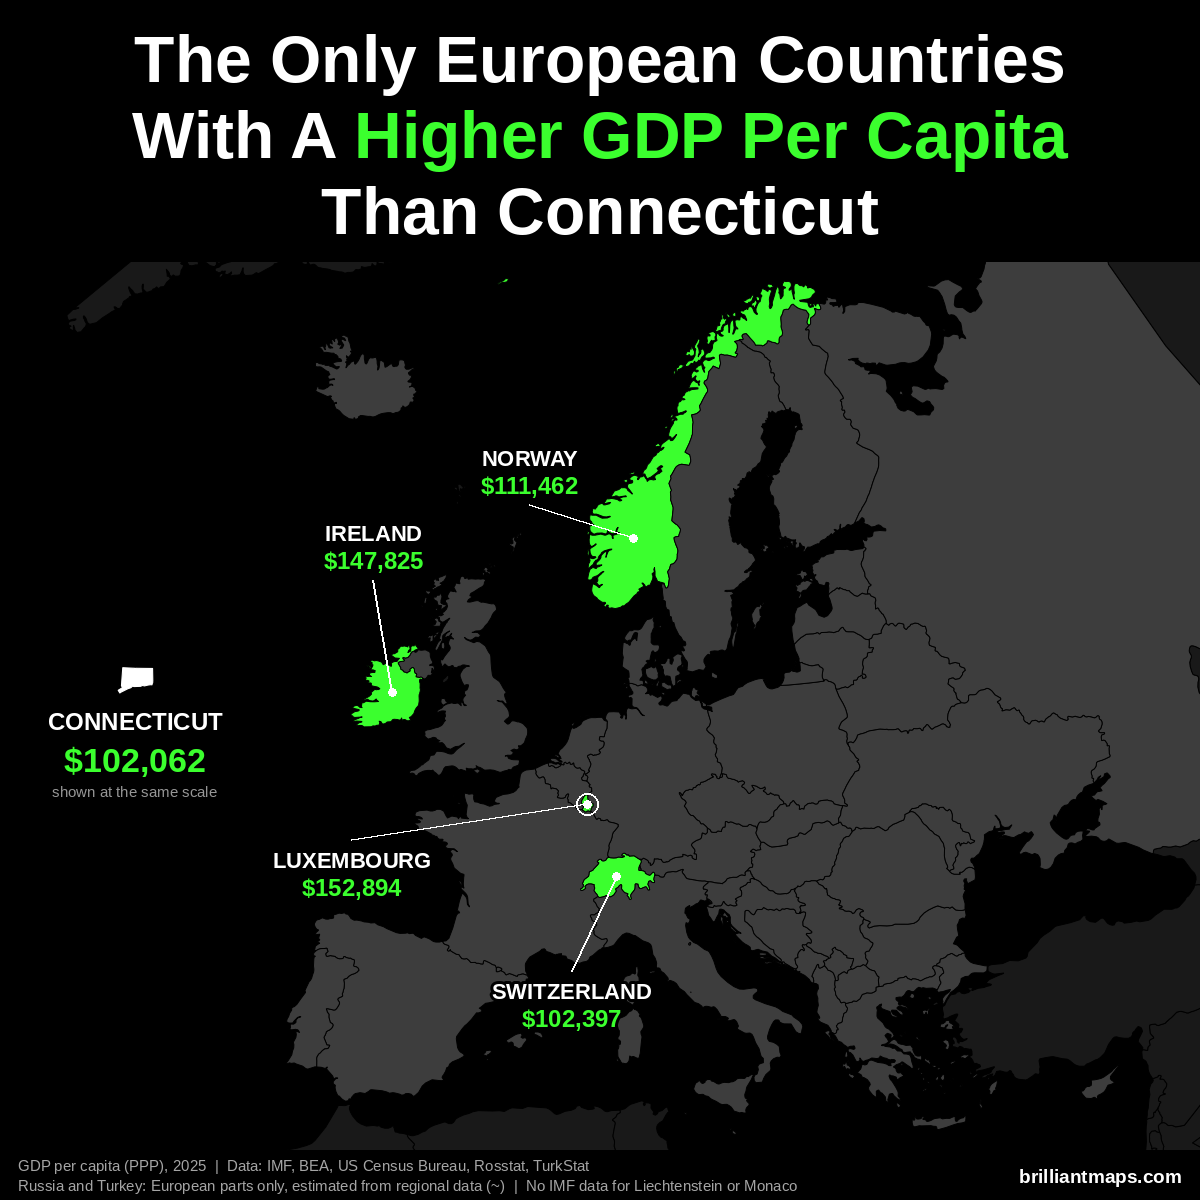
Connecticut has a GDP per capita of $102,062 (2025). Only 4 European countries have a higher GDP per capita at purchasing power parity:
- Luxembourg: $152,894
- Ireland: $147,825
- Norway: $111,462
- Switzerland: $102,397
Liechtenstein and Monaco are not covered by the IMF data and are not counted here.
Connecticut Vs European Size
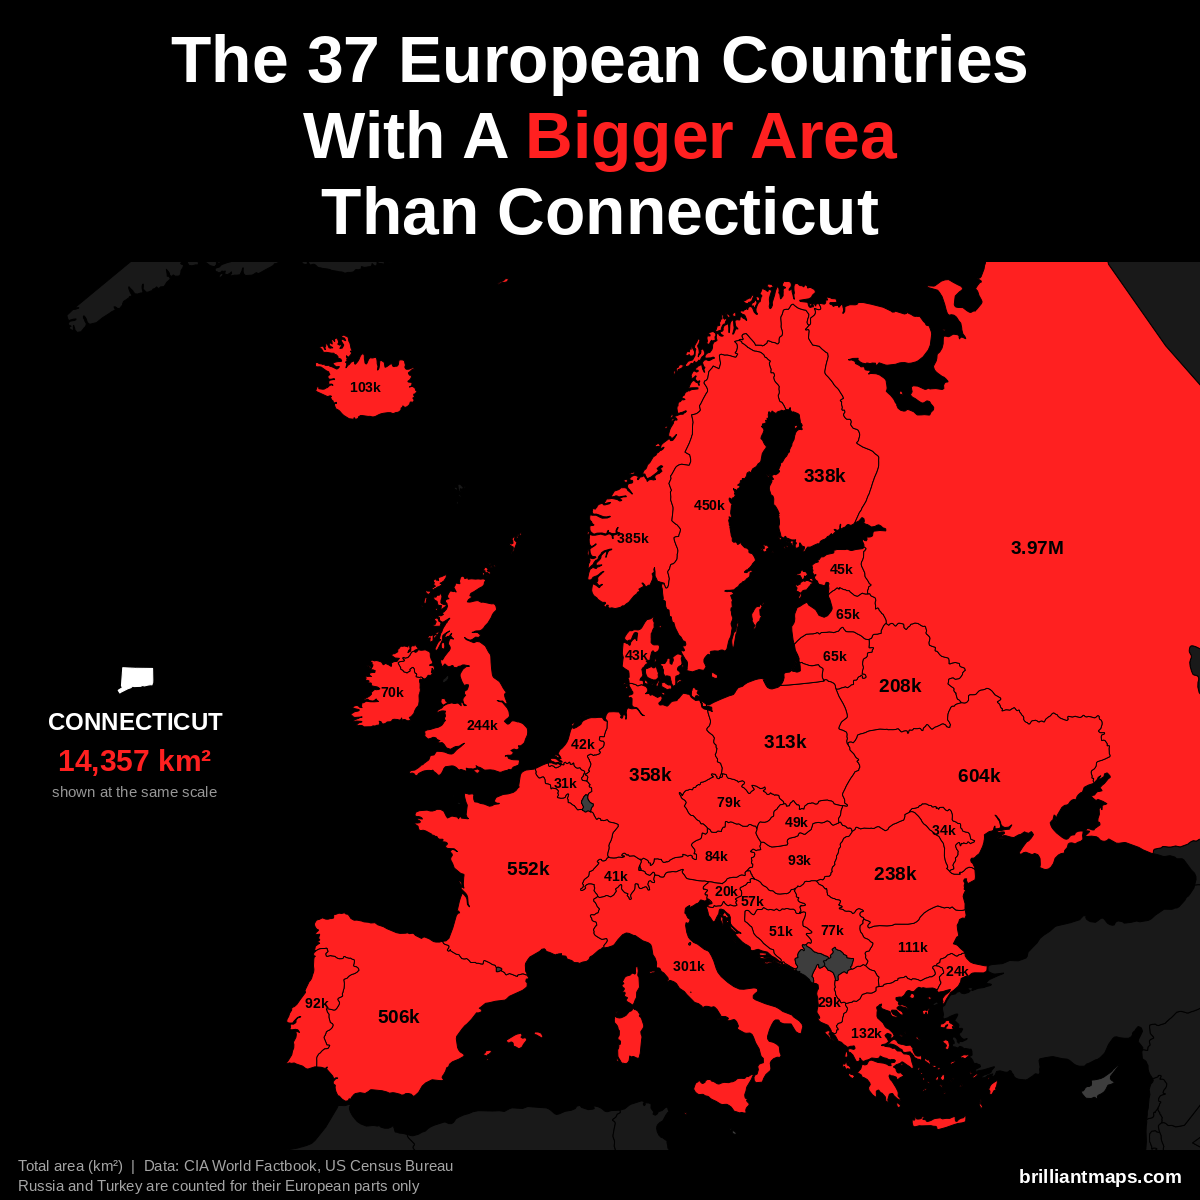
Connecticut has a total area of 14,357 km² (5,543 sq mi). 37 European countries have a bigger area:
- Russia (European part): 3,969,100 km² (1,532,477 sq mi)
- Ukraine: 603,550 km² (233,032 sq mi)
- France: 551,695 km² (213,010 sq mi)
- Spain: 505,990 km² (195,364 sq mi)
- Sweden: 450,295 km² (173,860 sq mi)
- Norway: 385,207 km² (148,729 sq mi)
- Germany: 357,588 km² (138,065 sq mi)
- Finland: 338,455 km² (130,678 sq mi)
- Poland: 312,696 km² (120,733 sq mi)
- Italy: 301,340 km² (116,348 sq mi)
- United Kingdom: 243,610 km² (94,058 sq mi)
- Romania: 238,397 km² (92,046 sq mi)
- Belarus: 207,600 km² (80,155 sq mi)
- Greece: 131,957 km² (50,949 sq mi)
- Bulgaria: 110,994 km² (42,855 sq mi)
- Iceland: 103,000 km² (39,768 sq mi)
- Hungary: 93,028 km² (35,918 sq mi)
- Portugal: 92,212 km² (35,603 sq mi)
- Austria: 83,871 km² (32,383 sq mi)
- Czechia: 78,867 km² (30,451 sq mi)
- Serbia: 77,474 km² (29,913 sq mi)
- Ireland: 70,273 km² (27,133 sq mi)
- Lithuania: 65,300 km² (25,212 sq mi)
- Latvia: 64,589 km² (24,938 sq mi)
- Croatia: 56,594 km² (21,851 sq mi)
- Bosnia and Herzegovina: 51,197 km² (19,767 sq mi)
- Slovakia: 49,035 km² (18,933 sq mi)
- Estonia: 45,339 km² (17,505 sq mi)
- Denmark: 43,094 km² (16,639 sq mi)
- Netherlands: 41,850 km² (16,158 sq mi)
- Switzerland: 41,285 km² (15,940 sq mi)
- Moldova: 33,846 km² (13,068 sq mi)
- Belgium: 30,528 km² (11,787 sq mi)
- Albania: 28,748 km² (11,100 sq mi)
- North Macedonia: 25,713 km² (9,928 sq mi)
- Turkey (European part): 23,764 km² (9,175 sq mi)
- Slovenia: 20,273 km² (7,827 sq mi)
Connecticut Vs European Life Expectancy
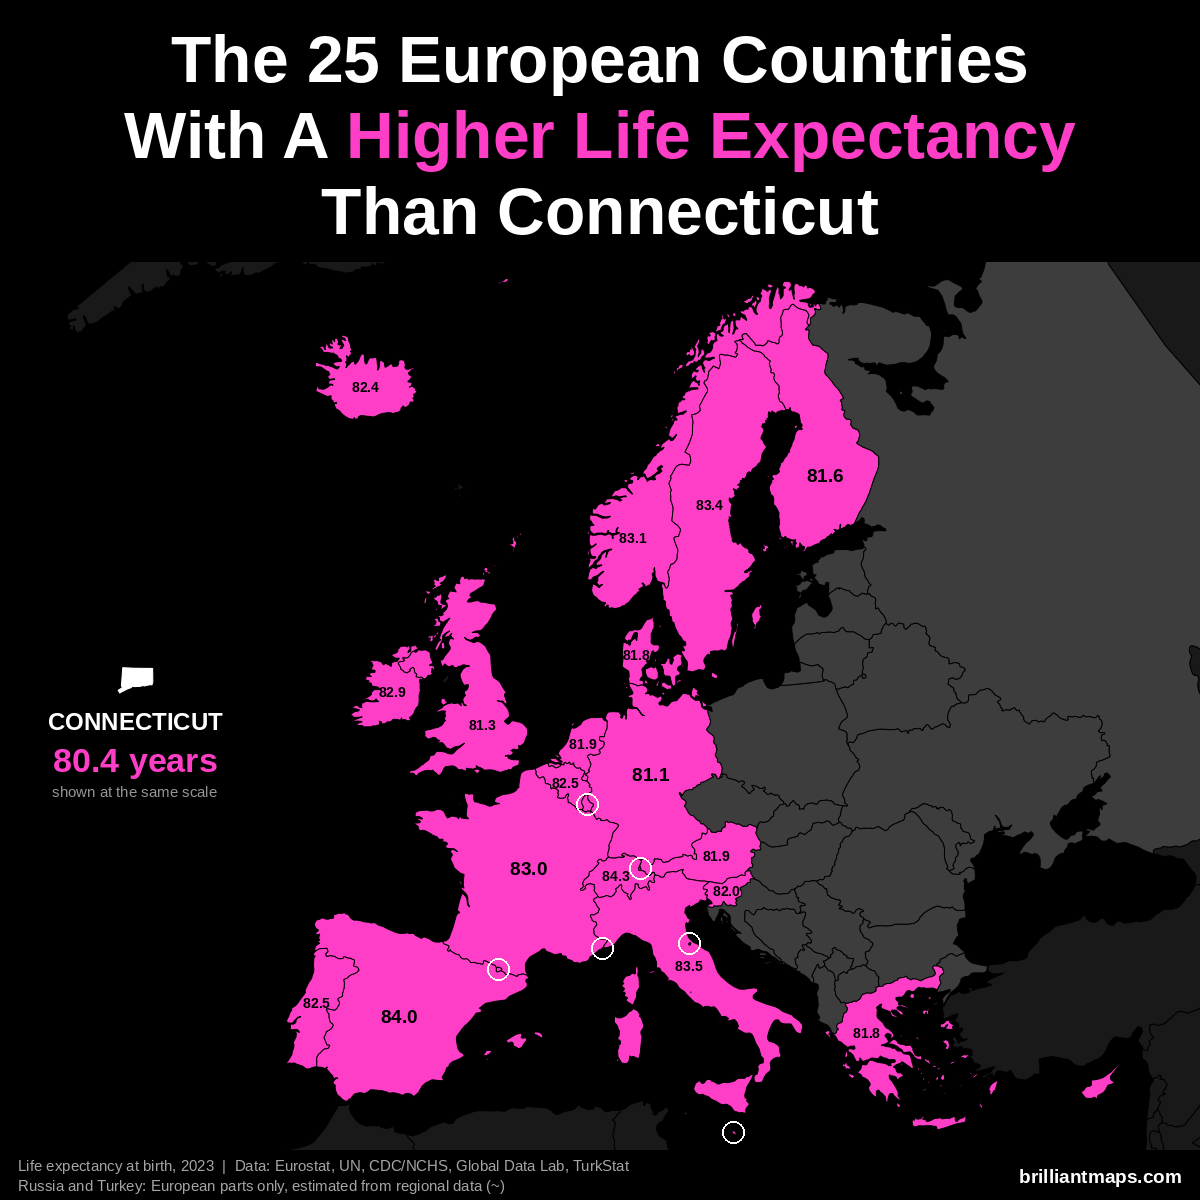
Connecticut has a life expectancy at birth of 80.4 years (2023). 25 European countries have a higher life expectancy:
- Monaco: 86.4 years
- San Marino: 85.7 years
- Liechtenstein: 84.6 years
- Switzerland: 84.3 years
- Andorra: 84.0 years
- Spain: 84.0 years
- Italy: 83.5 years
- Luxembourg: 83.4 years
- Malta: 83.4 years
- Sweden: 83.4 years
- Norway: 83.1 years
- France: 83.0 years
- Cyprus: 82.9 years
- Ireland: 82.9 years
- Belgium: 82.5 years
- Portugal: 82.5 years
- Iceland: 82.4 years
- Slovenia: 82.0 years
- Austria: 81.9 years
- Netherlands: 81.9 years
- Denmark: 81.8 years
- Greece: 81.8 years
- Finland: 81.6 years
- United Kingdom: 81.3 years
- Germany: 81.1 years
Delaware vs Europe
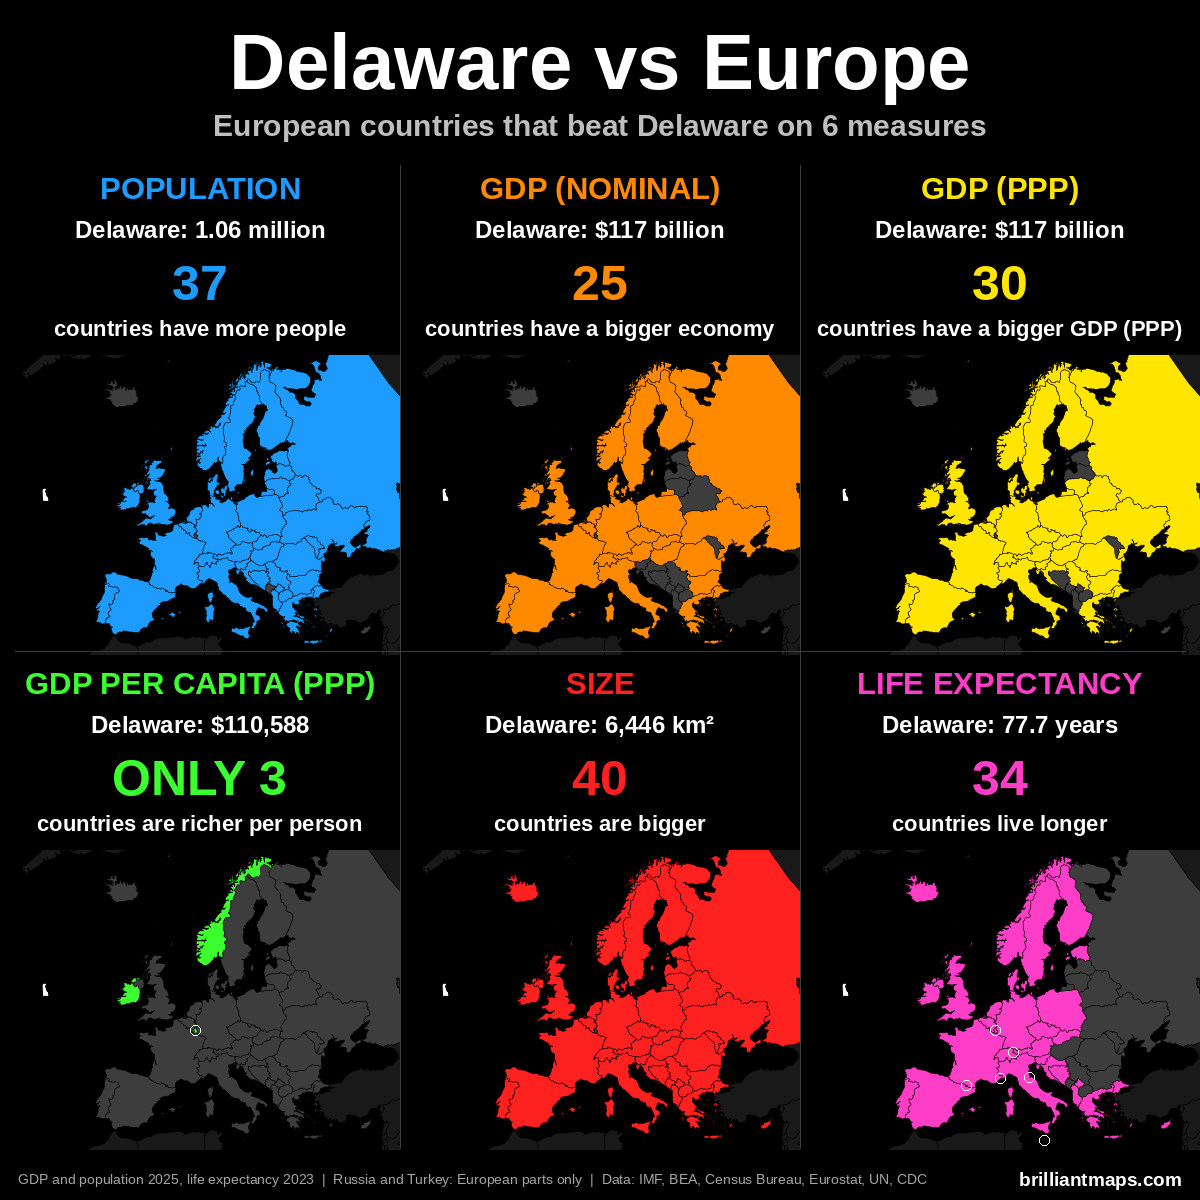
Delaware Vs European Population
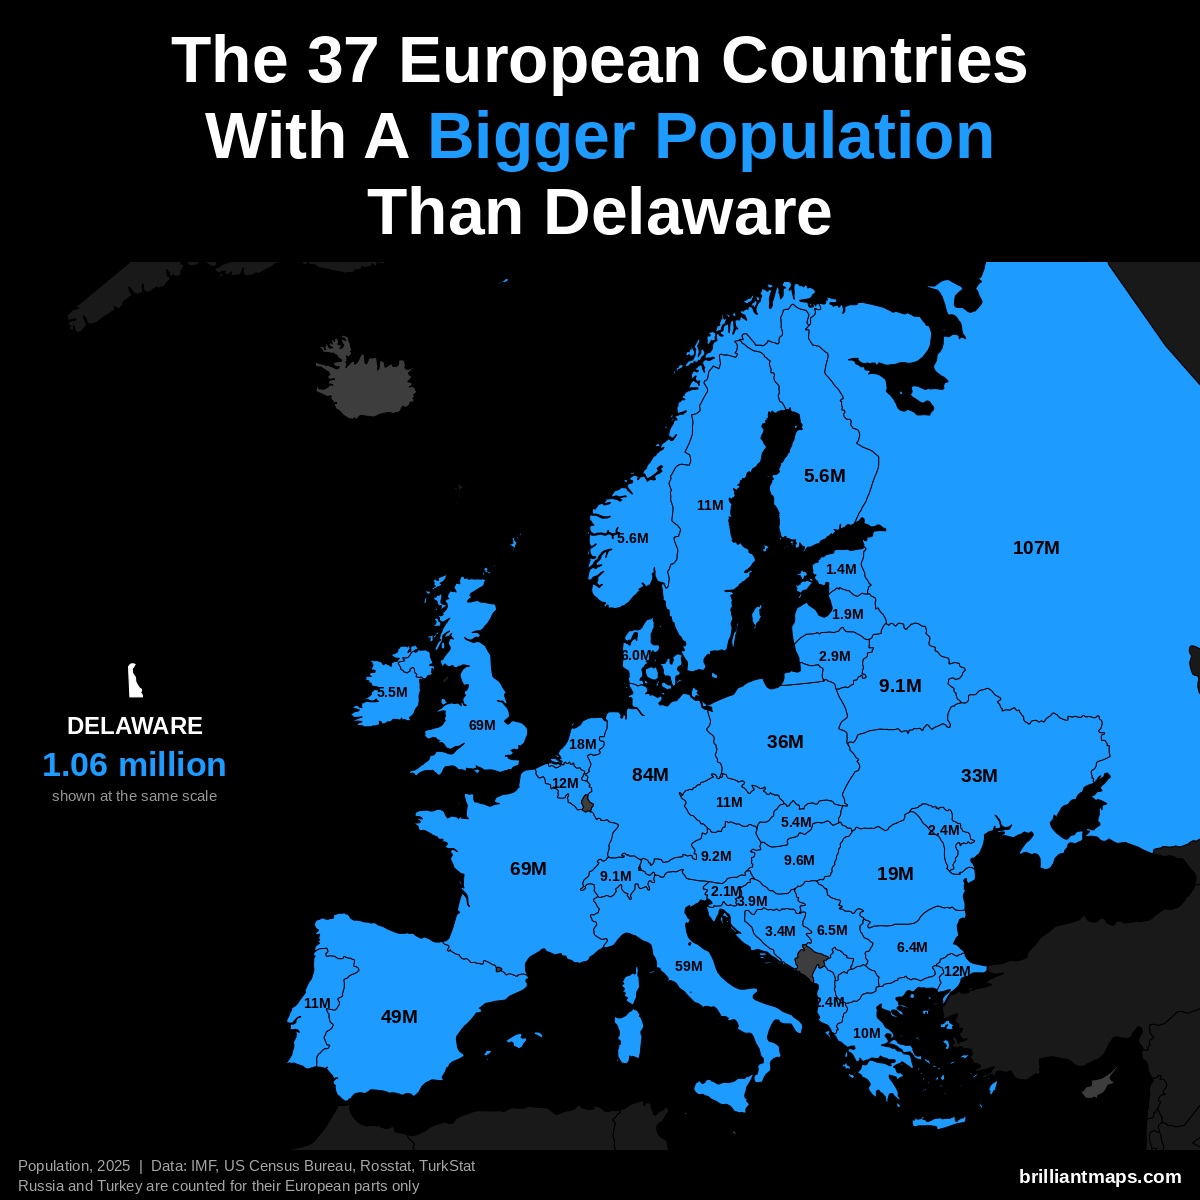
Delaware has a population of 1.1 million (2025). 37 European countries have a bigger population:
- Russia (European part): 107.0 million
- Germany: 83.5 million
- United Kingdom: 69.5 million
- France: 68.9 million
- Italy: 58.9 million
- Spain: 49.5 million
- Poland: 36.5 million
- Ukraine: 32.9 million
- Romania: 19.0 million
- Netherlands: 18.0 million
- Turkey (European part): 12.2 million
- Belgium: 11.9 million
- Portugal: 10.8 million
- Czechia: 10.8 million
- Sweden: 10.7 million
- Greece: 10.4 million
- Hungary: 9.6 million
- Austria: 9.2 million
- Belarus: 9.1 million
- Switzerland: 9.1 million
- Serbia: 6.5 million
- Bulgaria: 6.4 million
- Denmark: 6.0 million
- Norway: 5.6 million
- Finland: 5.6 million
- Ireland: 5.5 million
- Slovakia: 5.4 million
- Croatia: 3.9 million
- Bosnia and Herzegovina: 3.4 million
- Lithuania: 2.9 million
- Moldova: 2.4 million
- Albania: 2.4 million
- Slovenia: 2.1 million
- Latvia: 1.9 million
- North Macedonia: 1.8 million
- Kosovo: 1.6 million
- Estonia: 1.4 million
Delaware Vs European GDP (Nominal)
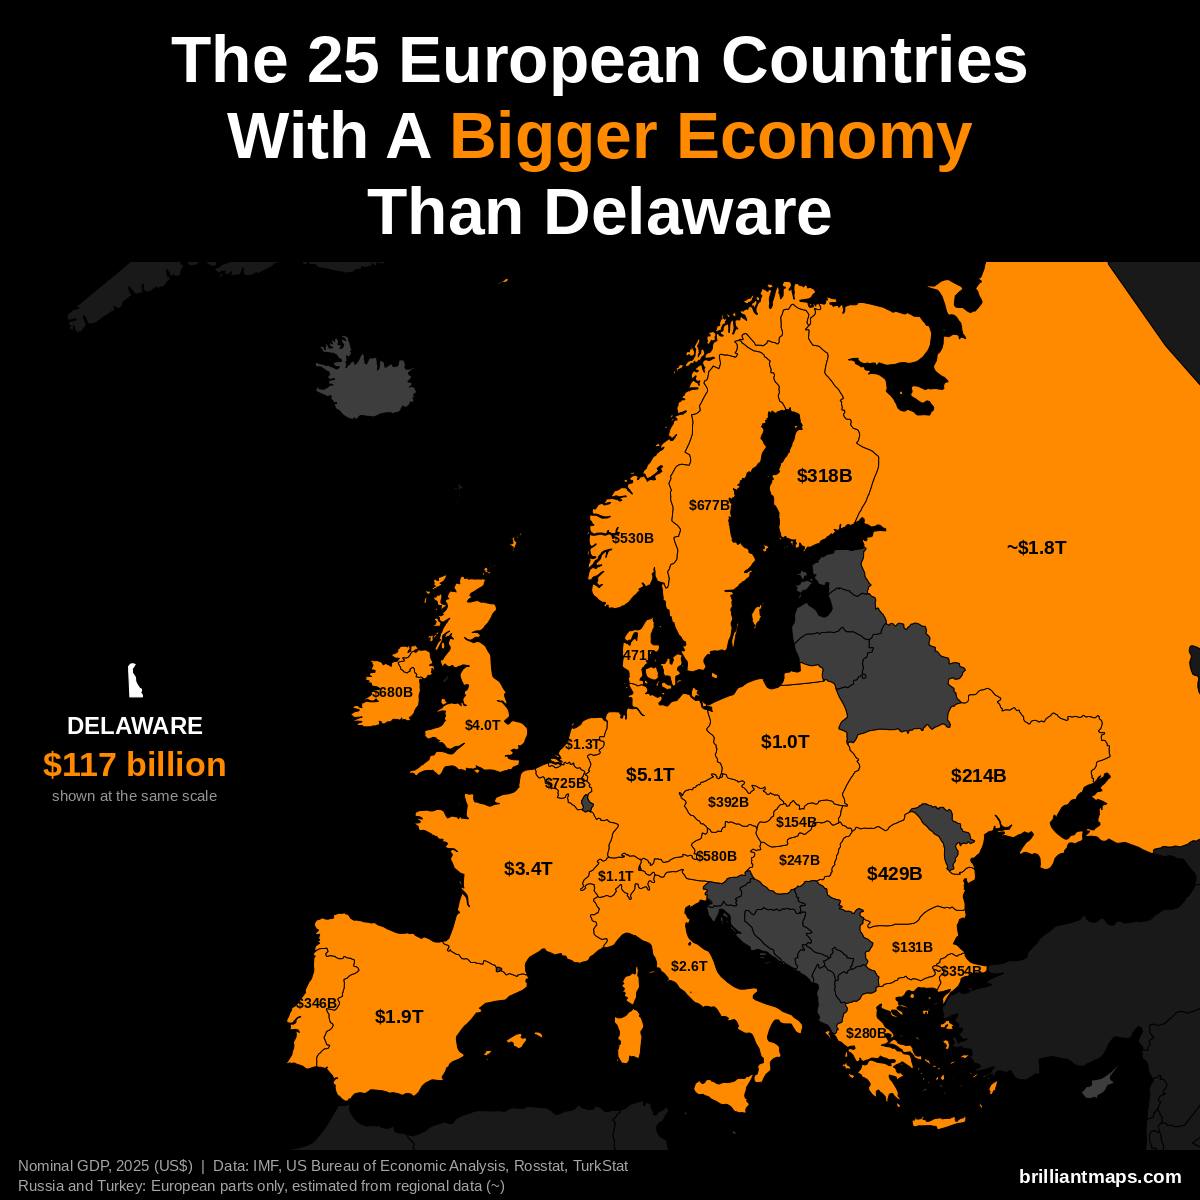
Delaware has a nominal GDP of $117 billion (2025). 25 European countries have a bigger economy:
- Germany: $5.12 trillion
- United Kingdom: $4.01 trillion
- France: $3.38 trillion
- Italy: $2.55 trillion
- Spain: $1.91 trillion
- Russia (European part): ~$1.83 trillion
- Netherlands: $1.32 trillion
- Switzerland: $1.06 trillion
- Poland: $1.04 trillion
- Belgium: $725 billion
- Ireland: $680 billion
- Sweden: $677 billion
- Austria: $580 billion
- Norway: $530 billion
- Denmark: $471 billion
- Romania: $429 billion
- Czechia: $392 billion
- Turkey (European part): ~$354 billion
- Portugal: $346 billion
- Finland: $318 billion
- Greece: $280 billion
- Hungary: $247 billion
- Ukraine: $214 billion
- Slovakia: $154 billion
- Bulgaria: $131 billion
Delaware Vs European GDP (PPP)
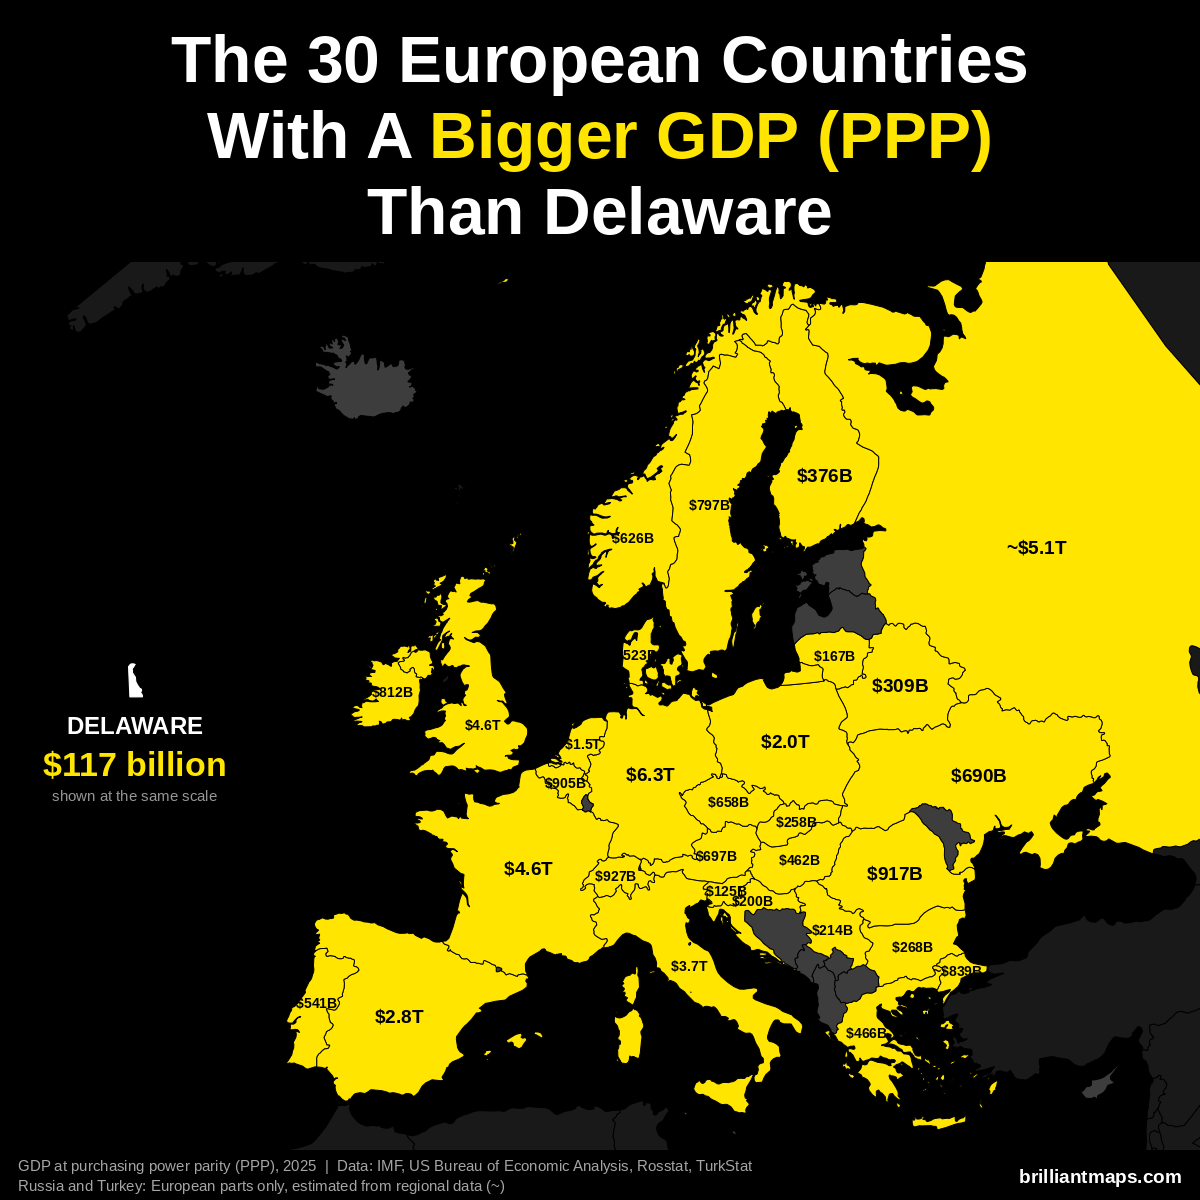
Delaware has a GDP of $117 billion (2025). US states are already measured in the dollars PPP is based on, so the figure is the same as nominal GDP. 30 European countries have a bigger GDP at purchasing power parity:
- Germany: $6.26 trillion
- Russia (European part): ~$5.14 trillion
- France: $4.58 trillion
- United Kingdom: $4.57 trillion
- Italy: $3.74 trillion
- Spain: $2.83 trillion
- Poland: $2.04 trillion
- Netherlands: $1.52 trillion
- Switzerland: $927 billion
- Romania: $917 billion
- Belgium: $905 billion
- Turkey (European part): ~$839 billion
- Ireland: $812 billion
- Sweden: $797 billion
- Austria: $697 billion
- Ukraine: $690 billion
- Czechia: $658 billion
- Norway: $626 billion
- Portugal: $541 billion
- Denmark: $523 billion
- Greece: $466 billion
- Hungary: $462 billion
- Finland: $376 billion
- Belarus: $309 billion
- Bulgaria: $268 billion
- Slovakia: $258 billion
- Serbia: $214 billion
- Croatia: $200 billion
- Lithuania: $167 billion
- Slovenia: $125 billion
Delaware Vs European GDP Per Capita (PPP)
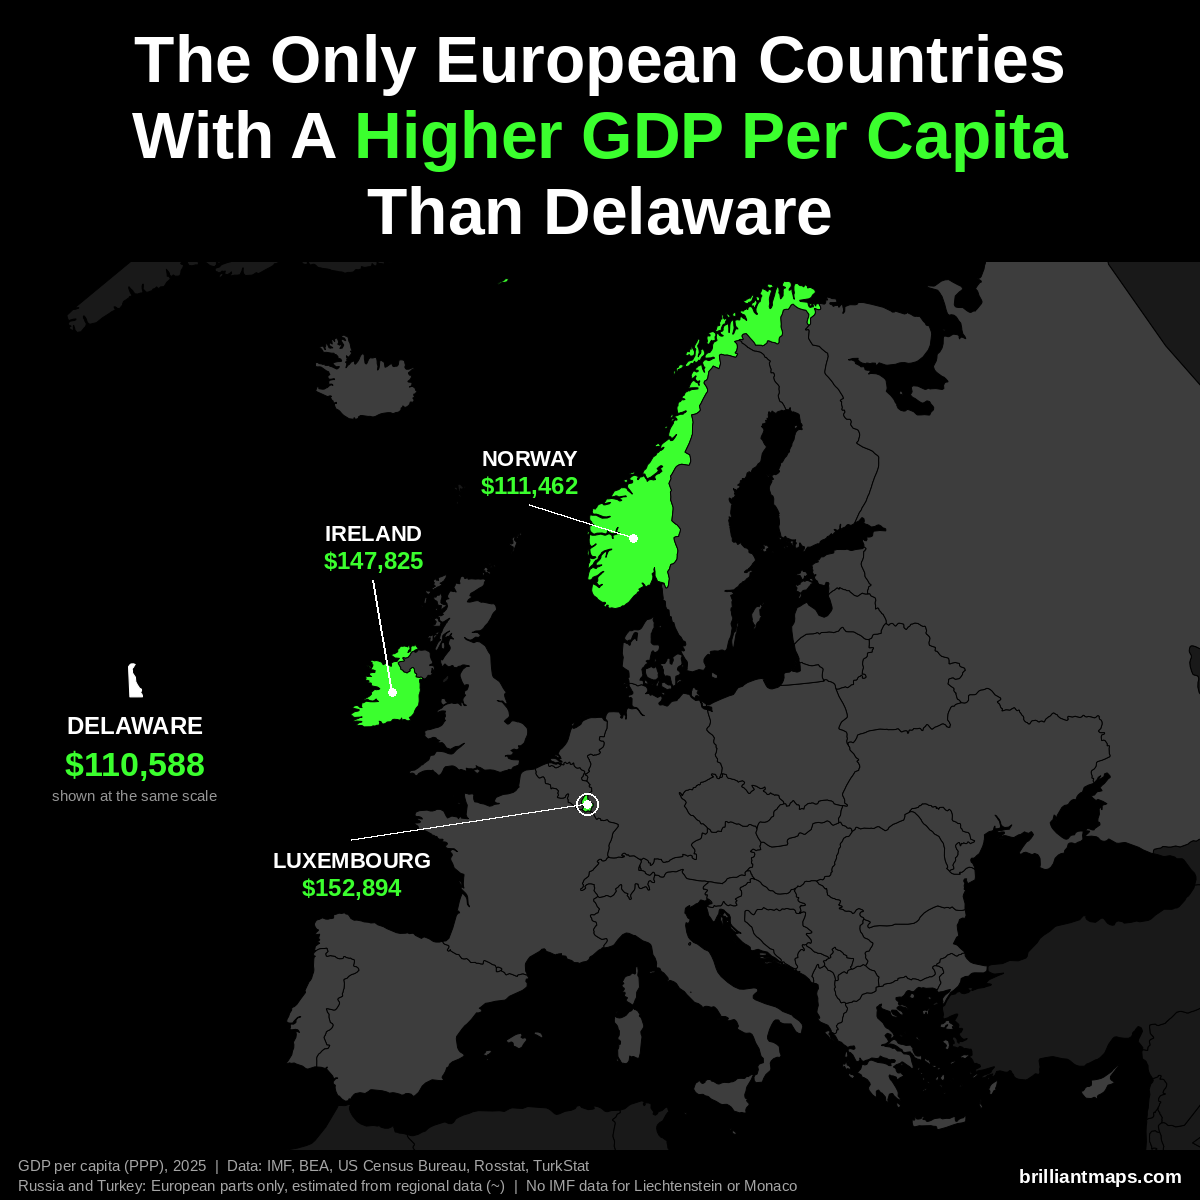
Delaware has a GDP per capita of $110,588 (2025). Only 3 European countries have a higher GDP per capita at purchasing power parity:
- Luxembourg: $152,894
- Ireland: $147,825
- Norway: $111,462
Liechtenstein and Monaco are not covered by the IMF data and are not counted here.
Delaware Vs European Size
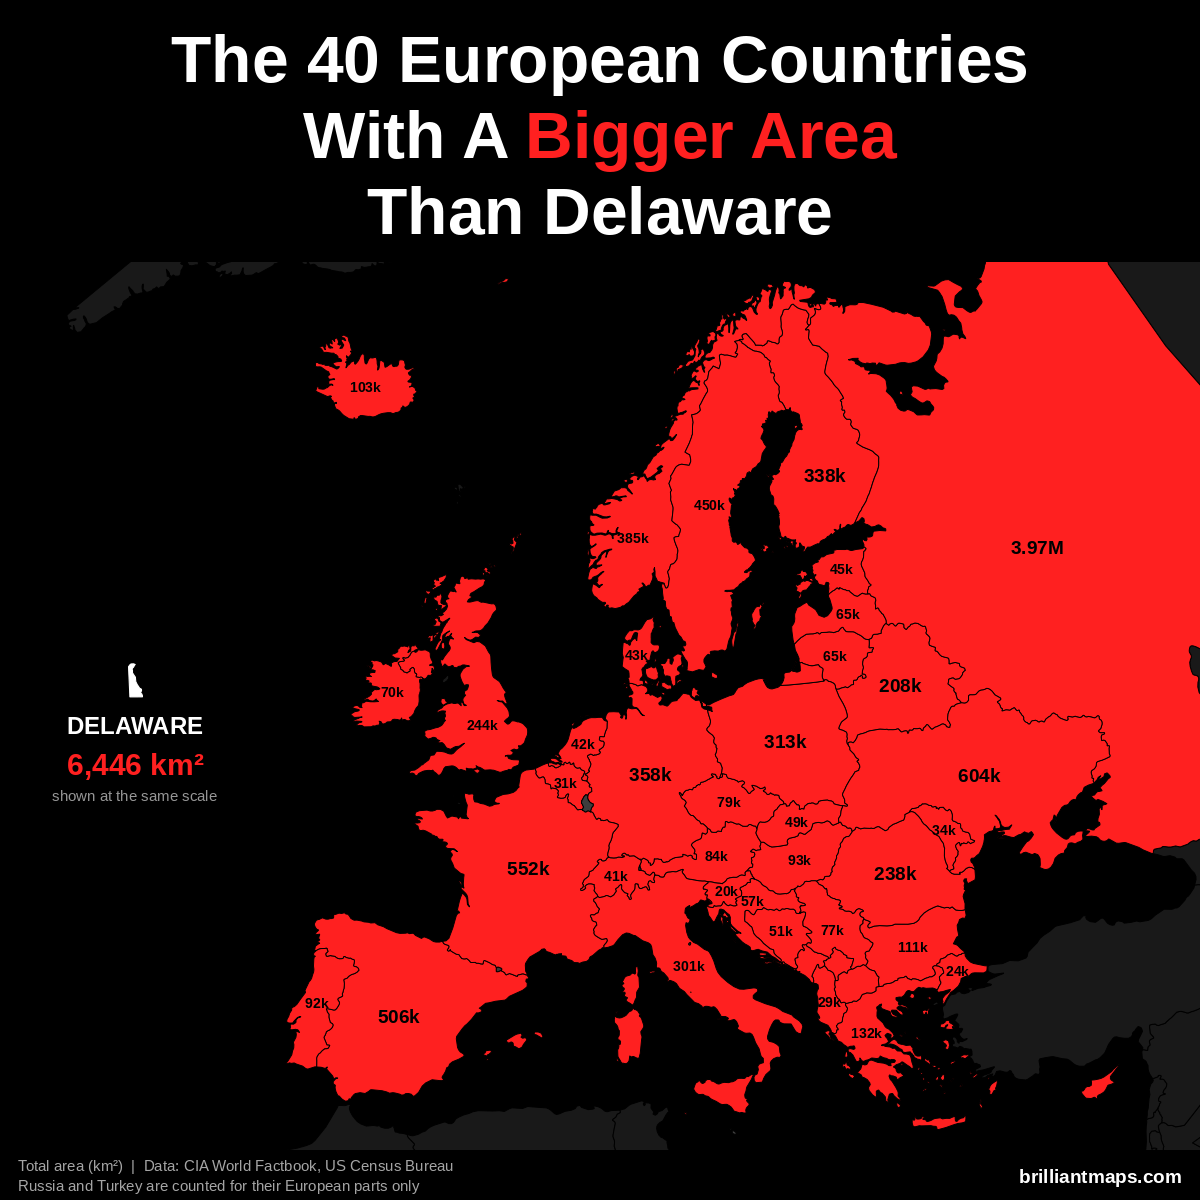
Delaware has a total area of 6,446 km² (2,489 sq mi). 40 European countries have a bigger area:
- Russia (European part): 3,969,100 km² (1,532,477 sq mi)
- Ukraine: 603,550 km² (233,032 sq mi)
- France: 551,695 km² (213,010 sq mi)
- Spain: 505,990 km² (195,364 sq mi)
- Sweden: 450,295 km² (173,860 sq mi)
- Norway: 385,207 km² (148,729 sq mi)
- Germany: 357,588 km² (138,065 sq mi)
- Finland: 338,455 km² (130,678 sq mi)
- Poland: 312,696 km² (120,733 sq mi)
- Italy: 301,340 km² (116,348 sq mi)
- United Kingdom: 243,610 km² (94,058 sq mi)
- Romania: 238,397 km² (92,046 sq mi)
- Belarus: 207,600 km² (80,155 sq mi)
- Greece: 131,957 km² (50,949 sq mi)
- Bulgaria: 110,994 km² (42,855 sq mi)
- Iceland: 103,000 km² (39,768 sq mi)
- Hungary: 93,028 km² (35,918 sq mi)
- Portugal: 92,212 km² (35,603 sq mi)
- Austria: 83,871 km² (32,383 sq mi)
- Czechia: 78,867 km² (30,451 sq mi)
- Serbia: 77,474 km² (29,913 sq mi)
- Ireland: 70,273 km² (27,133 sq mi)
- Lithuania: 65,300 km² (25,212 sq mi)
- Latvia: 64,589 km² (24,938 sq mi)
- Croatia: 56,594 km² (21,851 sq mi)
- Bosnia and Herzegovina: 51,197 km² (19,767 sq mi)
- Slovakia: 49,035 km² (18,933 sq mi)
- Estonia: 45,339 km² (17,505 sq mi)
- Denmark: 43,094 km² (16,639 sq mi)
- Netherlands: 41,850 km² (16,158 sq mi)
- Switzerland: 41,285 km² (15,940 sq mi)
- Moldova: 33,846 km² (13,068 sq mi)
- Belgium: 30,528 km² (11,787 sq mi)
- Albania: 28,748 km² (11,100 sq mi)
- North Macedonia: 25,713 km² (9,928 sq mi)
- Turkey (European part): 23,764 km² (9,175 sq mi)
- Slovenia: 20,273 km² (7,827 sq mi)
- Montenegro: 13,812 km² (5,333 sq mi)
- Kosovo: 10,887 km² (4,203 sq mi)
- Cyprus: 9,251 km² (3,572 sq mi)
Delaware Vs European Life Expectancy
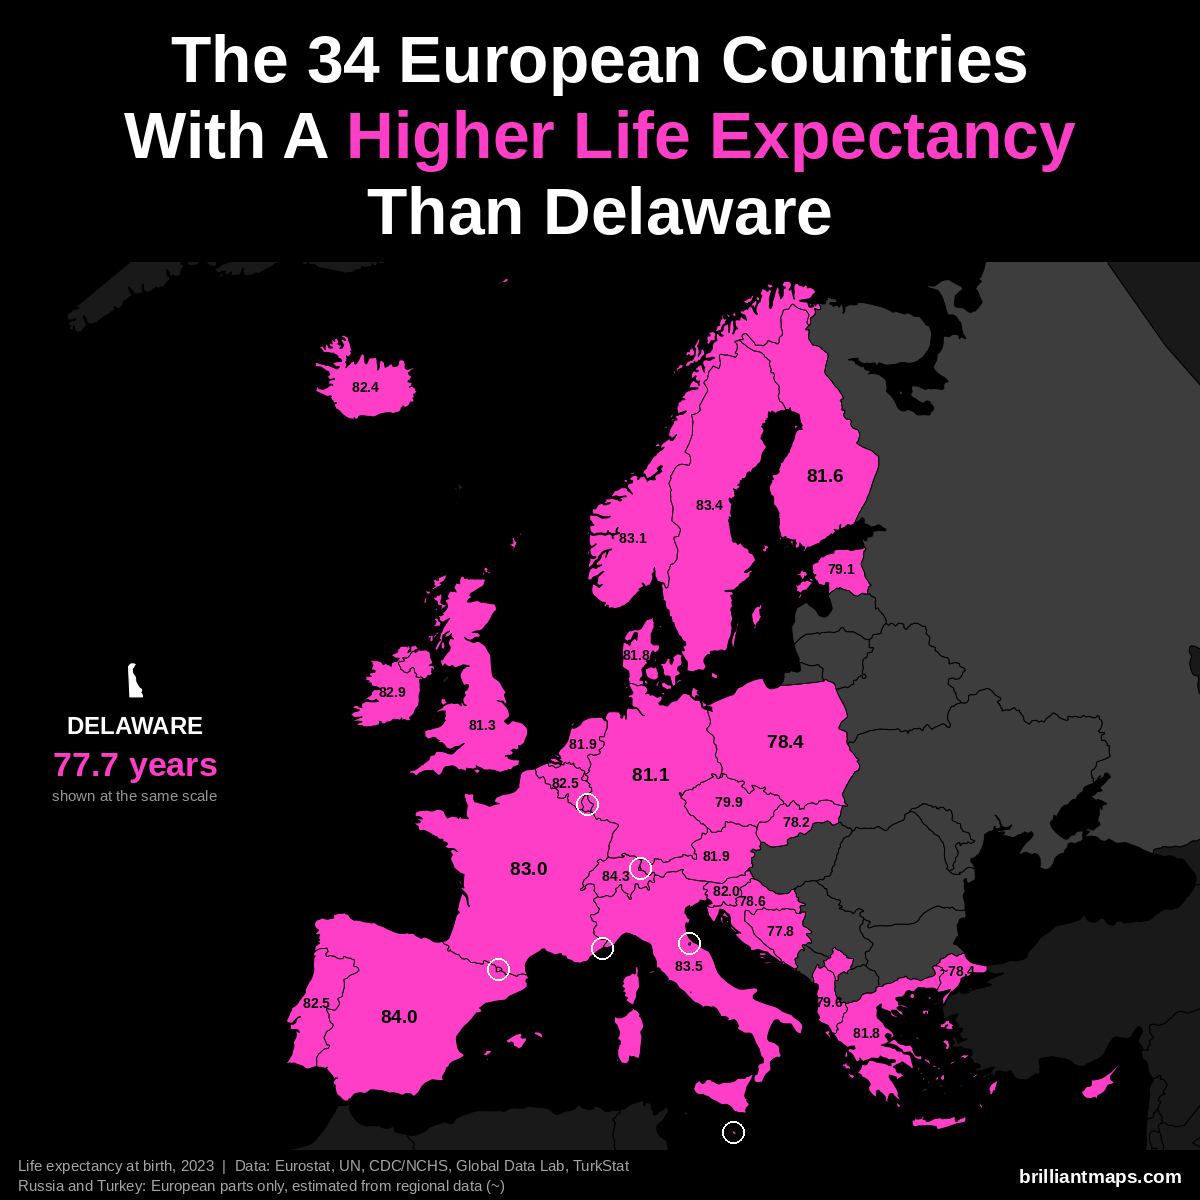
Delaware has a life expectancy at birth of 77.7 years (2023). 34 European countries have a higher life expectancy:
- Monaco: 86.4 years
- San Marino: 85.7 years
- Liechtenstein: 84.6 years
- Switzerland: 84.3 years
- Andorra: 84.0 years
- Spain: 84.0 years
- Italy: 83.5 years
- Luxembourg: 83.4 years
- Malta: 83.4 years
- Sweden: 83.4 years
- Norway: 83.1 years
- France: 83.0 years
- Cyprus: 82.9 years
- Ireland: 82.9 years
- Belgium: 82.5 years
- Portugal: 82.5 years
- Iceland: 82.4 years
- Slovenia: 82.0 years
- Austria: 81.9 years
- Netherlands: 81.9 years
- Denmark: 81.8 years
- Greece: 81.8 years
- Finland: 81.6 years
- United Kingdom: 81.3 years
- Germany: 81.1 years
- Czechia: 79.9 years
- Albania: 79.6 years
- Estonia: 79.1 years
- Croatia: 78.6 years
- Poland: 78.4 years
- Turkey (European part): ~78.4 years
- Slovakia: 78.2 years
- Kosovo: 78.0 years
- Bosnia and Herzegovina: 77.8 years
Florida vs Europe
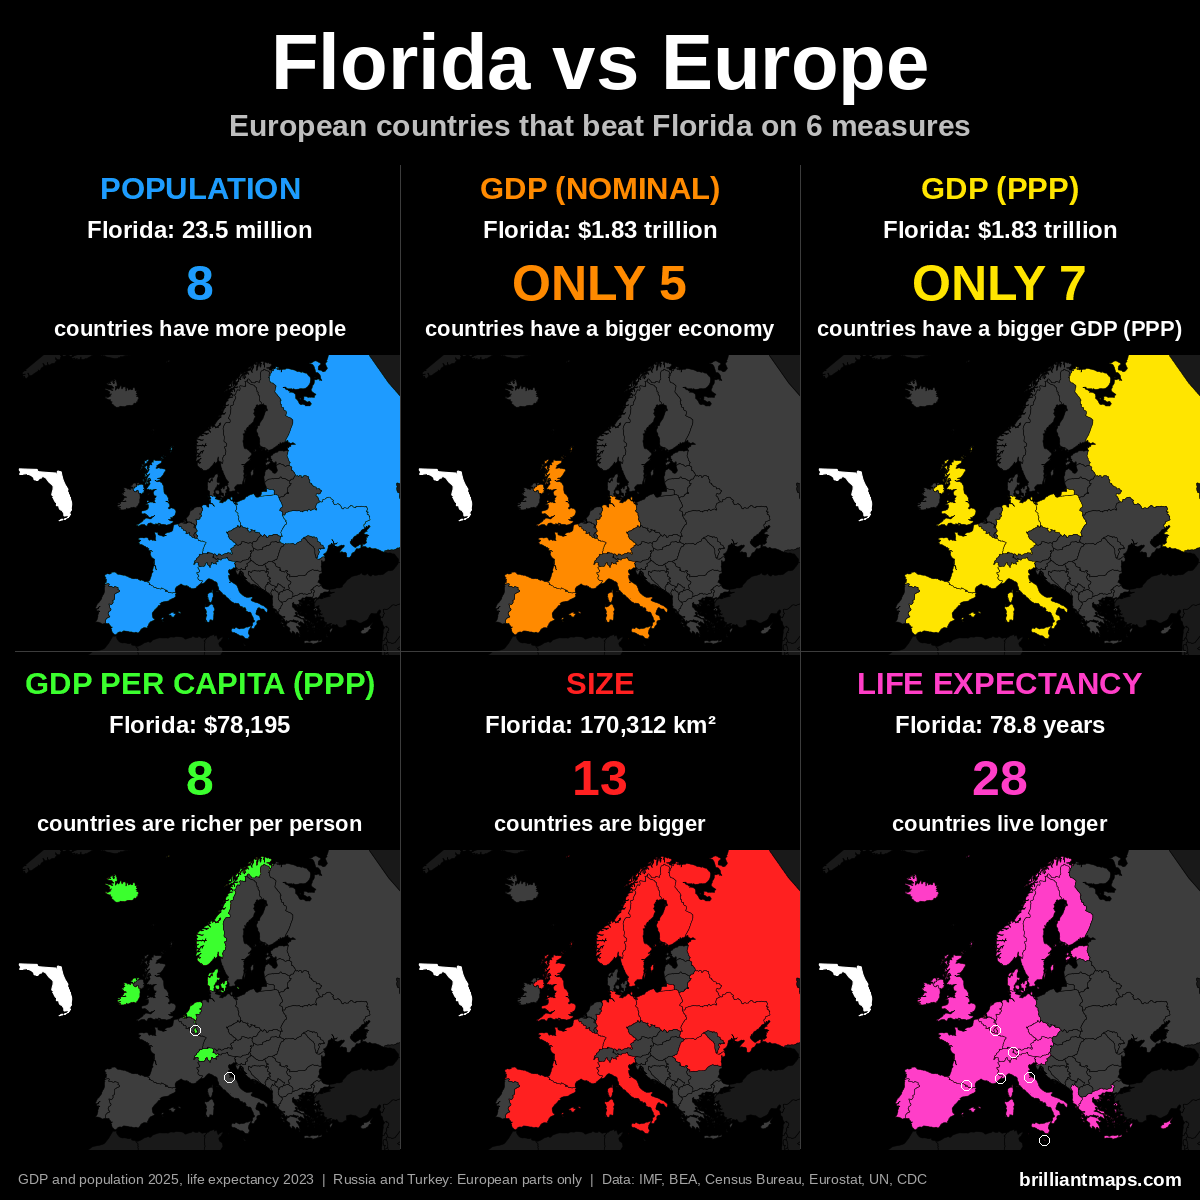
Florida Vs European Population
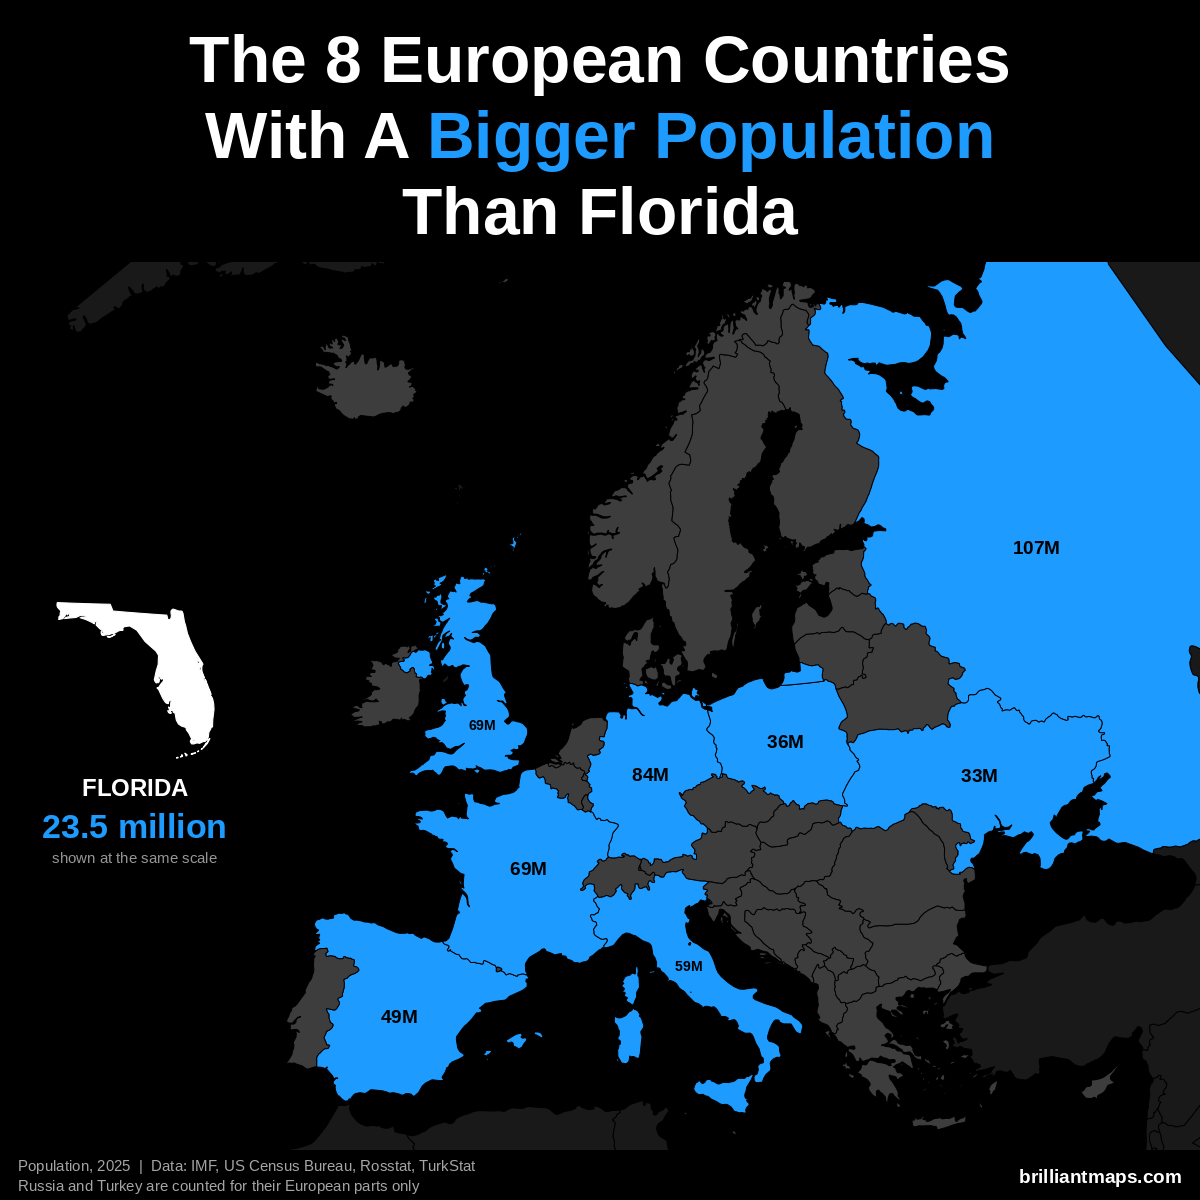
Florida has a population of 23.5 million (2025). 8 European countries have a bigger population:
- Russia (European part): 107.0 million
- Germany: 83.5 million
- United Kingdom: 69.5 million
- France: 68.9 million
- Italy: 58.9 million
- Spain: 49.5 million
- Poland: 36.5 million
- Ukraine: 32.9 million
Florida Vs European GDP (Nominal)
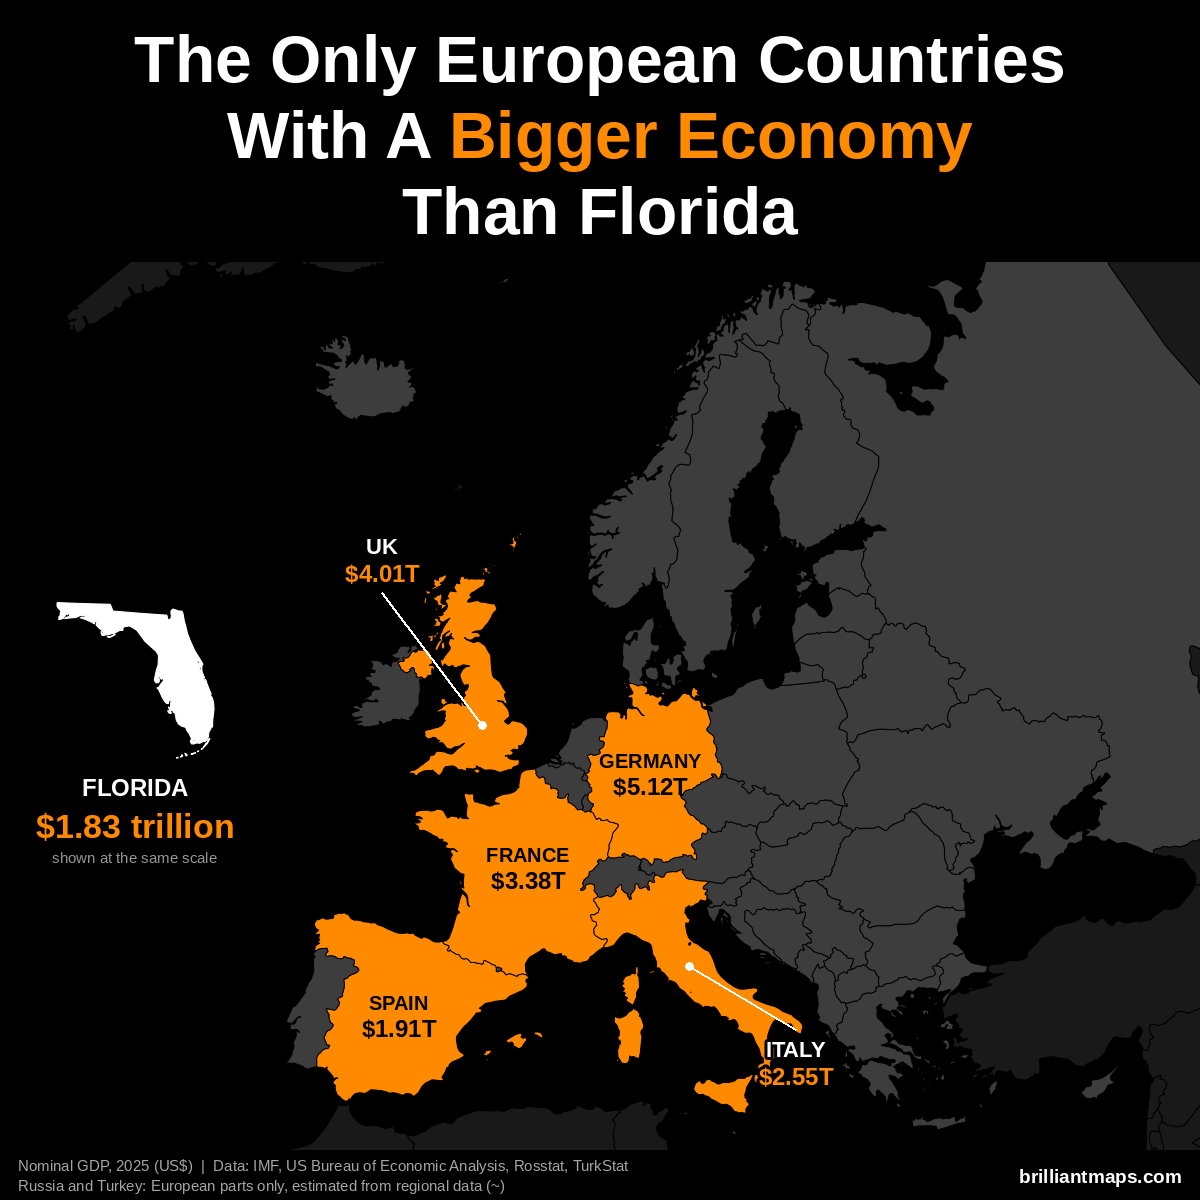
Florida has a nominal GDP of $1.83 trillion (2025). Only 5 European countries have a bigger economy:
- Germany: $5.12 trillion
- United Kingdom: $4.01 trillion
- France: $3.38 trillion
- Italy: $2.55 trillion
- Spain: $1.91 trillion
Florida Vs European GDP (PPP)
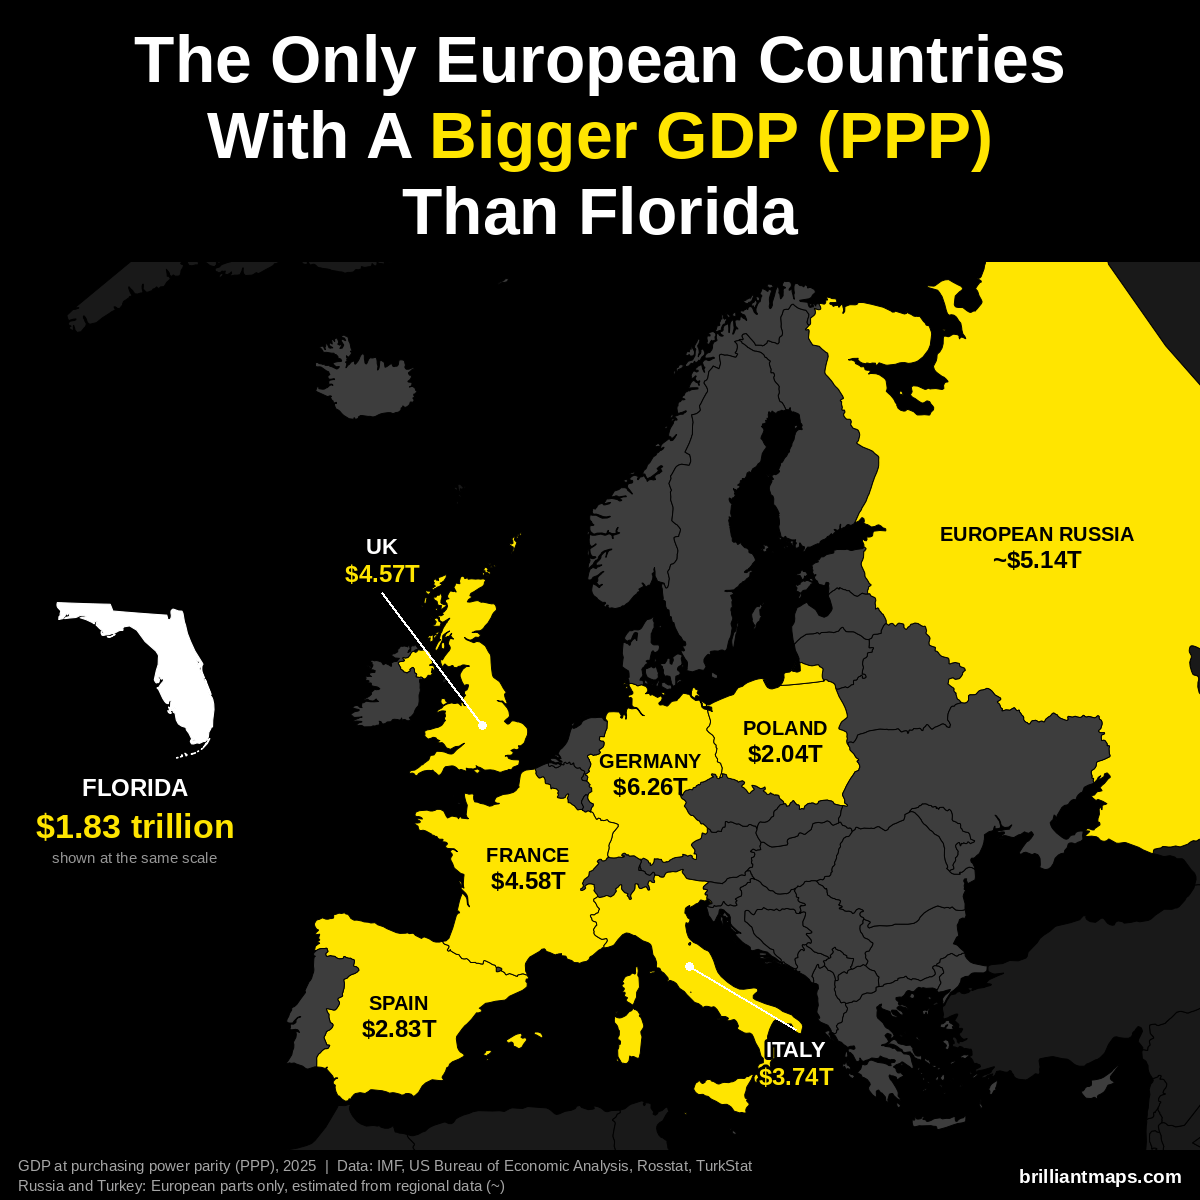
Florida has a GDP of $1.83 trillion (2025). US states are already measured in the dollars PPP is based on, so the figure is the same as nominal GDP. Only 7 European countries have a bigger GDP at purchasing power parity:
- Germany: $6.26 trillion
- Russia (European part): ~$5.14 trillion
- France: $4.58 trillion
- United Kingdom: $4.57 trillion
- Italy: $3.74 trillion
- Spain: $2.83 trillion
- Poland: $2.04 trillion
Florida Vs European GDP Per Capita (PPP)
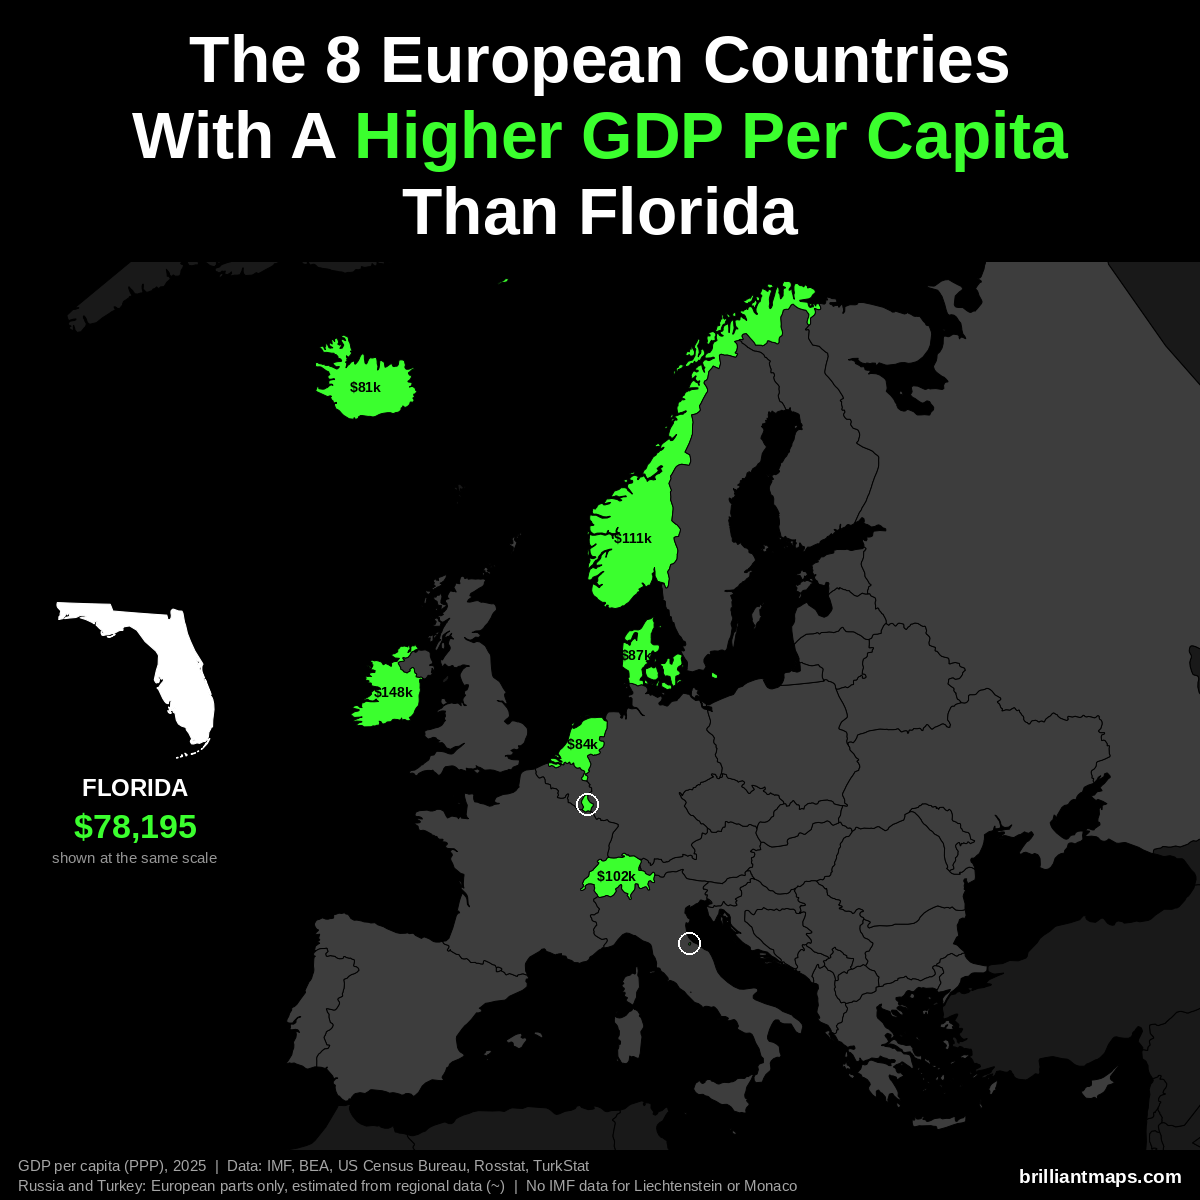
Florida has a GDP per capita of $78,195 (2025). 8 European countries have a higher GDP per capita at purchasing power parity:
- Luxembourg: $152,894
- Ireland: $147,825
- Norway: $111,462
- Switzerland: $102,397
- Denmark: $87,303
- Netherlands: $84,445
- San Marino: $83,838
- Iceland: $80,915
Liechtenstein and Monaco are not covered by the IMF data and are not counted here.
Florida Vs European Size
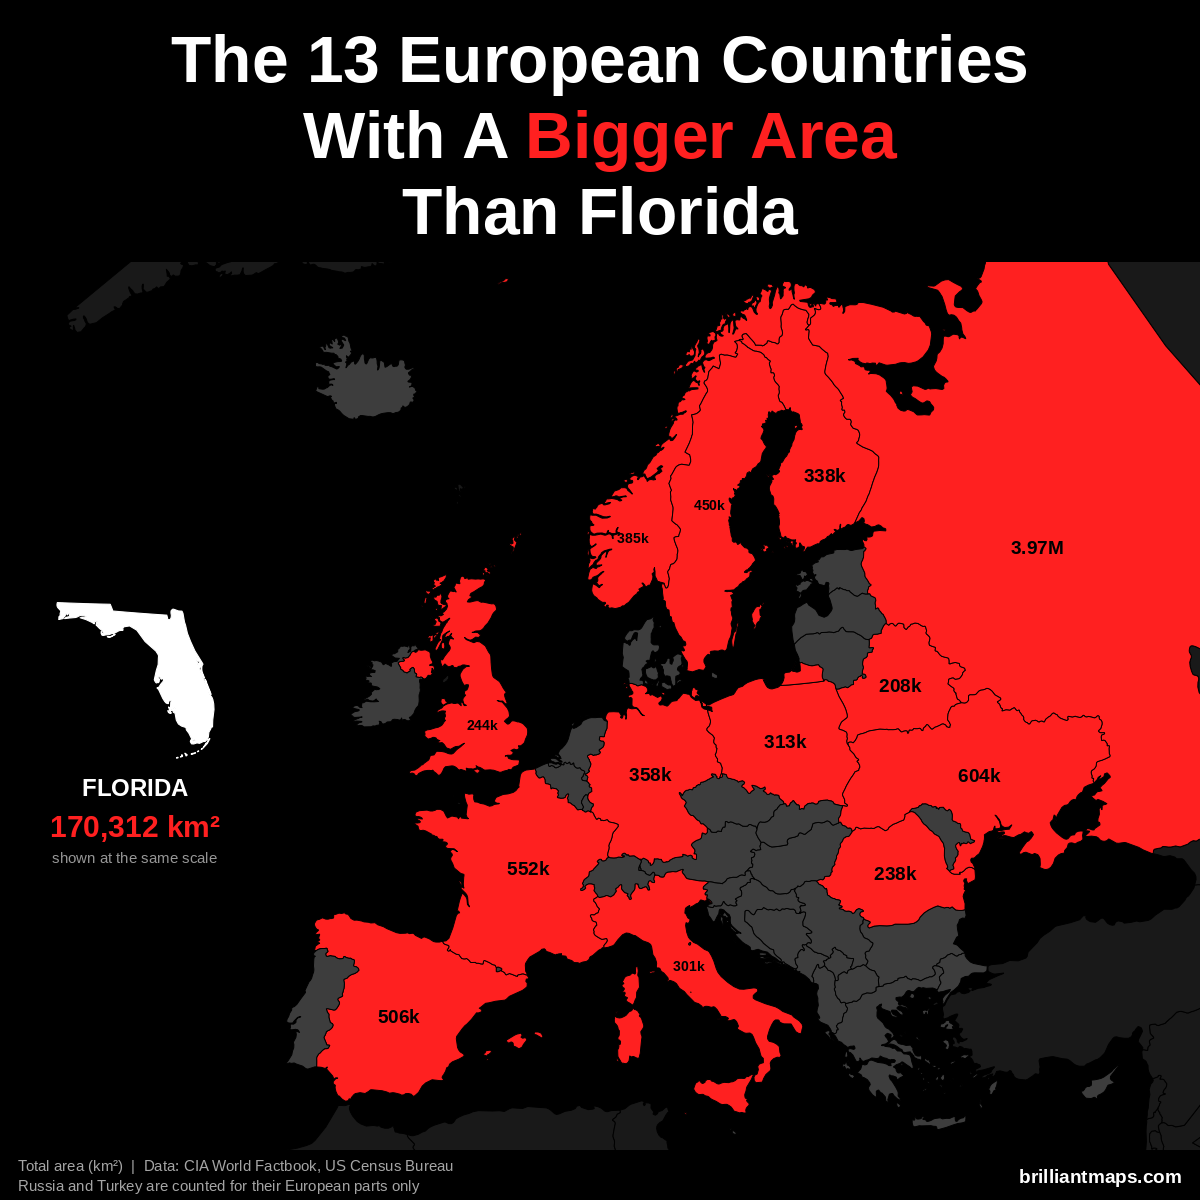
Florida has a total area of 170,312 km² (65,758 sq mi). 13 European countries have a bigger area:
- Russia (European part): 3,969,100 km² (1,532,477 sq mi)
- Ukraine: 603,550 km² (233,032 sq mi)
- France: 551,695 km² (213,010 sq mi)
- Spain: 505,990 km² (195,364 sq mi)
- Sweden: 450,295 km² (173,860 sq mi)
- Norway: 385,207 km² (148,729 sq mi)
- Germany: 357,588 km² (138,065 sq mi)
- Finland: 338,455 km² (130,678 sq mi)
- Poland: 312,696 km² (120,733 sq mi)
- Italy: 301,340 km² (116,348 sq mi)
- United Kingdom: 243,610 km² (94,058 sq mi)
- Romania: 238,397 km² (92,046 sq mi)
- Belarus: 207,600 km² (80,155 sq mi)
Florida Vs European Life Expectancy
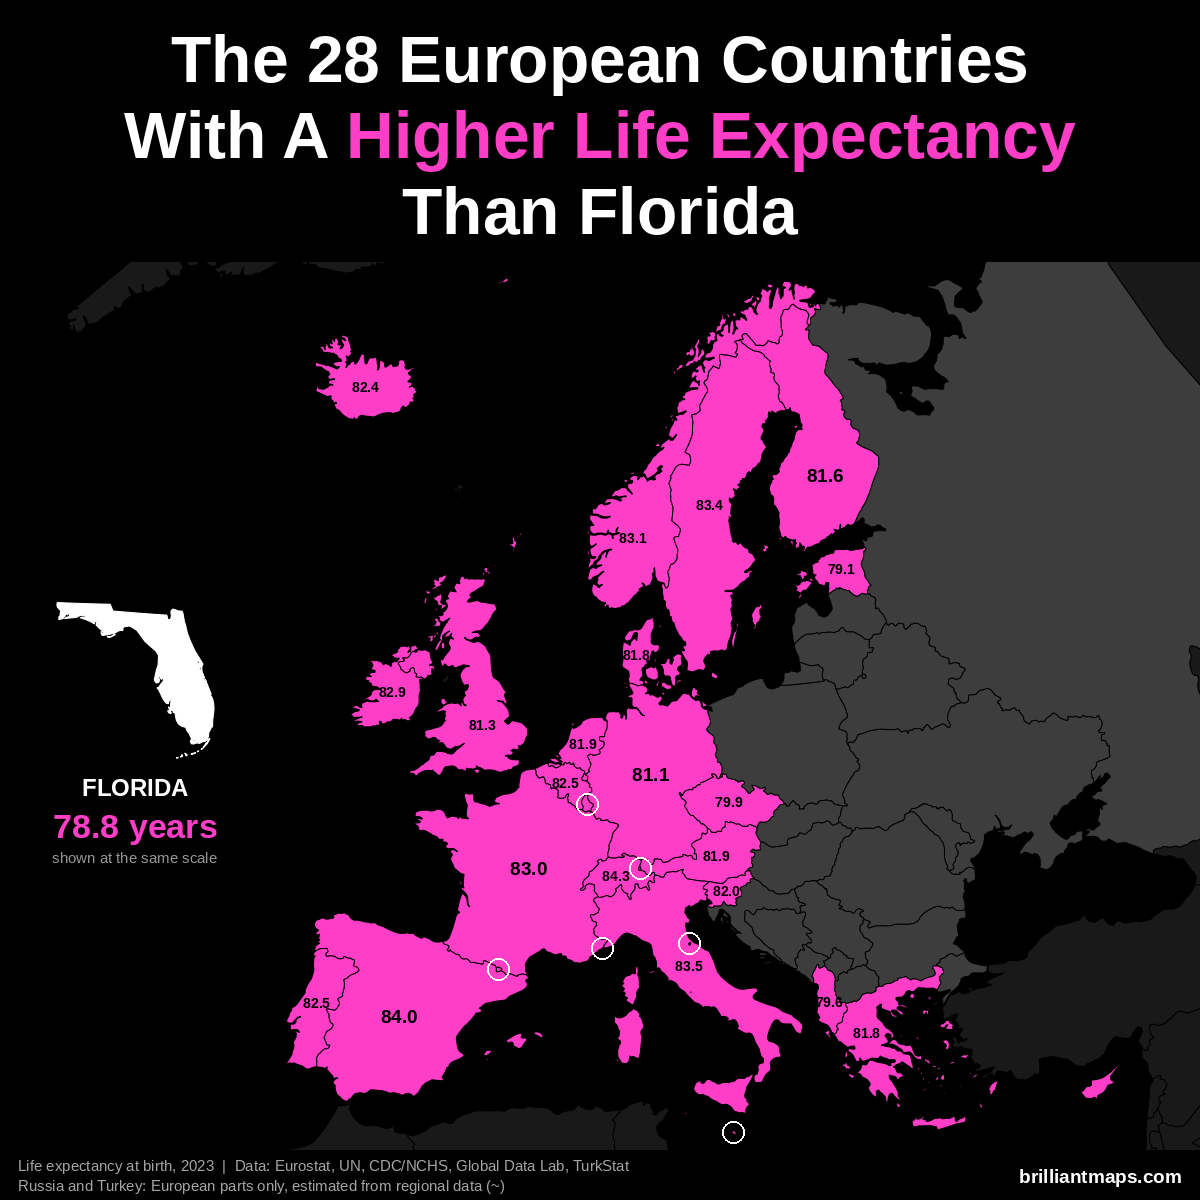
Florida has a life expectancy at birth of 78.8 years (2023). 28 European countries have a higher life expectancy:
- Monaco: 86.4 years
- San Marino: 85.7 years
- Liechtenstein: 84.6 years
- Switzerland: 84.3 years
- Andorra: 84.0 years
- Spain: 84.0 years
- Italy: 83.5 years
- Luxembourg: 83.4 years
- Malta: 83.4 years
- Sweden: 83.4 years
- Norway: 83.1 years
- France: 83.0 years
- Cyprus: 82.9 years
- Ireland: 82.9 years
- Belgium: 82.5 years
- Portugal: 82.5 years
- Iceland: 82.4 years
- Slovenia: 82.0 years
- Austria: 81.9 years
- Netherlands: 81.9 years
- Denmark: 81.8 years
- Greece: 81.8 years
- Finland: 81.6 years
- United Kingdom: 81.3 years
- Germany: 81.1 years
- Czechia: 79.9 years
- Albania: 79.6 years
- Estonia: 79.1 years
Georgia vs Europe
Georgia Vs European Population
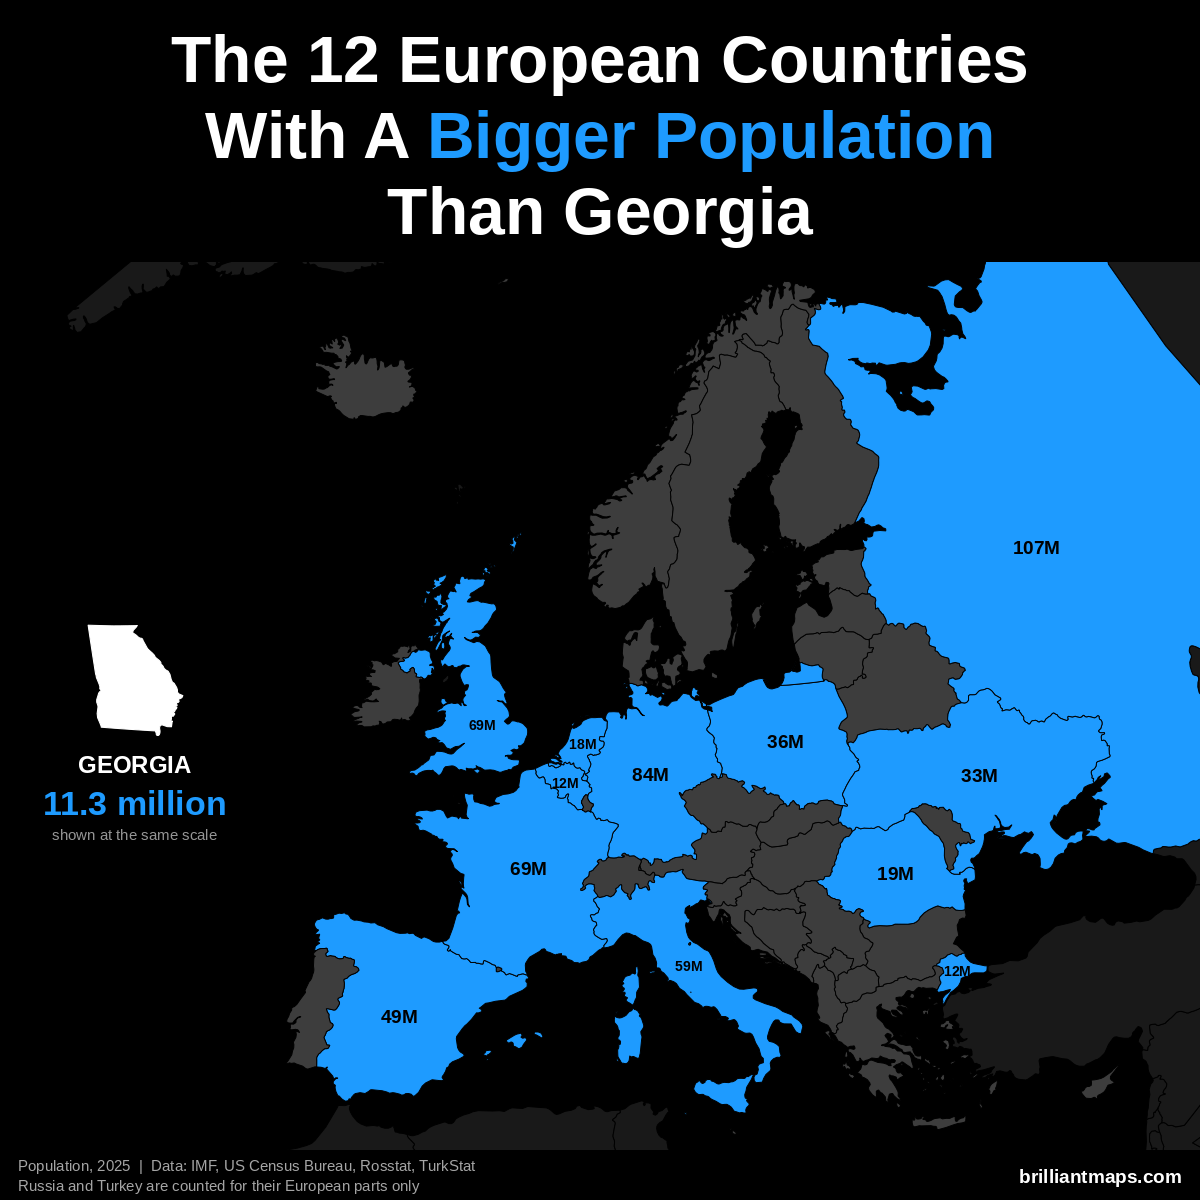
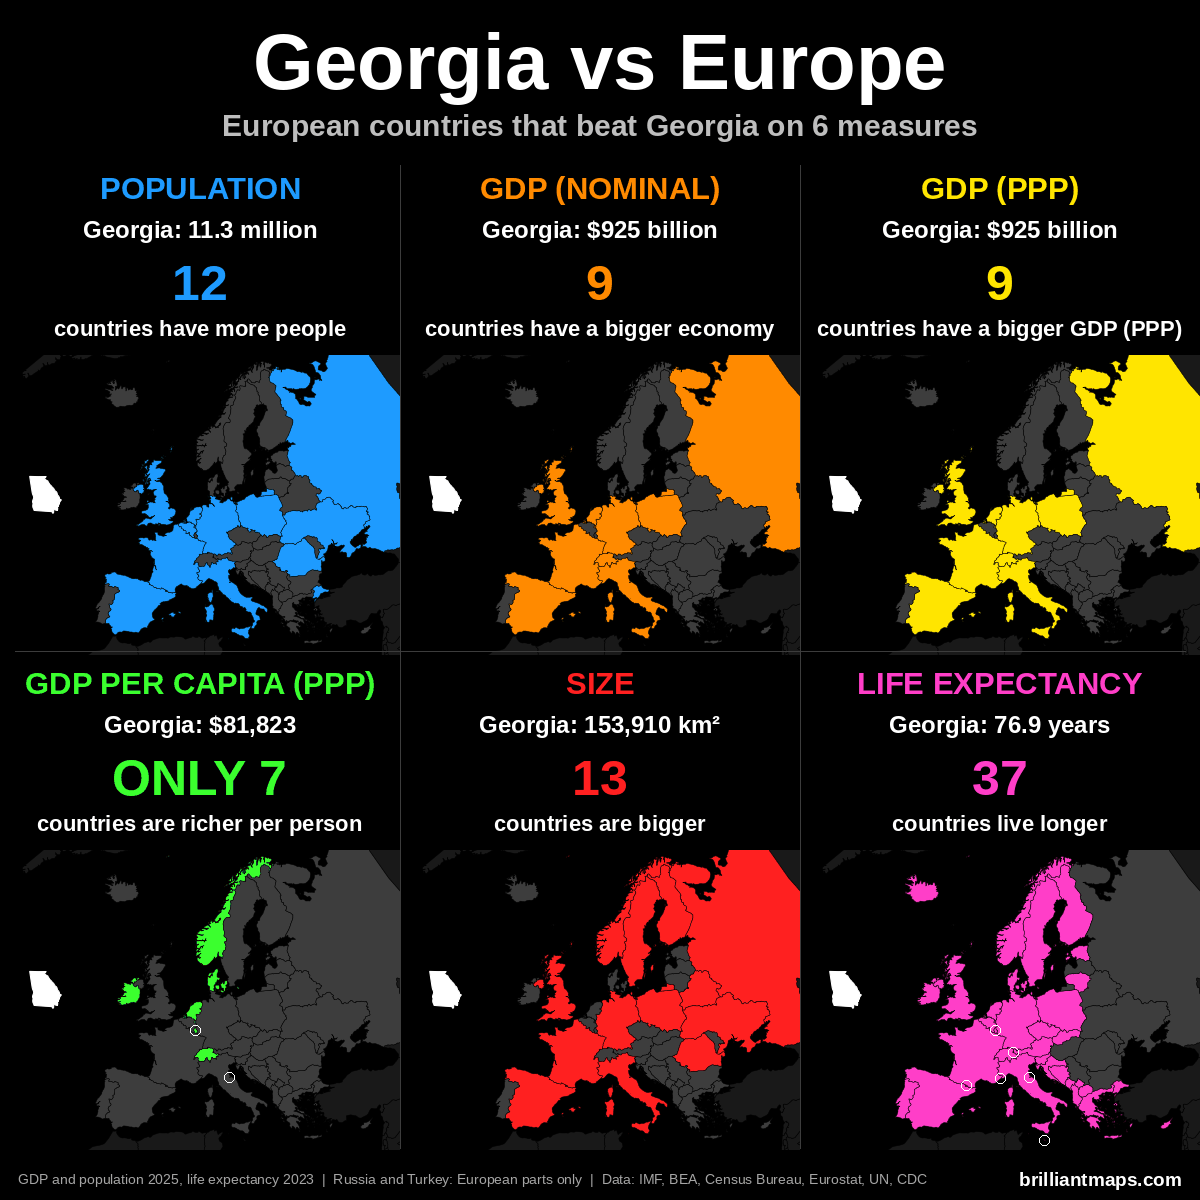
Georgia has a population of 11.3 million (2025). 12 European countries have a bigger population:
- Russia (European part): 107.0 million
- Germany: 83.5 million
- United Kingdom: 69.5 million
- France: 68.9 million
- Italy: 58.9 million
- Spain: 49.5 million
- Poland: 36.5 million
- Ukraine: 32.9 million
- Romania: 19.0 million
- Netherlands: 18.0 million
- Turkey (European part): 12.2 million
- Belgium: 11.9 million
Georgia Vs European GDP (Nominal)
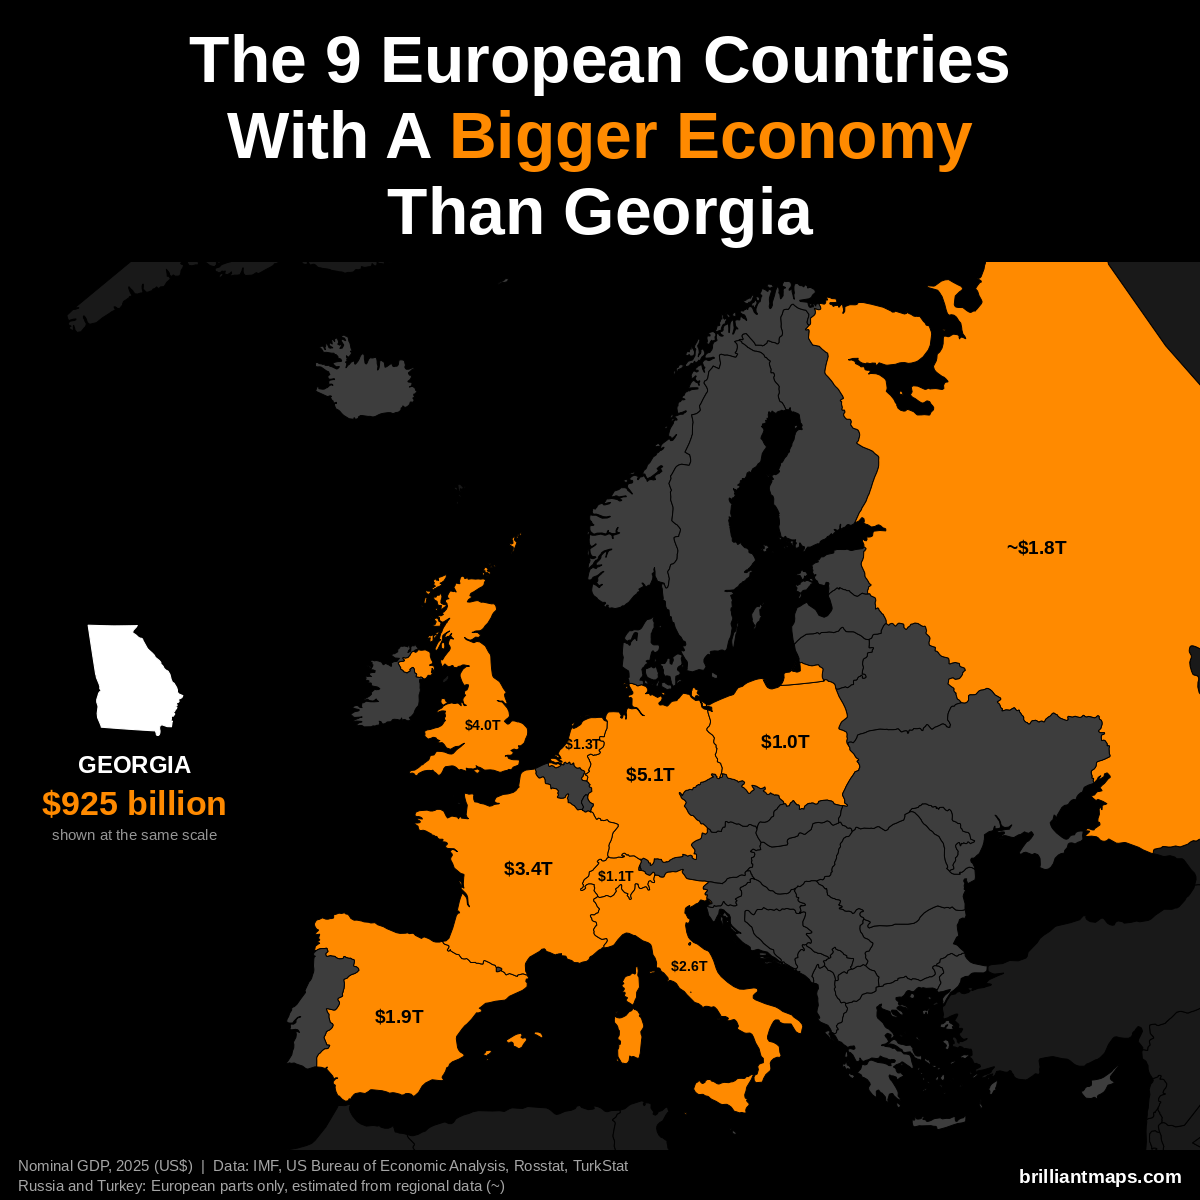
Georgia has a nominal GDP of $925 billion (2025). 9 European countries have a bigger economy:
- Germany: $5.12 trillion
- United Kingdom: $4.01 trillion
- France: $3.38 trillion
- Italy: $2.55 trillion
- Spain: $1.91 trillion
- Russia (European part): ~$1.83 trillion
- Netherlands: $1.32 trillion
- Switzerland: $1.06 trillion
- Poland: $1.04 trillion
Georgia Vs European GDP (PPP)
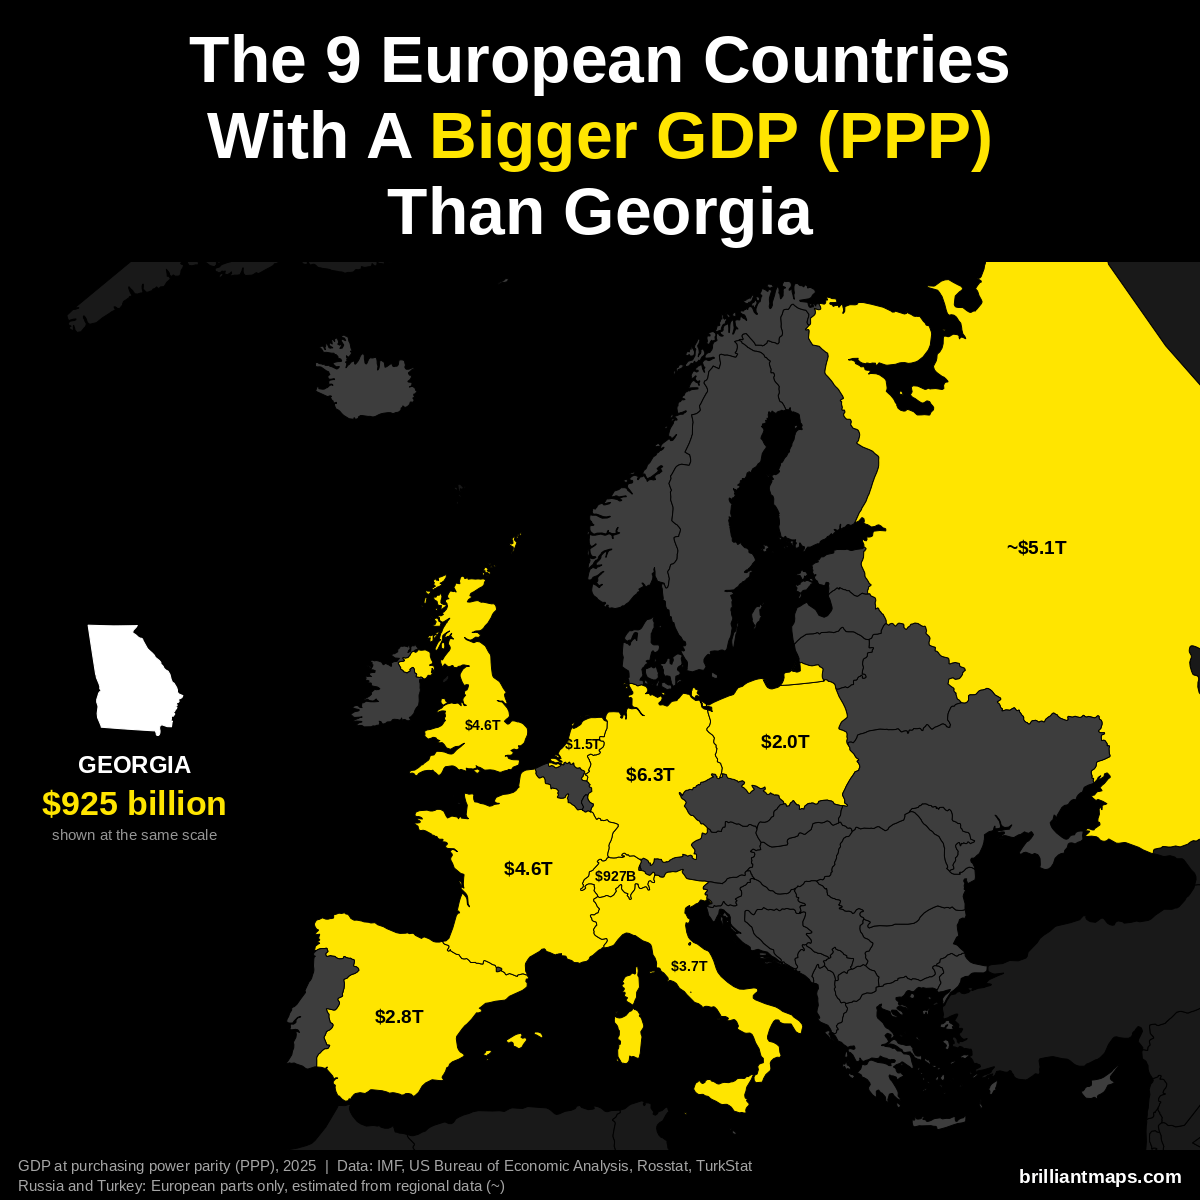
Georgia has a GDP of $925 billion (2025). US states are already measured in the dollars PPP is based on, so the figure is the same as nominal GDP. 9 European countries have a bigger GDP at purchasing power parity:
- Germany: $6.26 trillion
- Russia (European part): ~$5.14 trillion
- France: $4.58 trillion
- United Kingdom: $4.57 trillion
- Italy: $3.74 trillion
- Spain: $2.83 trillion
- Poland: $2.04 trillion
- Netherlands: $1.52 trillion
- Switzerland: $927 billion
Georgia Vs European GDP Per Capita (PPP)
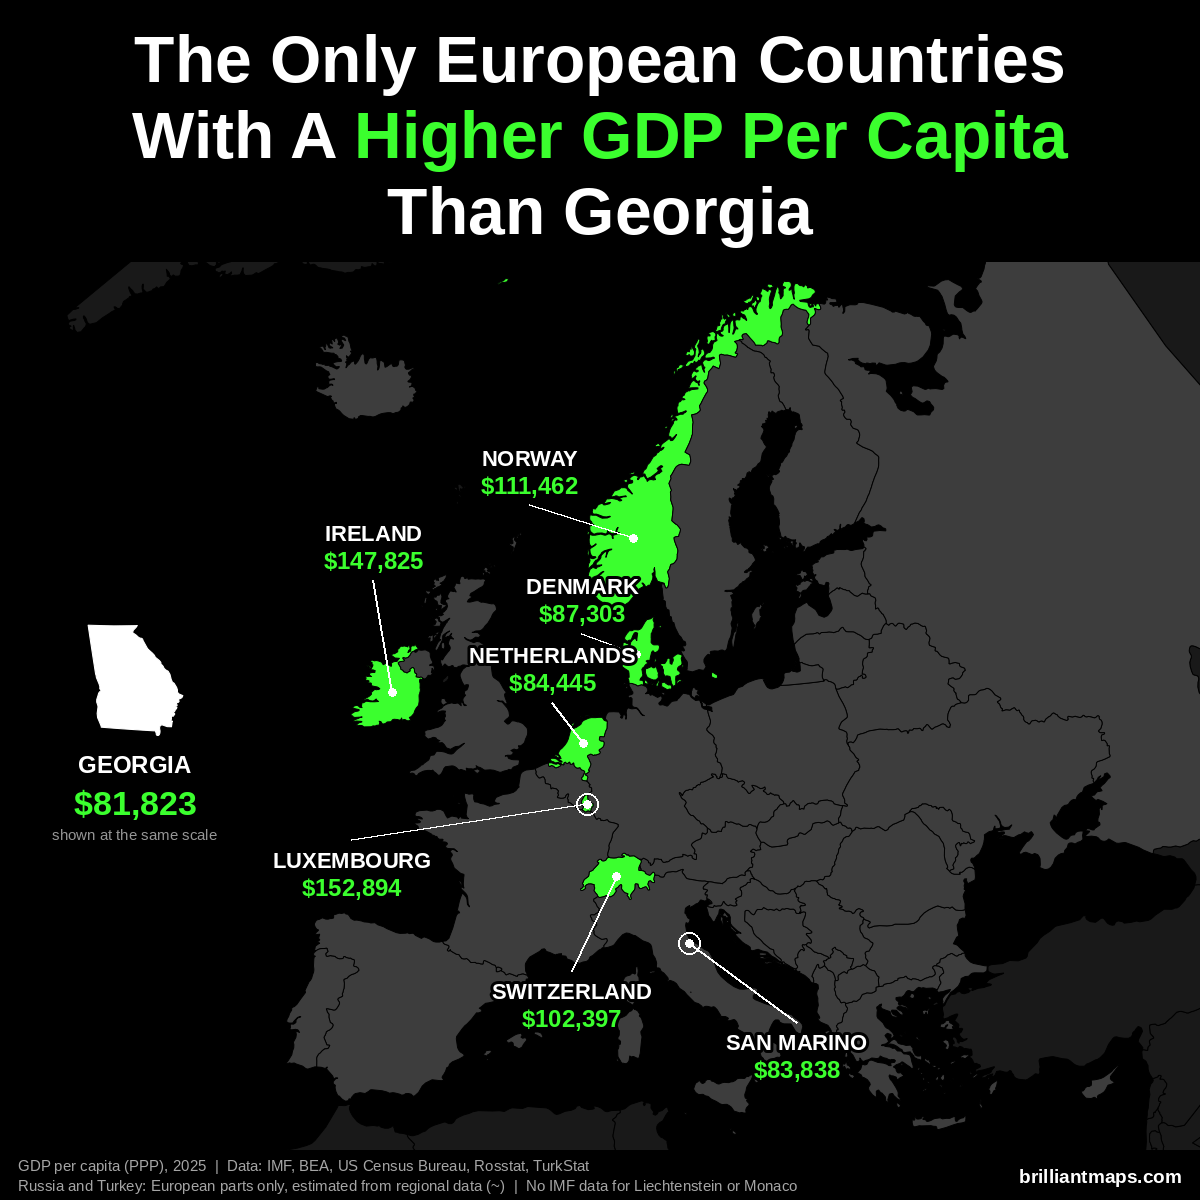
Georgia has a GDP per capita of $81,823 (2025). Only 7 European countries have a higher GDP per capita at purchasing power parity:
- Luxembourg: $152,894
- Ireland: $147,825
- Norway: $111,462
- Switzerland: $102,397
- Denmark: $87,303
- Netherlands: $84,445
- San Marino: $83,838
Liechtenstein and Monaco are not covered by the IMF data and are not counted here.
Georgia Vs European Size
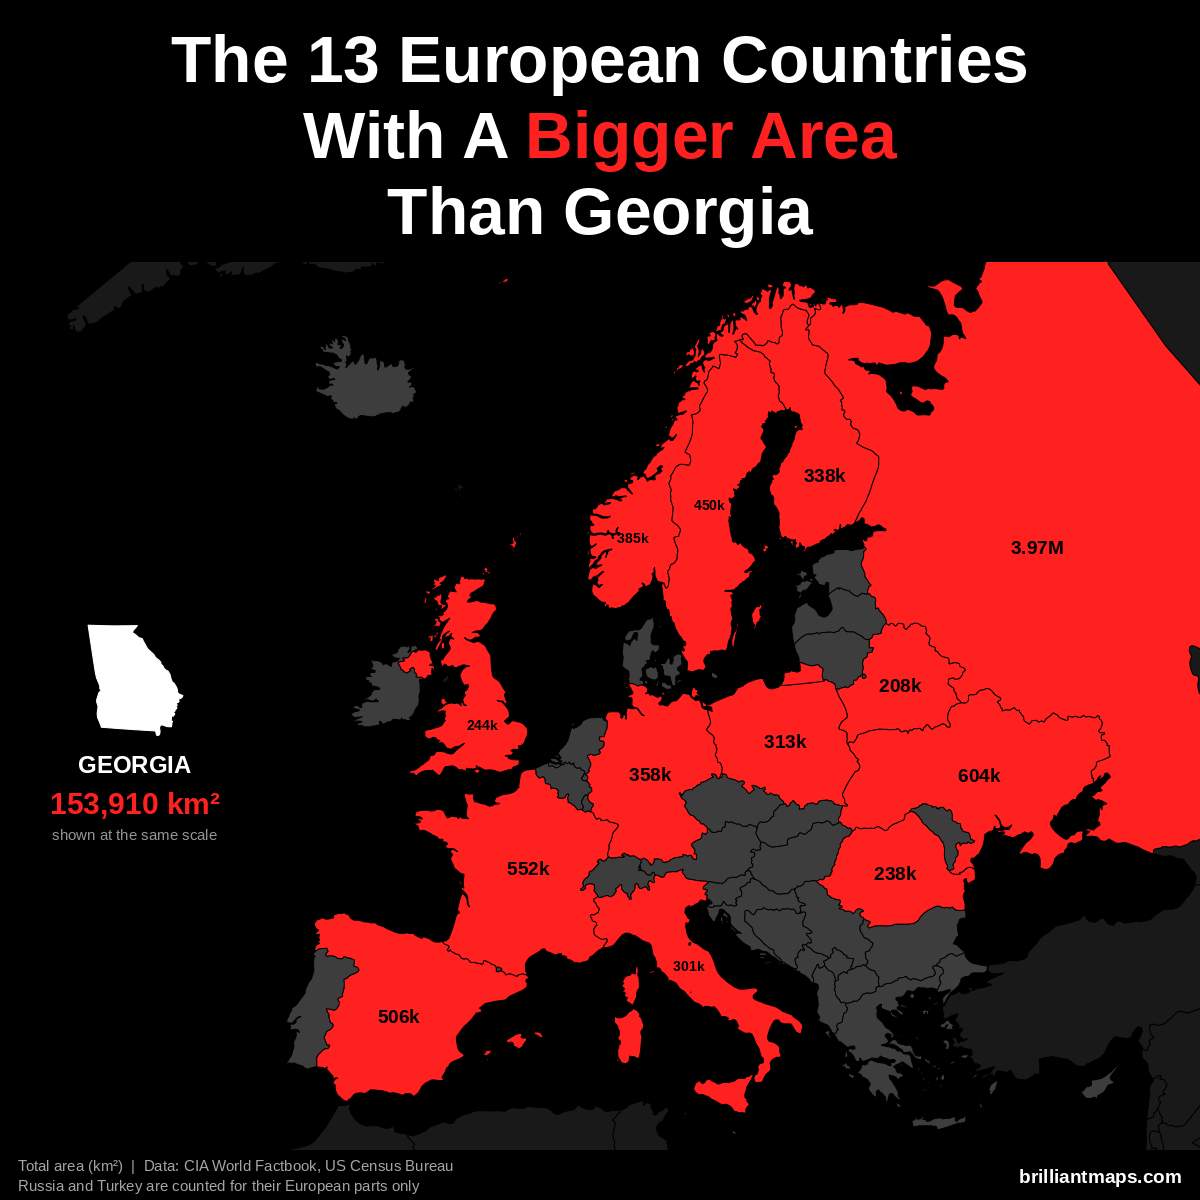
Georgia has a total area of 153,910 km² (59,425 sq mi). 13 European countries have a bigger area:
- Russia (European part): 3,969,100 km² (1,532,477 sq mi)
- Ukraine: 603,550 km² (233,032 sq mi)
- France: 551,695 km² (213,010 sq mi)
- Spain: 505,990 km² (195,364 sq mi)
- Sweden: 450,295 km² (173,860 sq mi)
- Norway: 385,207 km² (148,729 sq mi)
- Germany: 357,588 km² (138,065 sq mi)
- Finland: 338,455 km² (130,678 sq mi)
- Poland: 312,696 km² (120,733 sq mi)
- Italy: 301,340 km² (116,348 sq mi)
- United Kingdom: 243,610 km² (94,058 sq mi)
- Romania: 238,397 km² (92,046 sq mi)
- Belarus: 207,600 km² (80,155 sq mi)
Georgia Vs European Life Expectancy
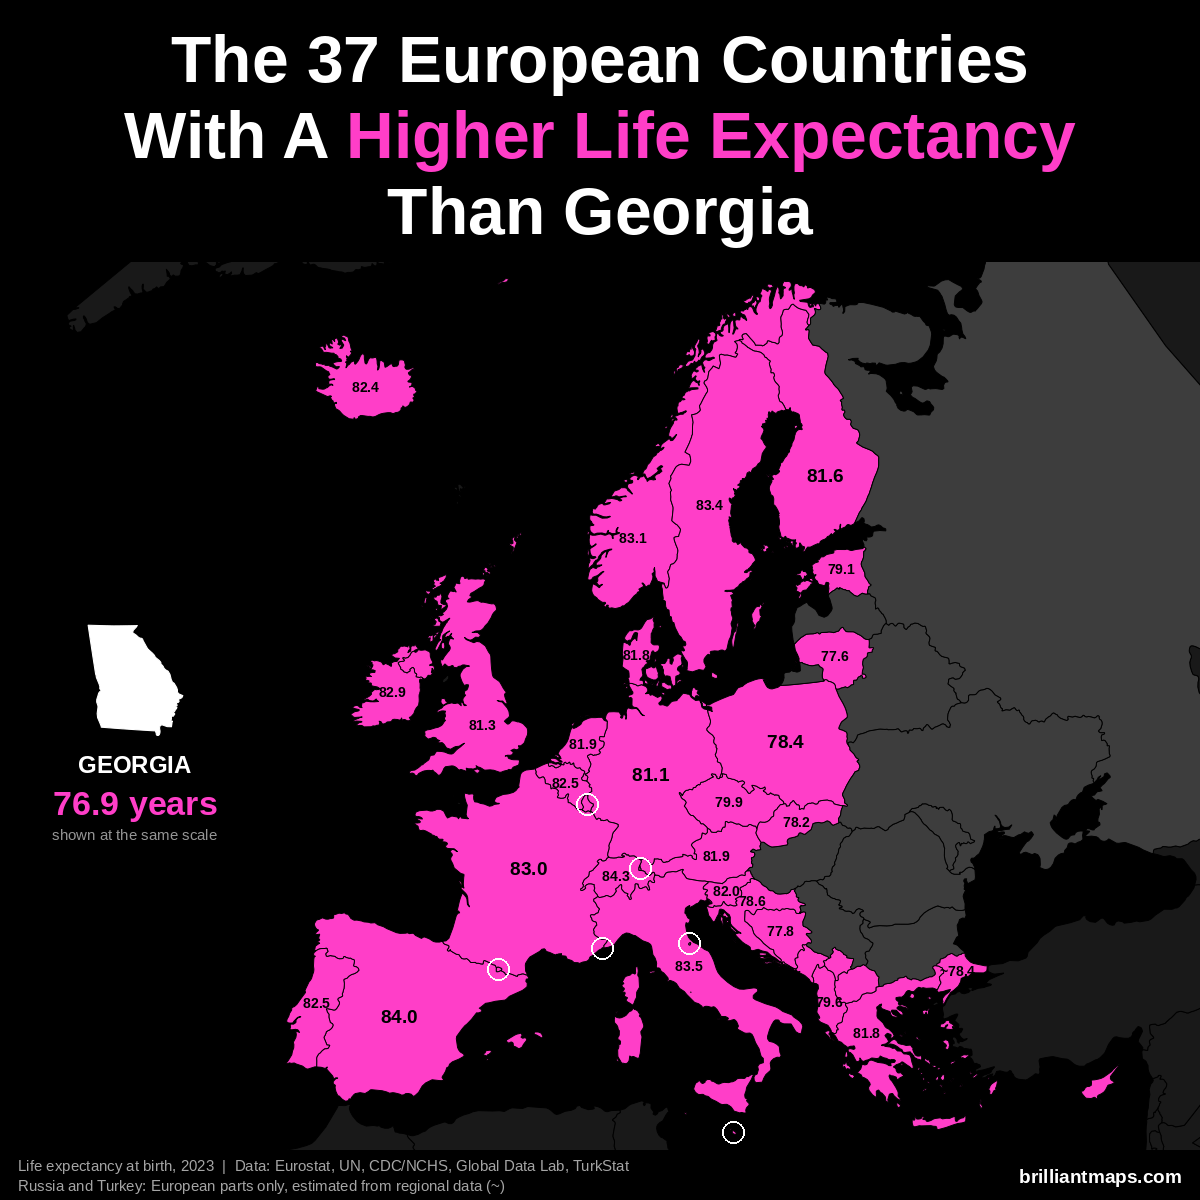
Georgia has a life expectancy at birth of 76.9 years (2023). 37 European countries have a higher life expectancy:
- Monaco: 86.4 years
- San Marino: 85.7 years
- Liechtenstein: 84.6 years
- Switzerland: 84.3 years
- Andorra: 84.0 years
- Spain: 84.0 years
- Italy: 83.5 years
- Luxembourg: 83.4 years
- Malta: 83.4 years
- Sweden: 83.4 years
- Norway: 83.1 years
- France: 83.0 years
- Cyprus: 82.9 years
- Ireland: 82.9 years
- Belgium: 82.5 years
- Portugal: 82.5 years
- Iceland: 82.4 years
- Slovenia: 82.0 years
- Austria: 81.9 years
- Netherlands: 81.9 years
- Denmark: 81.8 years
- Greece: 81.8 years
- Finland: 81.6 years
- United Kingdom: 81.3 years
- Germany: 81.1 years
- Czechia: 79.9 years
- Albania: 79.6 years
- Estonia: 79.1 years
- Croatia: 78.6 years
- Poland: 78.4 years
- Turkey (European part): ~78.4 years
- Slovakia: 78.2 years
- Kosovo: 78.0 years
- Bosnia and Herzegovina: 77.8 years
- Lithuania: 77.6 years
- Montenegro: 77.6 years
- North Macedonia: 77.4 years
Hawaii vs Europe
Hawaii Vs European Population
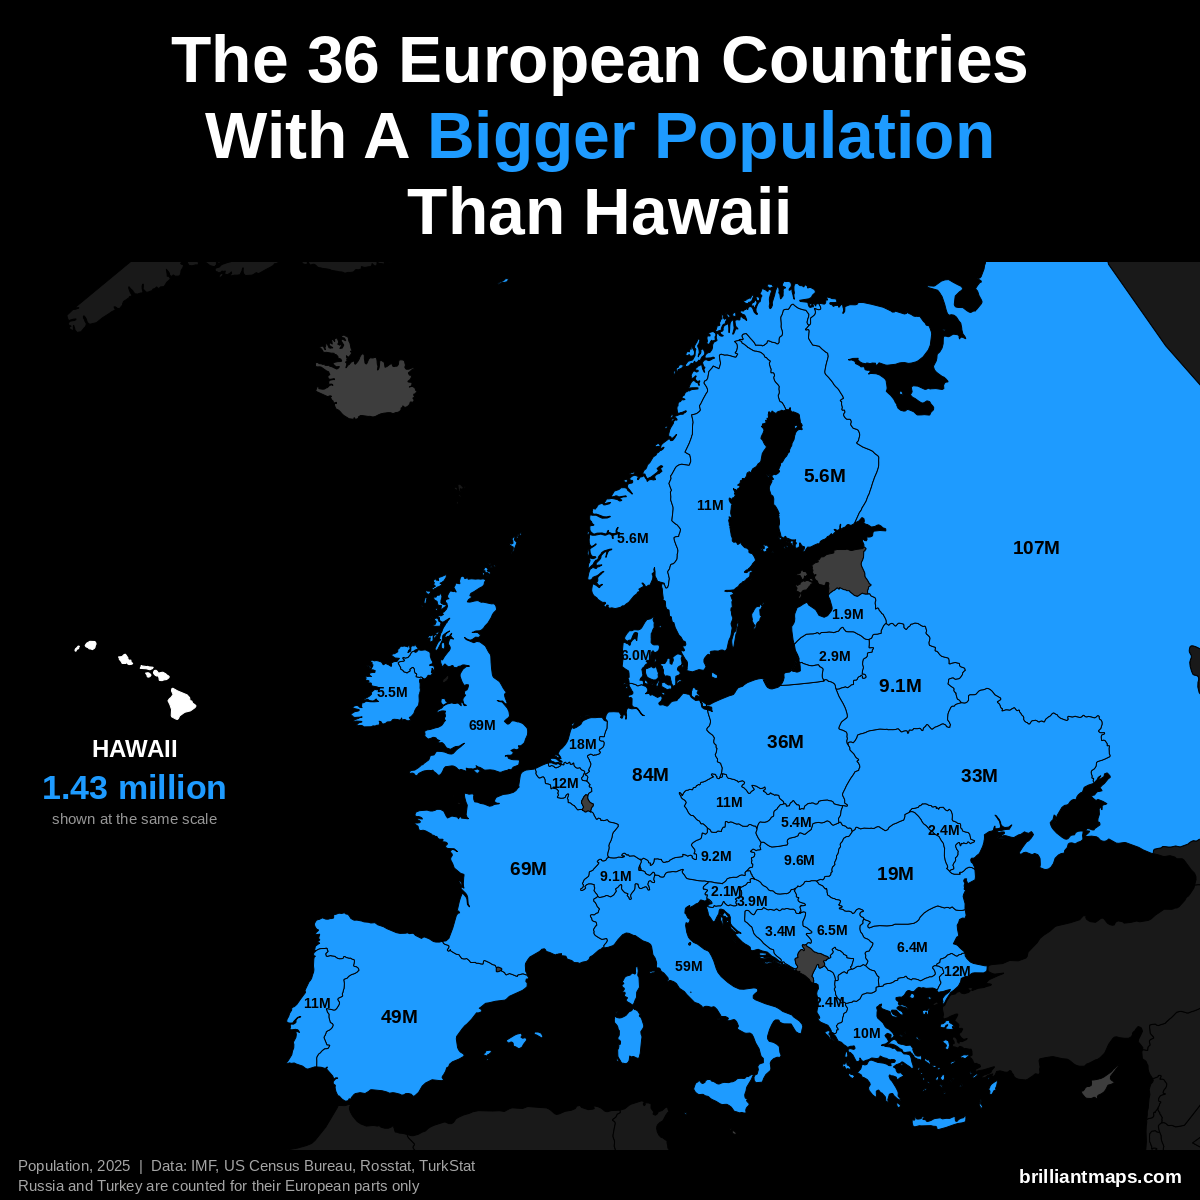
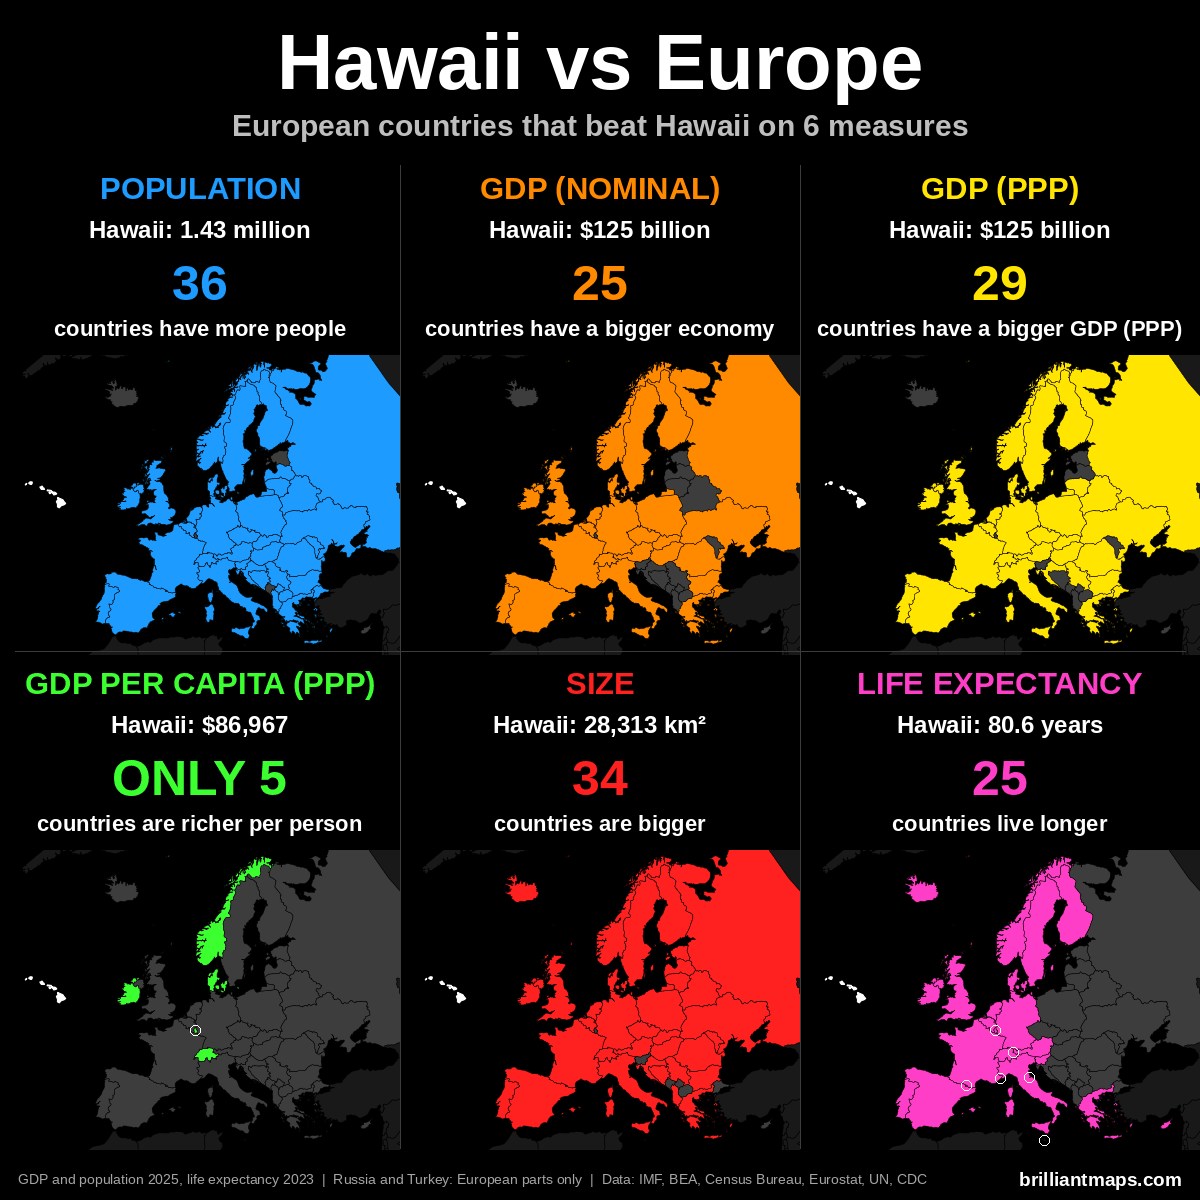
Hawaii has a population of 1.4 million (2025). 36 European countries have a bigger population:
- Russia (European part): 107.0 million
- Germany: 83.5 million
- United Kingdom: 69.5 million
- France: 68.9 million
- Italy: 58.9 million
- Spain: 49.5 million
- Poland: 36.5 million
- Ukraine: 32.9 million
- Romania: 19.0 million
- Netherlands: 18.0 million
- Turkey (European part): 12.2 million
- Belgium: 11.9 million
- Portugal: 10.8 million
- Czechia: 10.8 million
- Sweden: 10.7 million
- Greece: 10.4 million
- Hungary: 9.6 million
- Austria: 9.2 million
- Belarus: 9.1 million
- Switzerland: 9.1 million
- Serbia: 6.5 million
- Bulgaria: 6.4 million
- Denmark: 6.0 million
- Norway: 5.6 million
- Finland: 5.6 million
- Ireland: 5.5 million
- Slovakia: 5.4 million
- Croatia: 3.9 million
- Bosnia and Herzegovina: 3.4 million
- Lithuania: 2.9 million
- Moldova: 2.4 million
- Albania: 2.4 million
- Slovenia: 2.1 million
- Latvia: 1.9 million
- North Macedonia: 1.8 million
- Kosovo: 1.6 million
Hawaii Vs European GDP (Nominal)
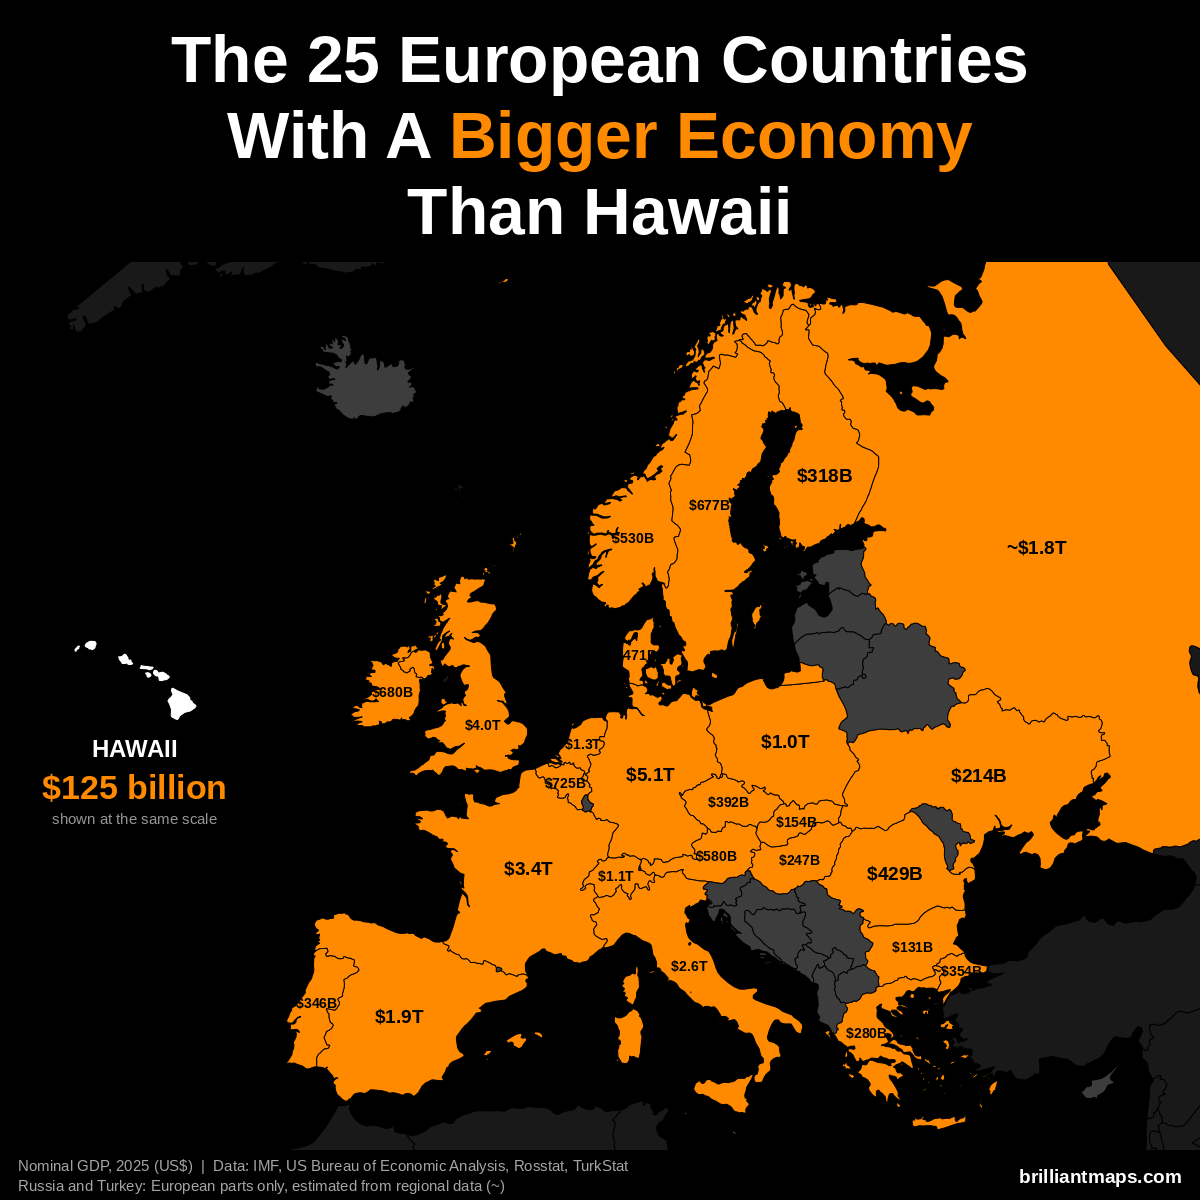
Hawaii has a nominal GDP of $125 billion (2025). 25 European countries have a bigger economy:
- Germany: $5.12 trillion
- United Kingdom: $4.01 trillion
- France: $3.38 trillion
- Italy: $2.55 trillion
- Spain: $1.91 trillion
- Russia (European part): ~$1.83 trillion
- Netherlands: $1.32 trillion
- Switzerland: $1.06 trillion
- Poland: $1.04 trillion
- Belgium: $725 billion
- Ireland: $680 billion
- Sweden: $677 billion
- Austria: $580 billion
- Norway: $530 billion
- Denmark: $471 billion
- Romania: $429 billion
- Czechia: $392 billion
- Turkey (European part): ~$354 billion
- Portugal: $346 billion
- Finland: $318 billion
- Greece: $280 billion
- Hungary: $247 billion
- Ukraine: $214 billion
- Slovakia: $154 billion
- Bulgaria: $131 billion
Hawaii Vs European GDP (PPP)
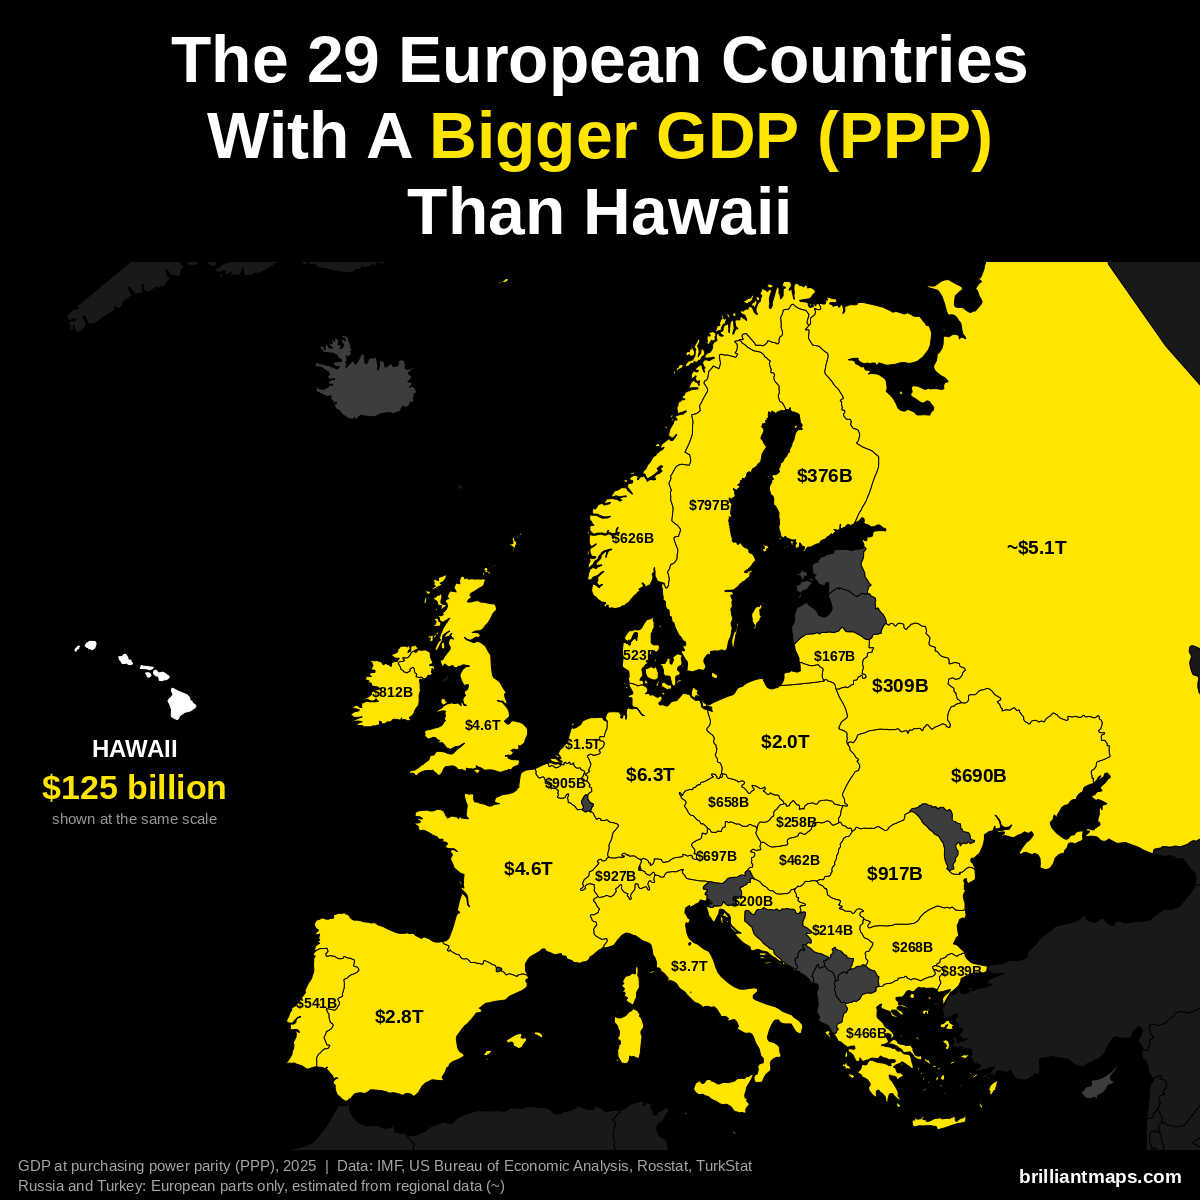
Hawaii has a GDP of $125 billion (2025). US states are already measured in the dollars PPP is based on, so the figure is the same as nominal GDP. 29 European countries have a bigger GDP at purchasing power parity:
- Germany: $6.26 trillion
- Russia (European part): ~$5.14 trillion
- France: $4.58 trillion
- United Kingdom: $4.57 trillion
- Italy: $3.74 trillion
- Spain: $2.83 trillion
- Poland: $2.04 trillion
- Netherlands: $1.52 trillion
- Switzerland: $927 billion
- Romania: $917 billion
- Belgium: $905 billion
- Turkey (European part): ~$839 billion
- Ireland: $812 billion
- Sweden: $797 billion
- Austria: $697 billion
- Ukraine: $690 billion
- Czechia: $658 billion
- Norway: $626 billion
- Portugal: $541 billion
- Denmark: $523 billion
- Greece: $466 billion
- Hungary: $462 billion
- Finland: $376 billion
- Belarus: $309 billion
- Bulgaria: $268 billion
- Slovakia: $258 billion
- Serbia: $214 billion
- Croatia: $200 billion
- Lithuania: $167 billion
Hawaii Vs European GDP Per Capita (PPP)
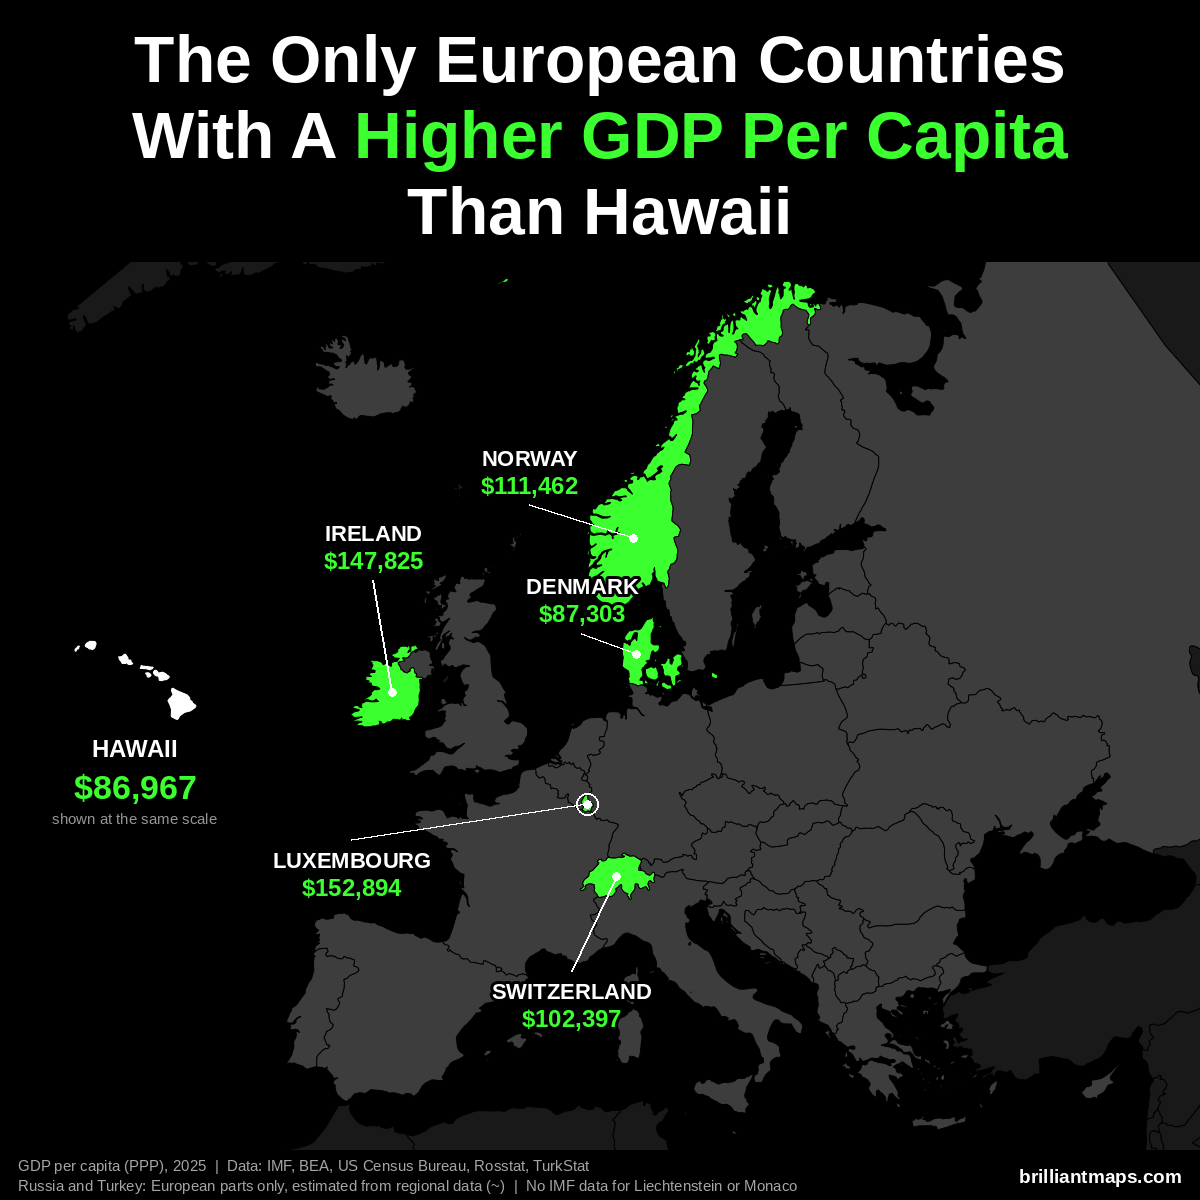
Hawaii has a GDP per capita of $86,967 (2025). Only 5 European countries have a higher GDP per capita at purchasing power parity:
- Luxembourg: $152,894
- Ireland: $147,825
- Norway: $111,462
- Switzerland: $102,397
- Denmark: $87,303
Liechtenstein and Monaco are not covered by the IMF data and are not counted here.
Hawaii Vs European Size
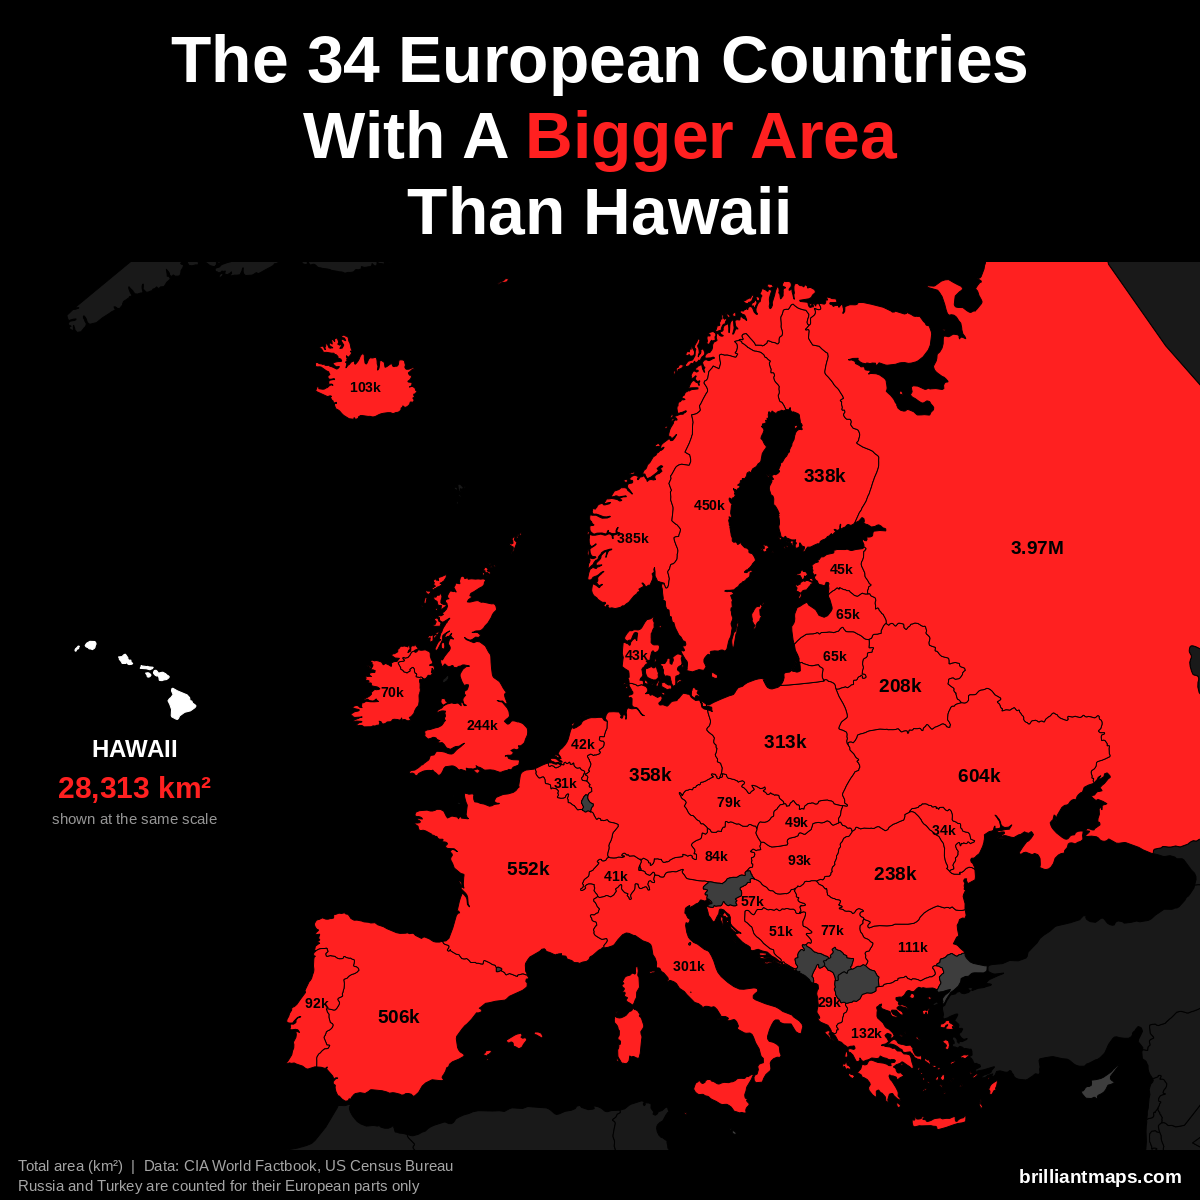
Hawaii has a total area of 28,313 km² (10,932 sq mi). 34 European countries have a bigger area:
- Russia (European part): 3,969,100 km² (1,532,477 sq mi)
- Ukraine: 603,550 km² (233,032 sq mi)
- France: 551,695 km² (213,010 sq mi)
- Spain: 505,990 km² (195,364 sq mi)
- Sweden: 450,295 km² (173,860 sq mi)
- Norway: 385,207 km² (148,729 sq mi)
- Germany: 357,588 km² (138,065 sq mi)
- Finland: 338,455 km² (130,678 sq mi)
- Poland: 312,696 km² (120,733 sq mi)
- Italy: 301,340 km² (116,348 sq mi)
- United Kingdom: 243,610 km² (94,058 sq mi)
- Romania: 238,397 km² (92,046 sq mi)
- Belarus: 207,600 km² (80,155 sq mi)
- Greece: 131,957 km² (50,949 sq mi)
- Bulgaria: 110,994 km² (42,855 sq mi)
- Iceland: 103,000 km² (39,768 sq mi)
- Hungary: 93,028 km² (35,918 sq mi)
- Portugal: 92,212 km² (35,603 sq mi)
- Austria: 83,871 km² (32,383 sq mi)
- Czechia: 78,867 km² (30,451 sq mi)
- Serbia: 77,474 km² (29,913 sq mi)
- Ireland: 70,273 km² (27,133 sq mi)
- Lithuania: 65,300 km² (25,212 sq mi)
- Latvia: 64,589 km² (24,938 sq mi)
- Croatia: 56,594 km² (21,851 sq mi)
- Bosnia and Herzegovina: 51,197 km² (19,767 sq mi)
- Slovakia: 49,035 km² (18,933 sq mi)
- Estonia: 45,339 km² (17,505 sq mi)
- Denmark: 43,094 km² (16,639 sq mi)
- Netherlands: 41,850 km² (16,158 sq mi)
- Switzerland: 41,285 km² (15,940 sq mi)
- Moldova: 33,846 km² (13,068 sq mi)
- Belgium: 30,528 km² (11,787 sq mi)
- Albania: 28,748 km² (11,100 sq mi)
Hawaii Vs European Life Expectancy
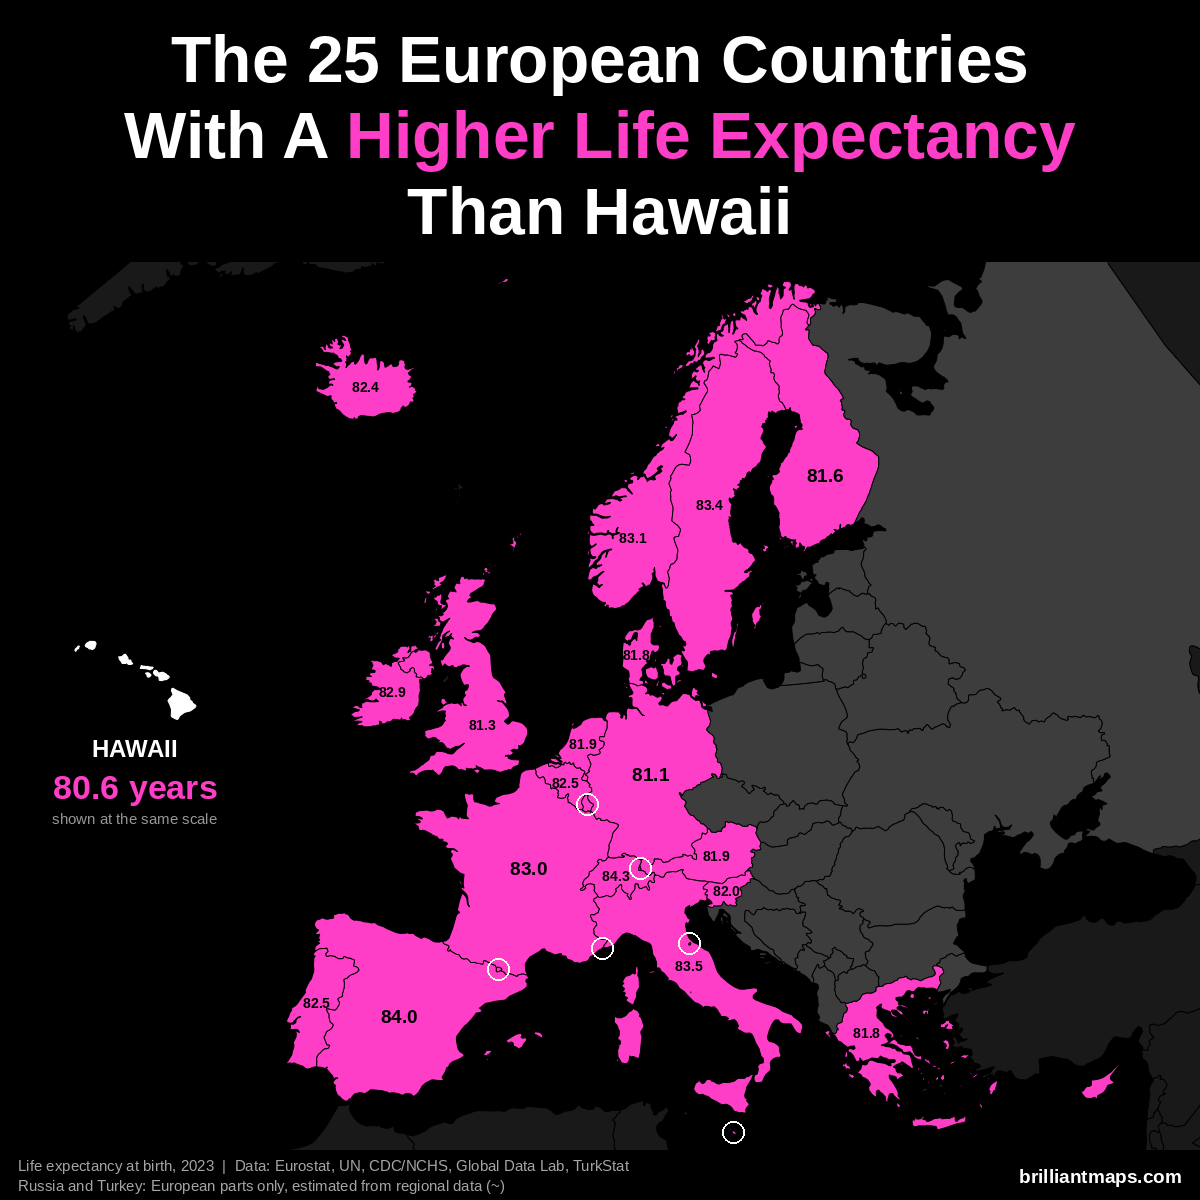
Hawaii has a life expectancy at birth of 80.6 years (2023). 25 European countries have a higher life expectancy:
- Monaco: 86.4 years
- San Marino: 85.7 years
- Liechtenstein: 84.6 years
- Switzerland: 84.3 years
- Andorra: 84.0 years
- Spain: 84.0 years
- Italy: 83.5 years
- Luxembourg: 83.4 years
- Malta: 83.4 years
- Sweden: 83.4 years
- Norway: 83.1 years
- France: 83.0 years
- Cyprus: 82.9 years
- Ireland: 82.9 years
- Belgium: 82.5 years
- Portugal: 82.5 years
- Iceland: 82.4 years
- Slovenia: 82.0 years
- Austria: 81.9 years
- Netherlands: 81.9 years
- Denmark: 81.8 years
- Greece: 81.8 years
- Finland: 81.6 years
- United Kingdom: 81.3 years
- Germany: 81.1 years
Idaho vs Europe
Idaho Vs European Population
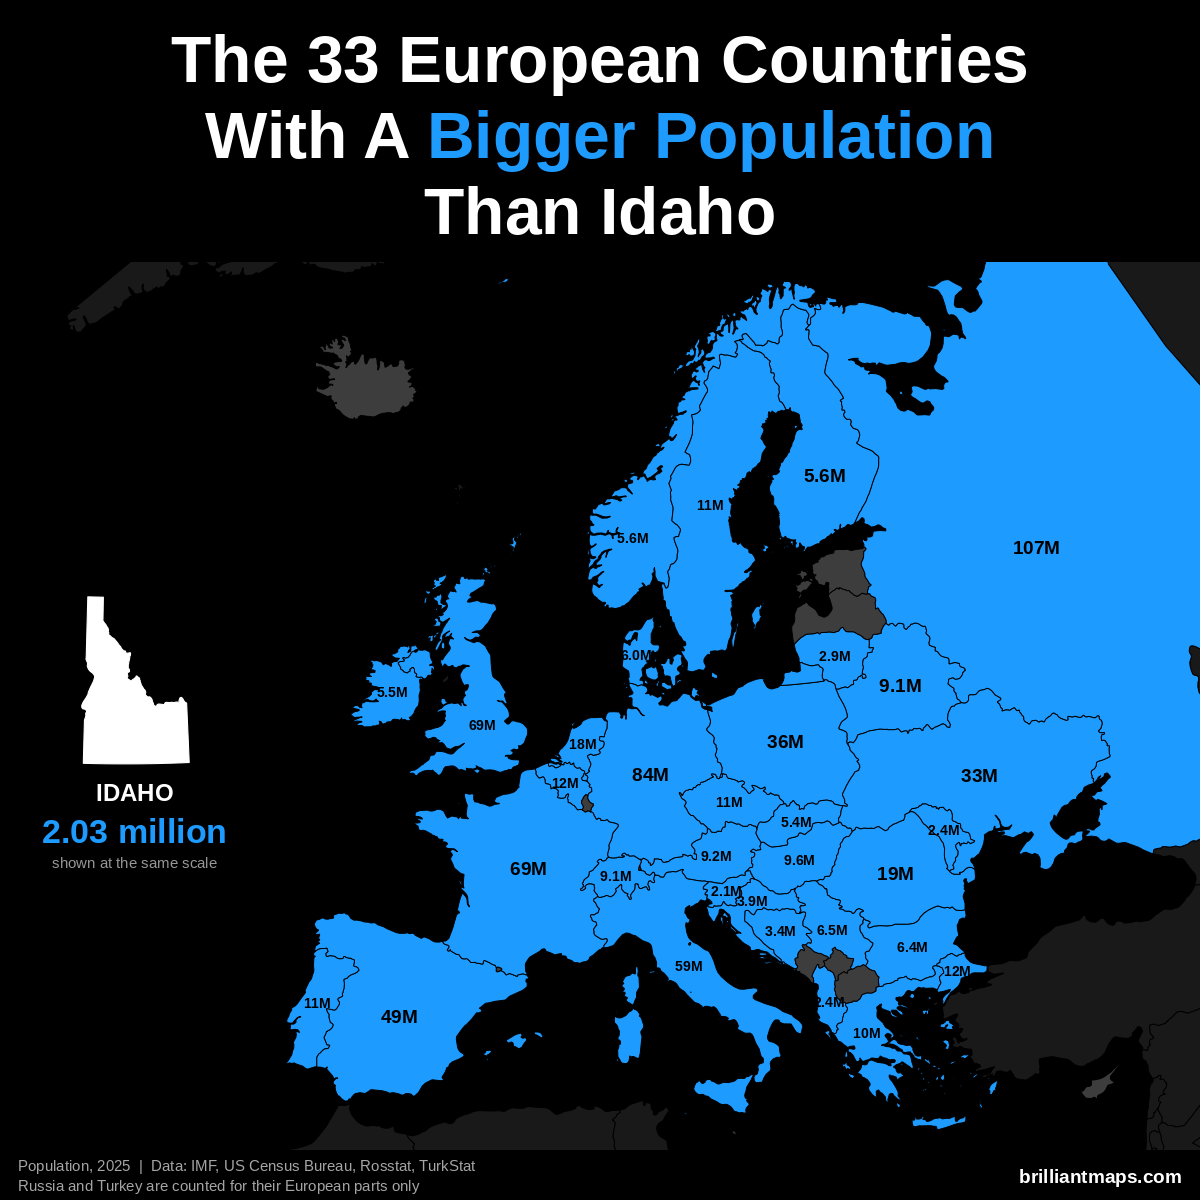
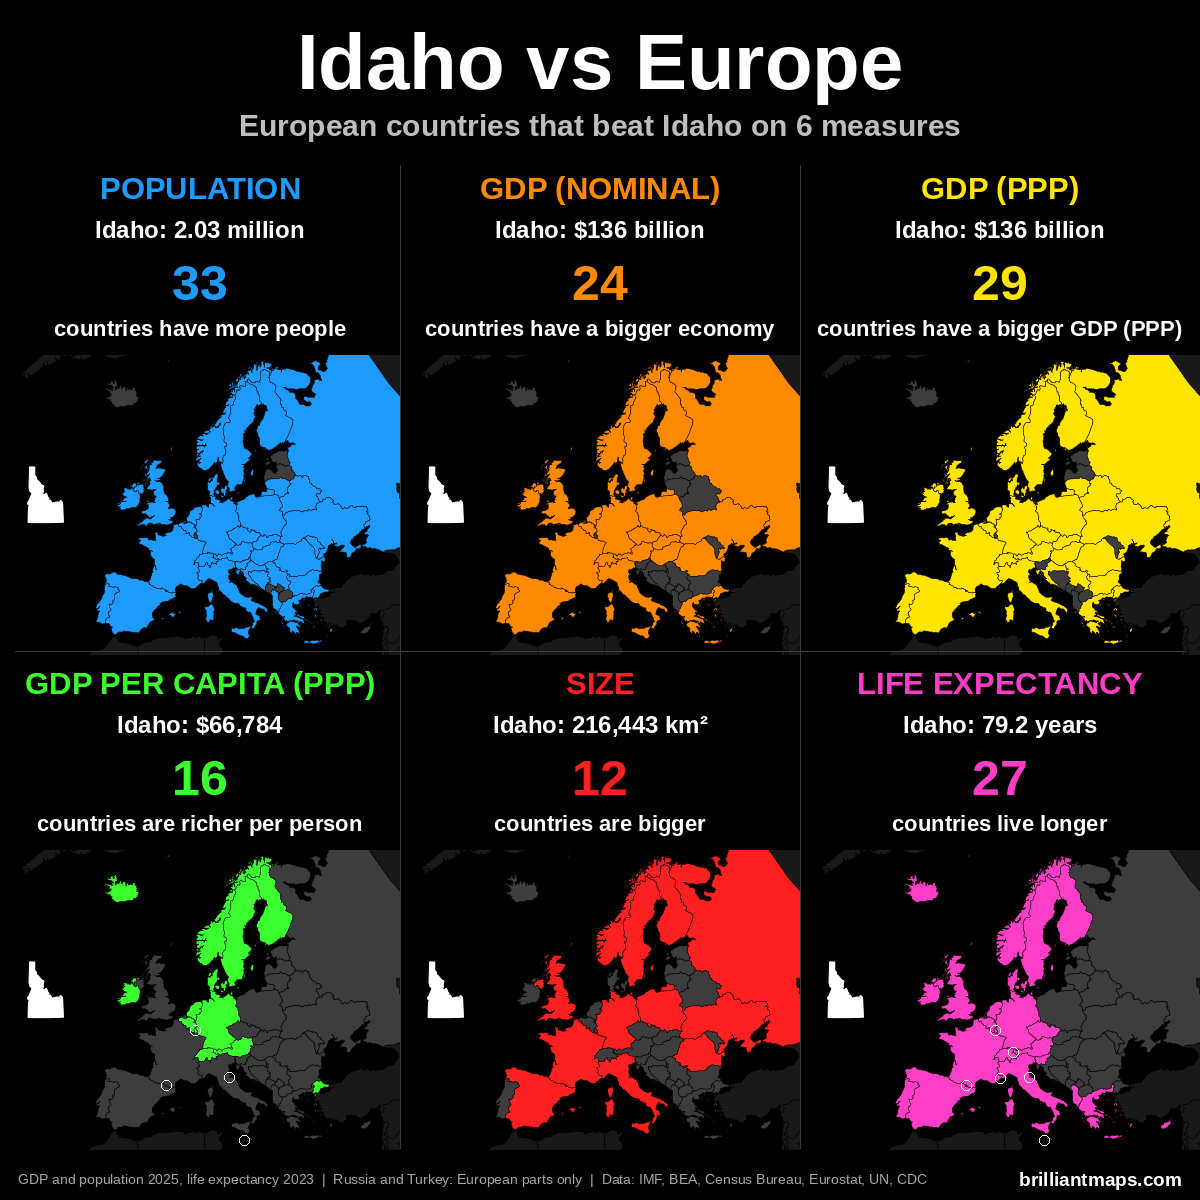
Idaho has a population of 2.0 million (2025). 33 European countries have a bigger population:
- Russia (European part): 107.0 million
- Germany: 83.5 million
- United Kingdom: 69.5 million
- France: 68.9 million
- Italy: 58.9 million
- Spain: 49.5 million
- Poland: 36.5 million
- Ukraine: 32.9 million
- Romania: 19.0 million
- Netherlands: 18.0 million
- Turkey (European part): 12.2 million
- Belgium: 11.9 million
- Portugal: 10.8 million
- Czechia: 10.8 million
- Sweden: 10.7 million
- Greece: 10.4 million
- Hungary: 9.6 million
- Austria: 9.2 million
- Belarus: 9.1 million
- Switzerland: 9.1 million
- Serbia: 6.5 million
- Bulgaria: 6.4 million
- Denmark: 6.0 million
- Norway: 5.6 million
- Finland: 5.6 million
- Ireland: 5.5 million
- Slovakia: 5.4 million
- Croatia: 3.9 million
- Bosnia and Herzegovina: 3.4 million
- Lithuania: 2.9 million
- Moldova: 2.4 million
- Albania: 2.4 million
- Slovenia: 2.1 million
Idaho Vs European GDP (Nominal)
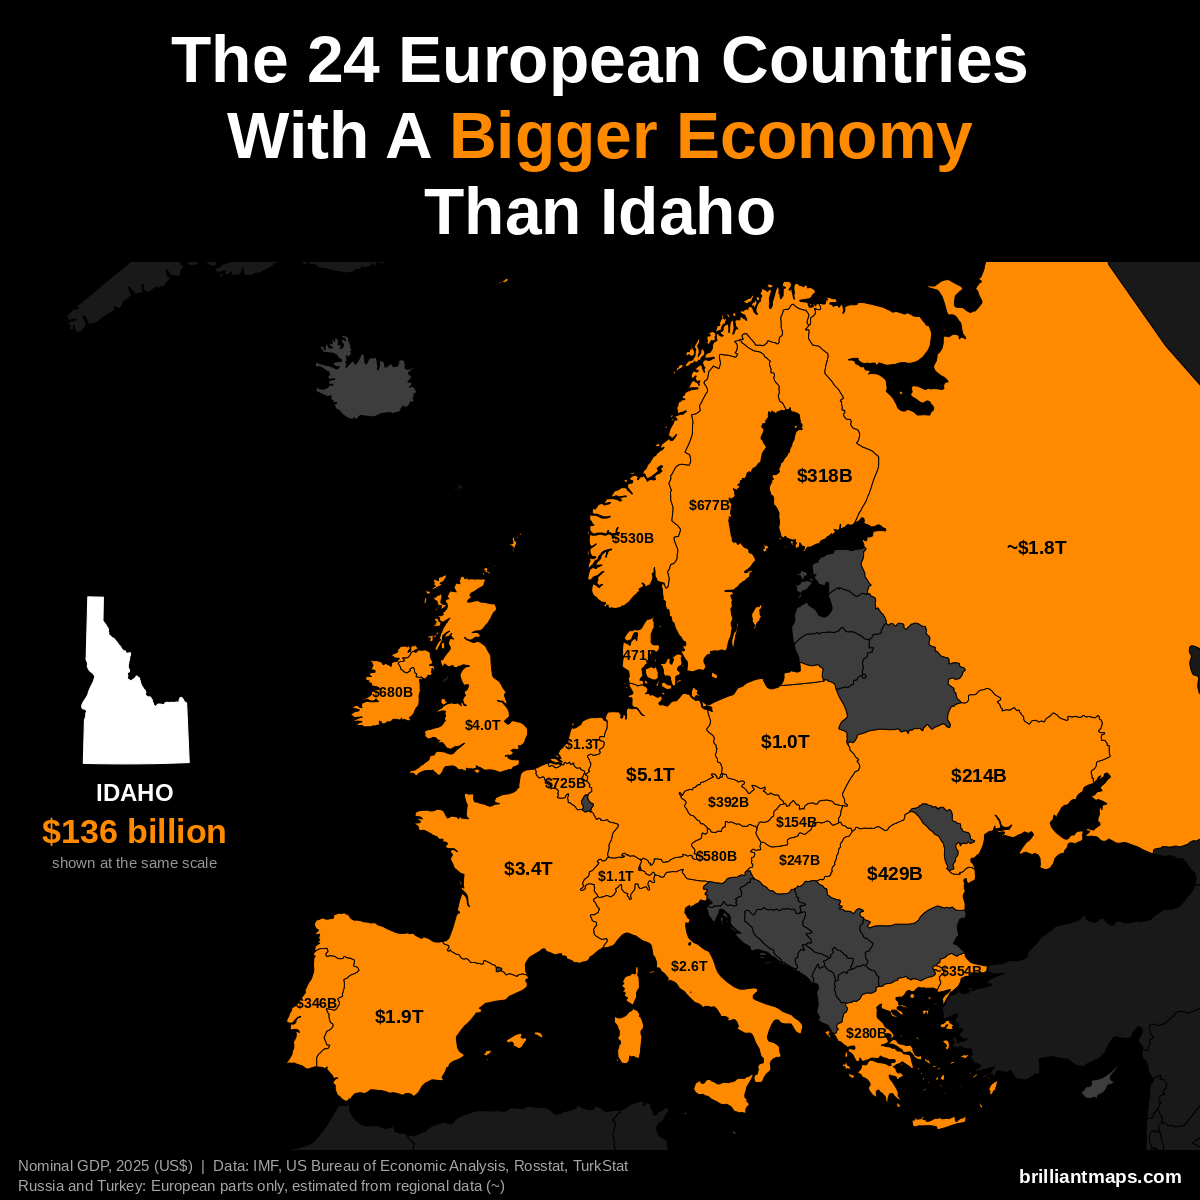
Idaho has a nominal GDP of $136 billion (2025). 24 European countries have a bigger economy:
- Germany: $5.12 trillion
- United Kingdom: $4.01 trillion
- France: $3.38 trillion
- Italy: $2.55 trillion
- Spain: $1.91 trillion
- Russia (European part): ~$1.83 trillion
- Netherlands: $1.32 trillion
- Switzerland: $1.06 trillion
- Poland: $1.04 trillion
- Belgium: $725 billion
- Ireland: $680 billion
- Sweden: $677 billion
- Austria: $580 billion
- Norway: $530 billion
- Denmark: $471 billion
- Romania: $429 billion
- Czechia: $392 billion
- Turkey (European part): ~$354 billion
- Portugal: $346 billion
- Finland: $318 billion
- Greece: $280 billion
- Hungary: $247 billion
- Ukraine: $214 billion
- Slovakia: $154 billion
Idaho Vs European GDP (PPP)
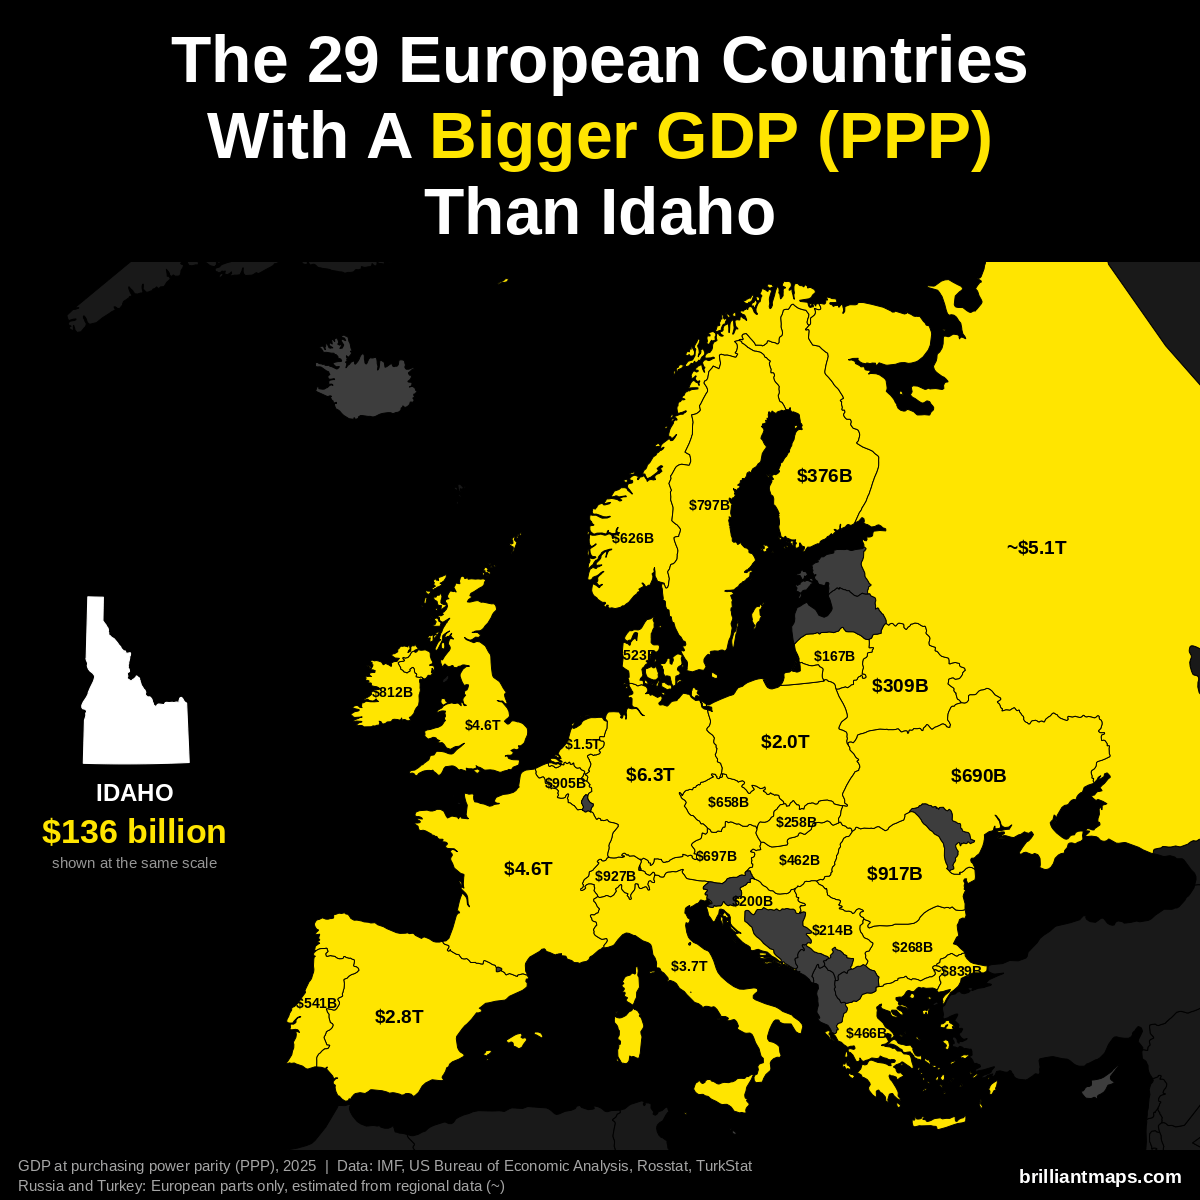
Idaho has a GDP of $136 billion (2025). US states are already measured in the dollars PPP is based on, so the figure is the same as nominal GDP. 29 European countries have a bigger GDP at purchasing power parity:
- Germany: $6.26 trillion
- Russia (European part): ~$5.14 trillion
- France: $4.58 trillion
- United Kingdom: $4.57 trillion
- Italy: $3.74 trillion
- Spain: $2.83 trillion
- Poland: $2.04 trillion
- Netherlands: $1.52 trillion
- Switzerland: $927 billion
- Romania: $917 billion
- Belgium: $905 billion
- Turkey (European part): ~$839 billion
- Ireland: $812 billion
- Sweden: $797 billion
- Austria: $697 billion
- Ukraine: $690 billion
- Czechia: $658 billion
- Norway: $626 billion
- Portugal: $541 billion
- Denmark: $523 billion
- Greece: $466 billion
- Hungary: $462 billion
- Finland: $376 billion
- Belarus: $309 billion
- Bulgaria: $268 billion
- Slovakia: $258 billion
- Serbia: $214 billion
- Croatia: $200 billion
- Lithuania: $167 billion
Idaho Vs European GDP Per Capita (PPP)
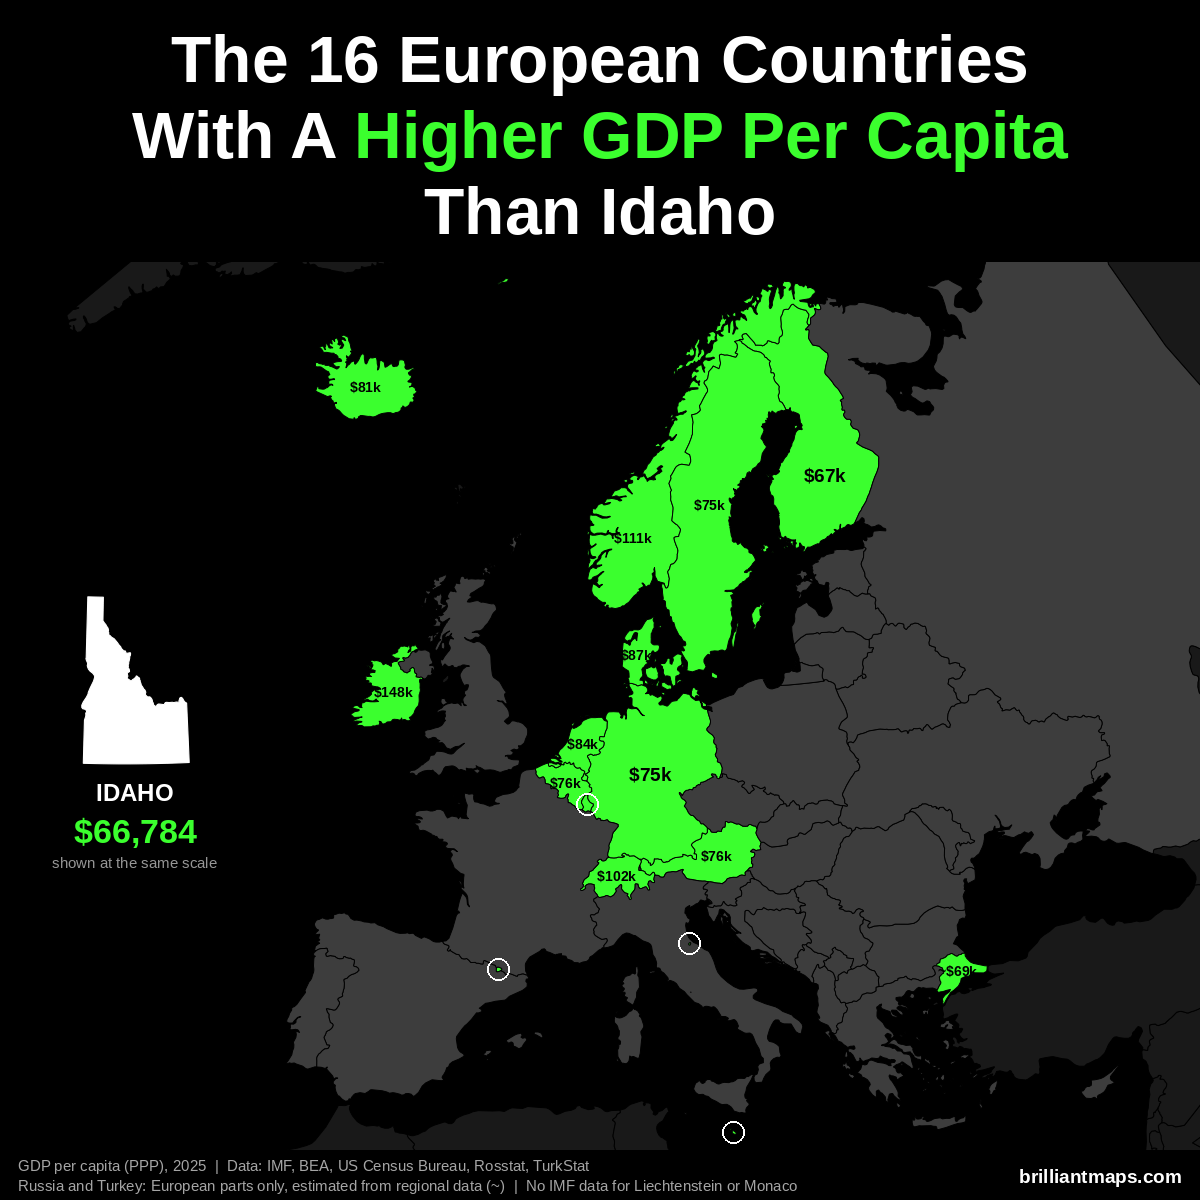
Idaho has a GDP per capita of $66,784 (2025). 16 European countries have a higher GDP per capita at purchasing power parity:
- Luxembourg: $152,894
- Ireland: $147,825
- Norway: $111,462
- Switzerland: $102,397
- Denmark: $87,303
- Netherlands: $84,445
- San Marino: $83,838
- Iceland: $80,915
- Belgium: $76,136
- Austria: $75,965
- Malta: $75,687
- Germany: $74,901
- Sweden: $74,651
- Andorra: $74,059
- Turkey (European part): ~$68,800
- Finland: $67,097
Liechtenstein and Monaco are not covered by the IMF data and are not counted here.
Idaho Vs European Size
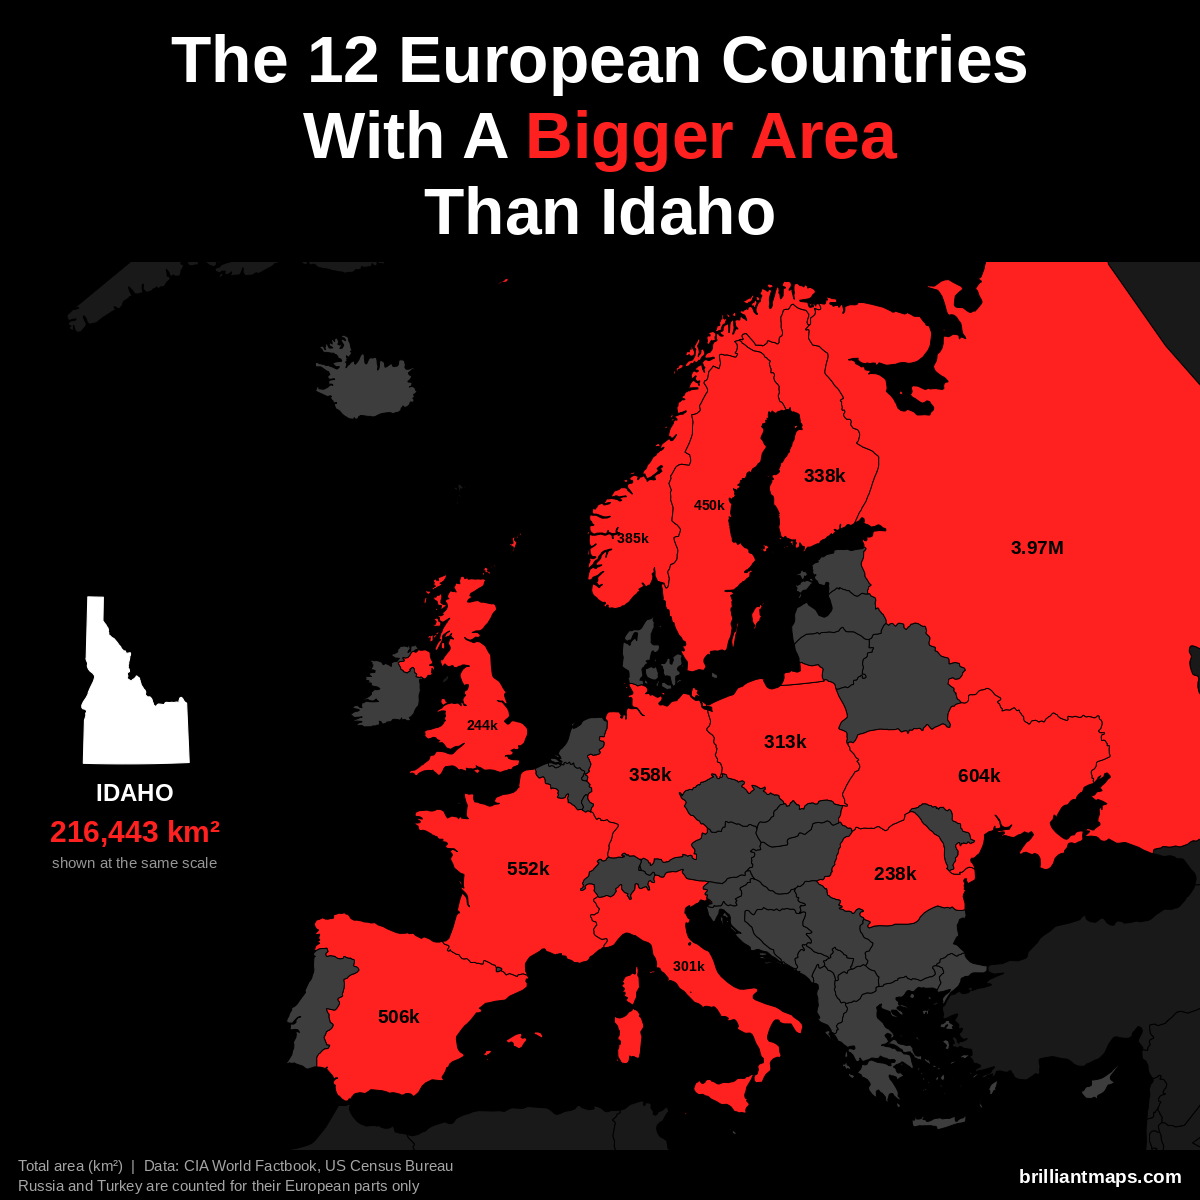
Idaho has a total area of 216,443 km² (83,569 sq mi). 12 European countries have a bigger area:
- Russia (European part): 3,969,100 km² (1,532,477 sq mi)
- Ukraine: 603,550 km² (233,032 sq mi)
- France: 551,695 km² (213,010 sq mi)
- Spain: 505,990 km² (195,364 sq mi)
- Sweden: 450,295 km² (173,860 sq mi)
- Norway: 385,207 km² (148,729 sq mi)
- Germany: 357,588 km² (138,065 sq mi)
- Finland: 338,455 km² (130,678 sq mi)
- Poland: 312,696 km² (120,733 sq mi)
- Italy: 301,340 km² (116,348 sq mi)
- United Kingdom: 243,610 km² (94,058 sq mi)
- Romania: 238,397 km² (92,046 sq mi)
Idaho Vs European Life Expectancy
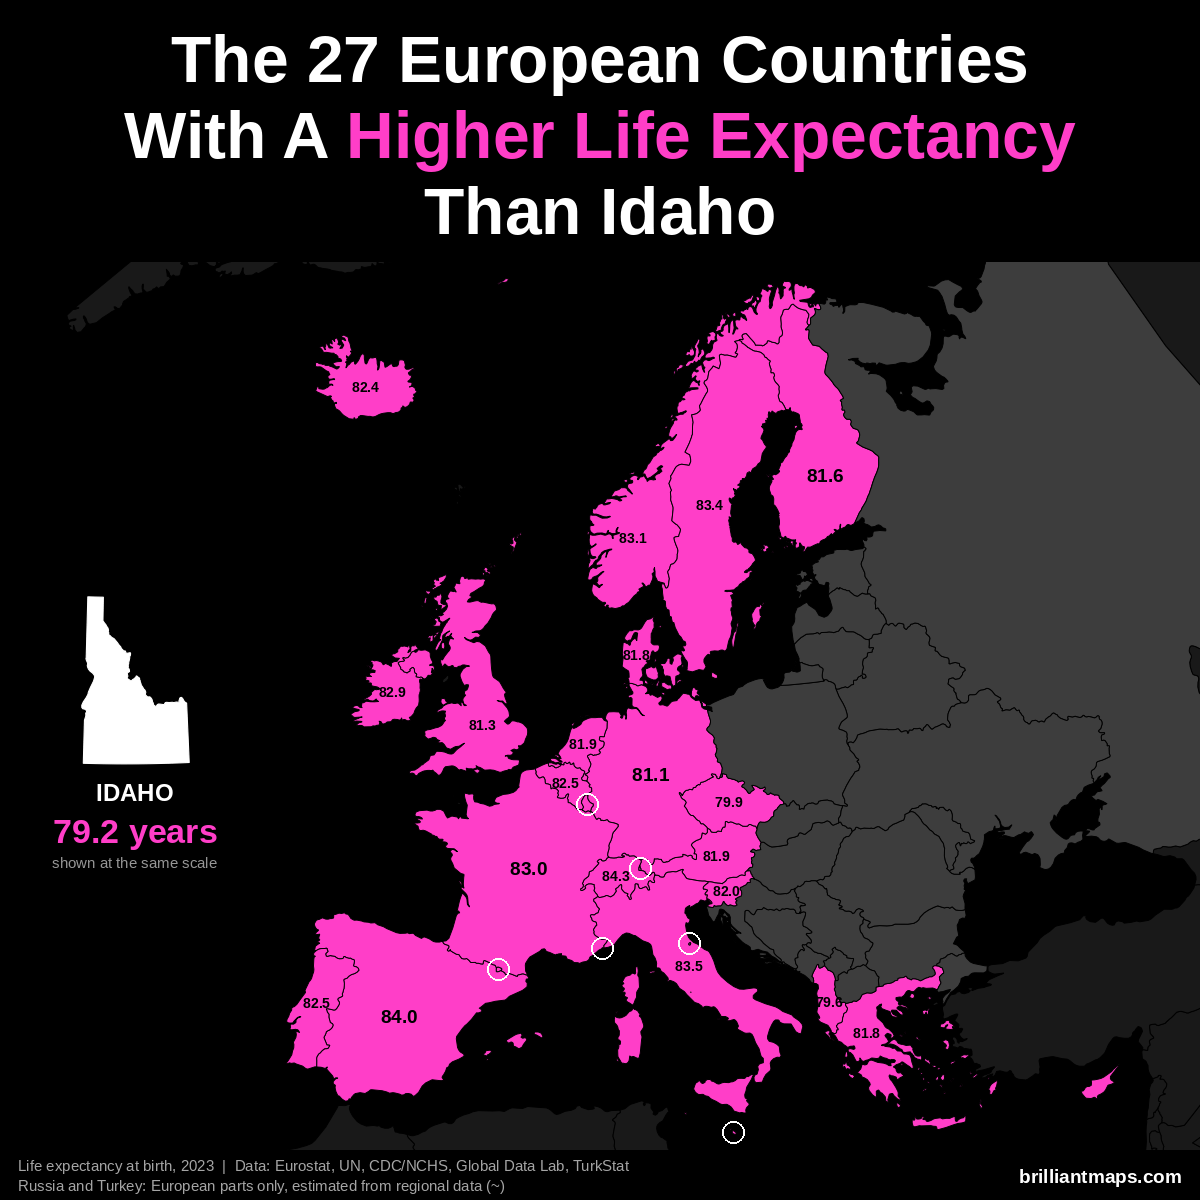
Idaho has a life expectancy at birth of 79.2 years (2023). 27 European countries have a higher life expectancy:
- Monaco: 86.4 years
- San Marino: 85.7 years
- Liechtenstein: 84.6 years
- Switzerland: 84.3 years
- Andorra: 84.0 years
- Spain: 84.0 years
- Italy: 83.5 years
- Luxembourg: 83.4 years
- Malta: 83.4 years
- Sweden: 83.4 years
- Norway: 83.1 years
- France: 83.0 years
- Cyprus: 82.9 years
- Ireland: 82.9 years
- Belgium: 82.5 years
- Portugal: 82.5 years
- Iceland: 82.4 years
- Slovenia: 82.0 years
- Austria: 81.9 years
- Netherlands: 81.9 years
- Denmark: 81.8 years
- Greece: 81.8 years
- Finland: 81.6 years
- United Kingdom: 81.3 years
- Germany: 81.1 years
- Czechia: 79.9 years
- Albania: 79.6 years
Illinois vs Europe
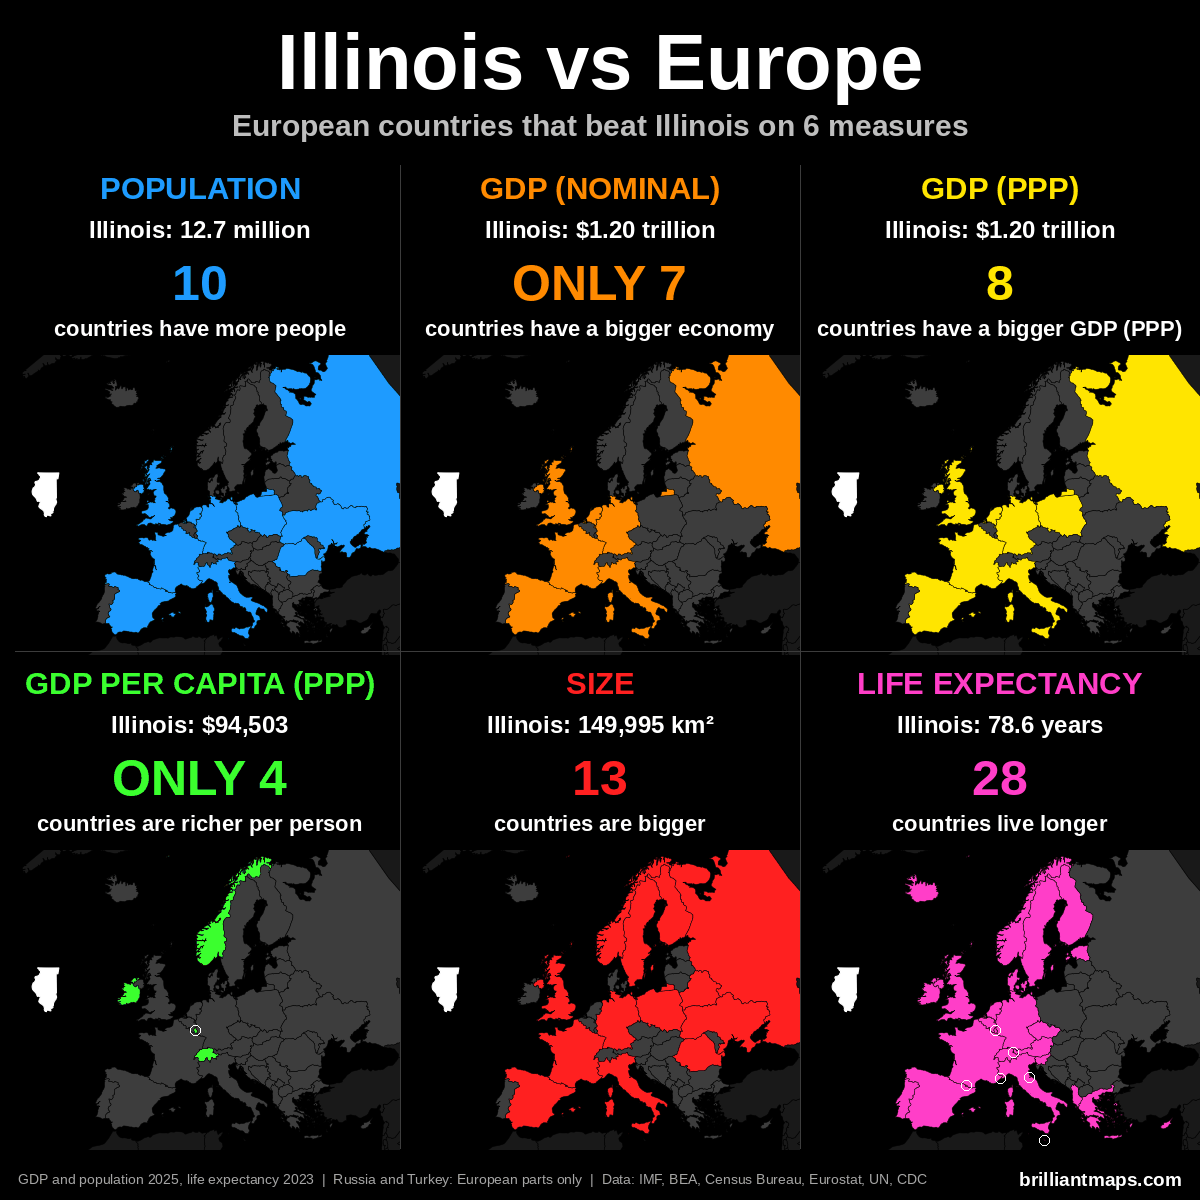
Illinois Vs European Population
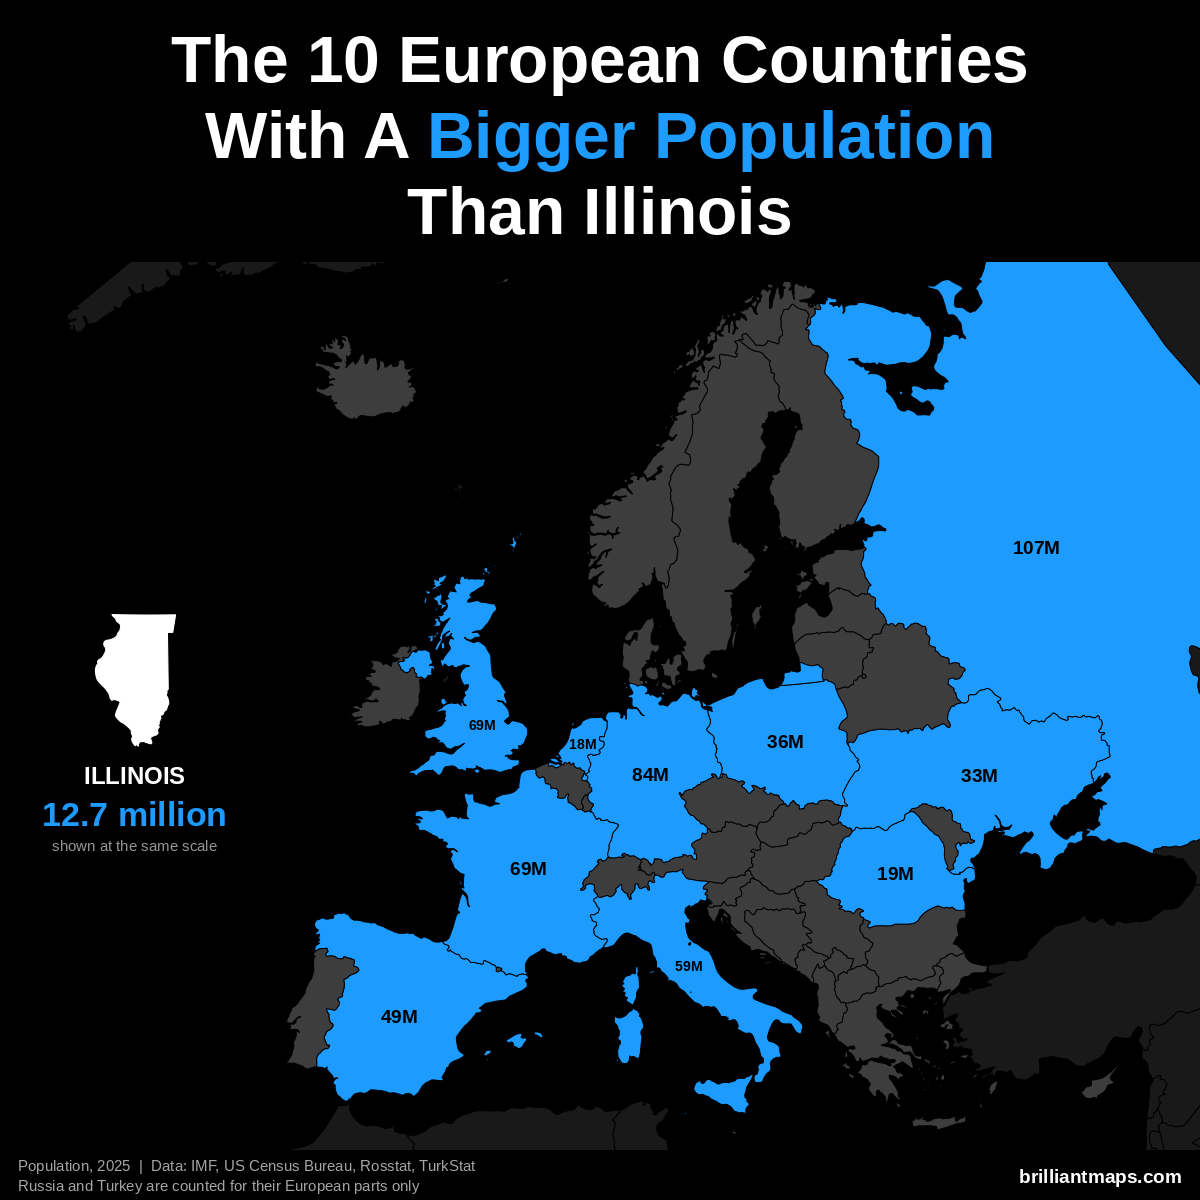
Illinois has a population of 12.7 million (2025). 10 European countries have a bigger population:
- Russia (European part): 107.0 million
- Germany: 83.5 million
- United Kingdom: 69.5 million
- France: 68.9 million
- Italy: 58.9 million
- Spain: 49.5 million
- Poland: 36.5 million
- Ukraine: 32.9 million
- Romania: 19.0 million
- Netherlands: 18.0 million
Illinois Vs European GDP (Nominal)
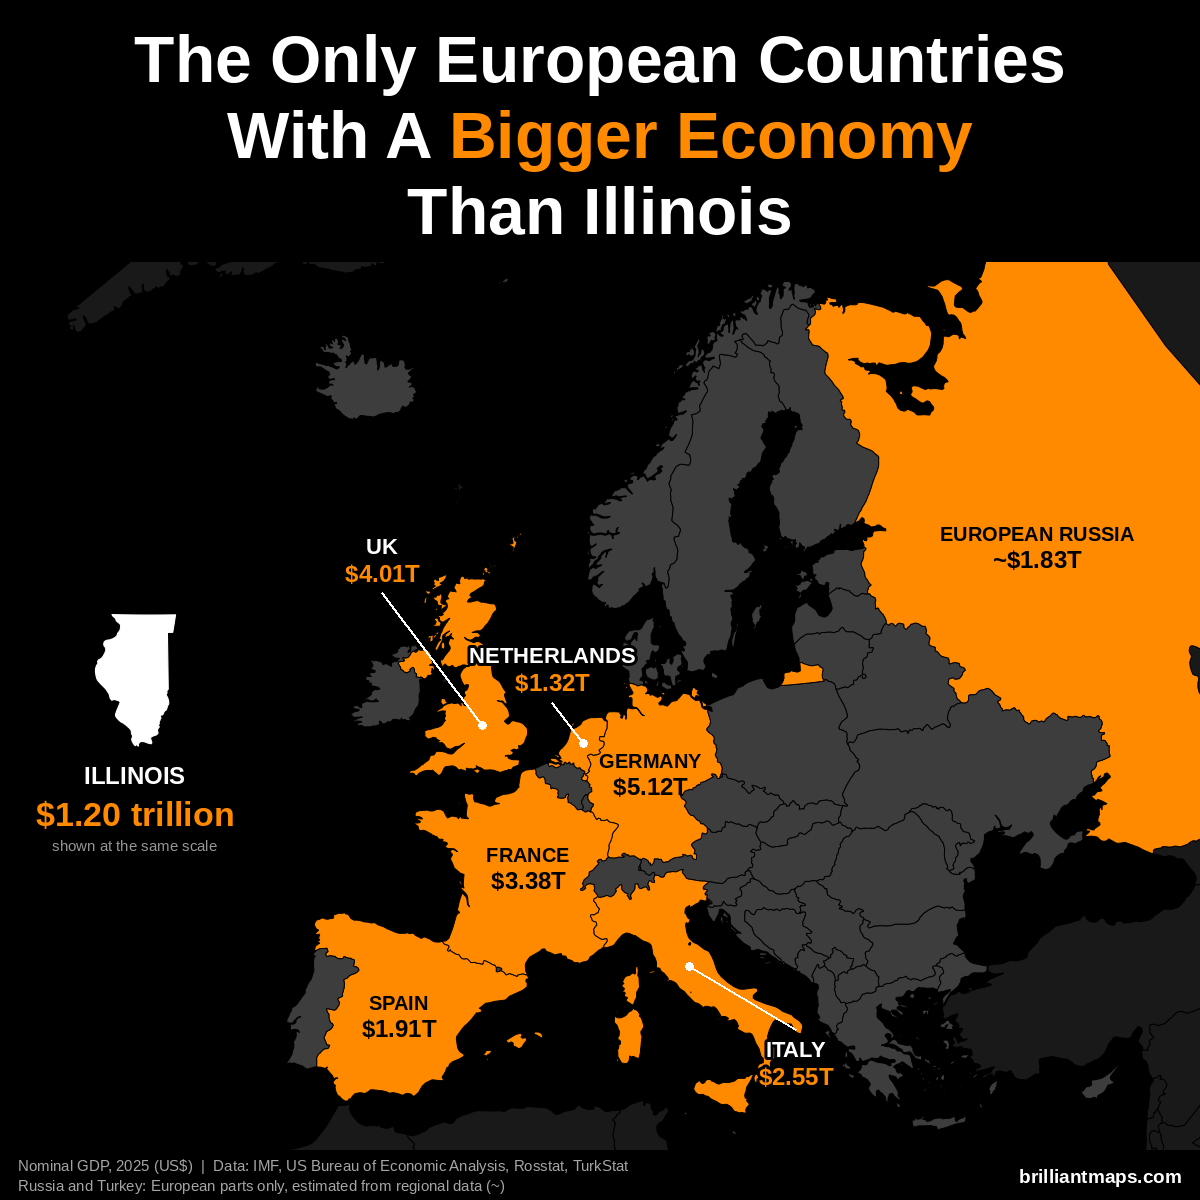
Illinois has a nominal GDP of $1.20 trillion (2025). Only 7 European countries have a bigger economy:
- Germany: $5.12 trillion
- United Kingdom: $4.01 trillion
- France: $3.38 trillion
- Italy: $2.55 trillion
- Spain: $1.91 trillion
- Russia (European part): ~$1.83 trillion
- Netherlands: $1.32 trillion
Illinois Vs European GDP (PPP)
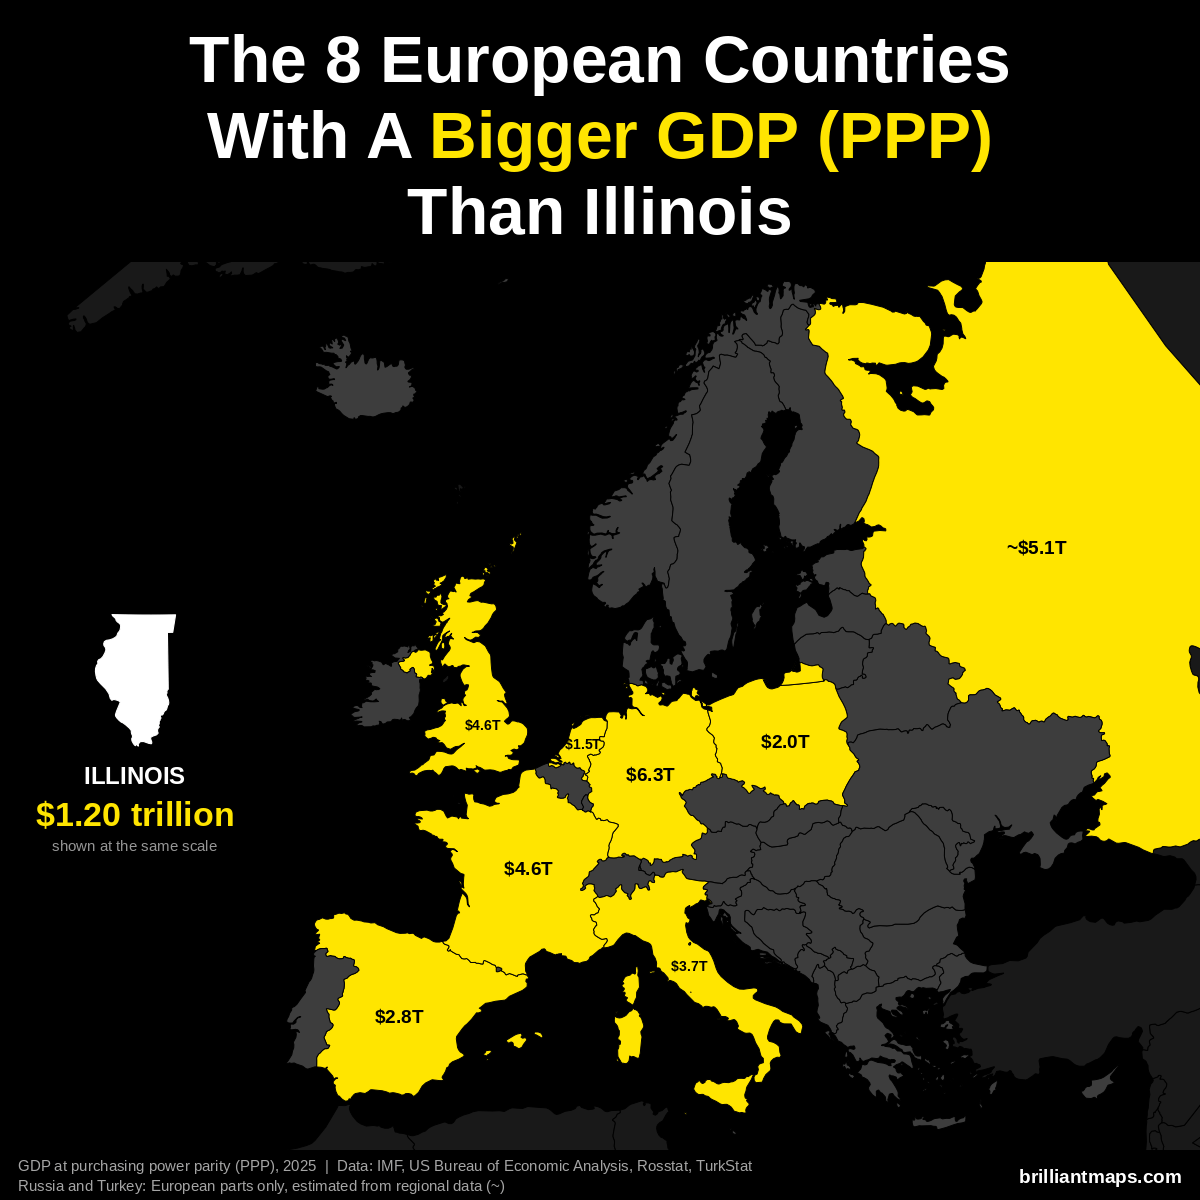
Illinois has a GDP of $1.20 trillion (2025). US states are already measured in the dollars PPP is based on, so the figure is the same as nominal GDP. 8 European countries have a bigger GDP at purchasing power parity:
- Germany: $6.26 trillion
- Russia (European part): ~$5.14 trillion
- France: $4.58 trillion
- United Kingdom: $4.57 trillion
- Italy: $3.74 trillion
- Spain: $2.83 trillion
- Poland: $2.04 trillion
- Netherlands: $1.52 trillion
Illinois Vs European GDP Per Capita (PPP)
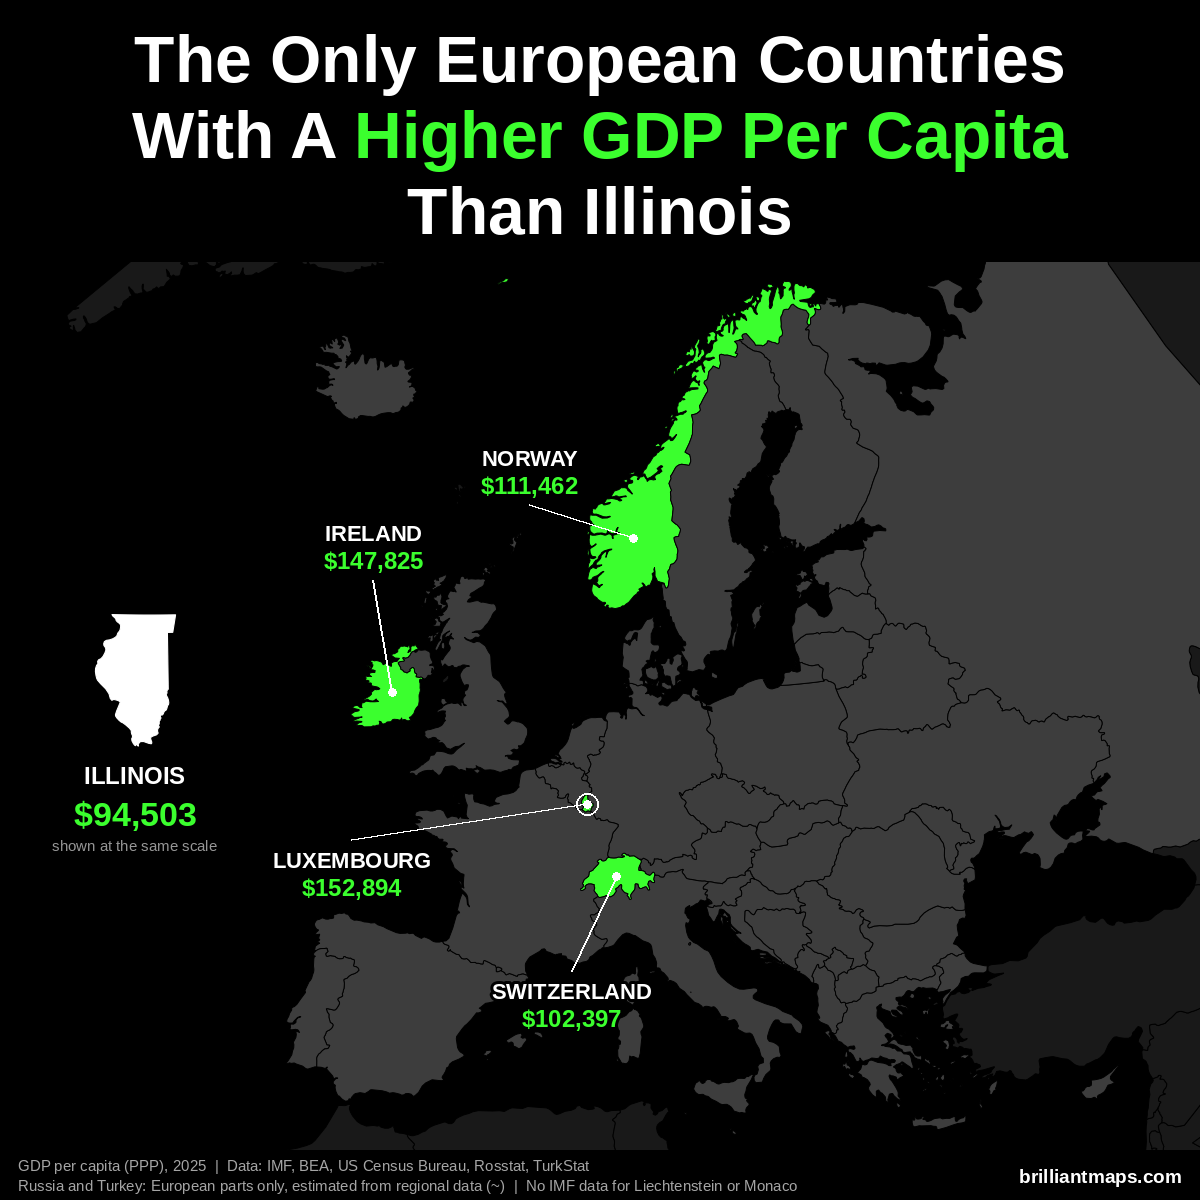
Illinois has a GDP per capita of $94,503 (2025). Only 4 European countries have a higher GDP per capita at purchasing power parity:
- Luxembourg: $152,894
- Ireland: $147,825
- Norway: $111,462
- Switzerland: $102,397
Liechtenstein and Monaco are not covered by the IMF data and are not counted here.
Illinois Vs European Size
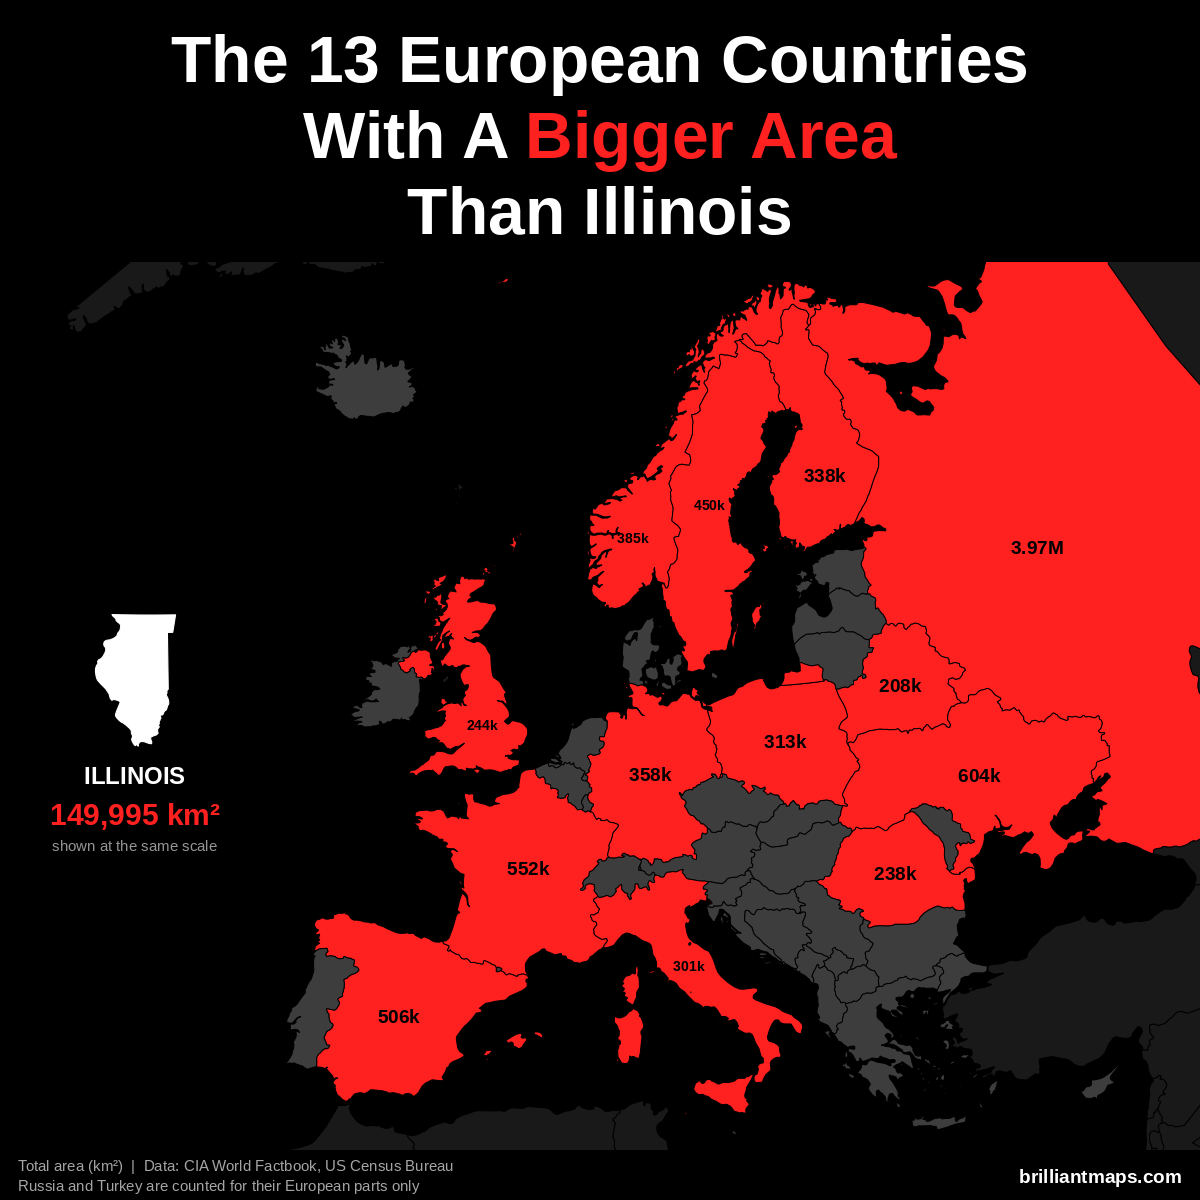
Illinois has a total area of 149,995 km² (57,913 sq mi). 13 European countries have a bigger area:
- Russia (European part): 3,969,100 km² (1,532,477 sq mi)
- Ukraine: 603,550 km² (233,032 sq mi)
- France: 551,695 km² (213,010 sq mi)
- Spain: 505,990 km² (195,364 sq mi)
- Sweden: 450,295 km² (173,860 sq mi)
- Norway: 385,207 km² (148,729 sq mi)
- Germany: 357,588 km² (138,065 sq mi)
- Finland: 338,455 km² (130,678 sq mi)
- Poland: 312,696 km² (120,733 sq mi)
- Italy: 301,340 km² (116,348 sq mi)
- United Kingdom: 243,610 km² (94,058 sq mi)
- Romania: 238,397 km² (92,046 sq mi)
- Belarus: 207,600 km² (80,155 sq mi)
Illinois Vs European Life Expectancy
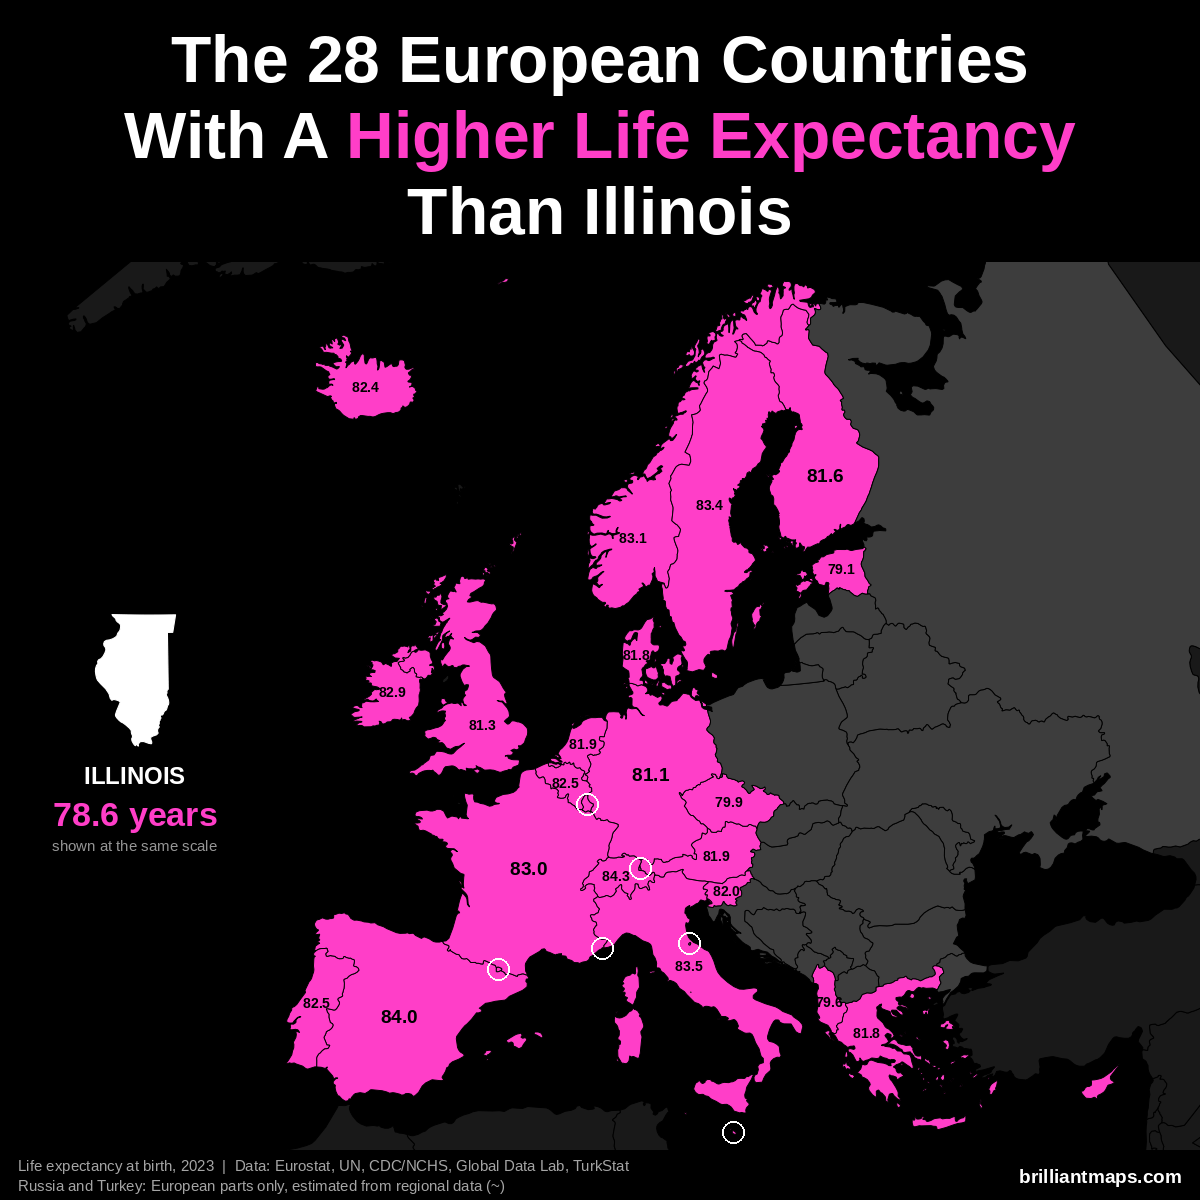
Illinois has a life expectancy at birth of 78.6 years (2023). 28 European countries have a higher life expectancy:
- Monaco: 86.4 years
- San Marino: 85.7 years
- Liechtenstein: 84.6 years
- Switzerland: 84.3 years
- Andorra: 84.0 years
- Spain: 84.0 years
- Italy: 83.5 years
- Luxembourg: 83.4 years
- Malta: 83.4 years
- Sweden: 83.4 years
- Norway: 83.1 years
- France: 83.0 years
- Cyprus: 82.9 years
- Ireland: 82.9 years
- Belgium: 82.5 years
- Portugal: 82.5 years
- Iceland: 82.4 years
- Slovenia: 82.0 years
- Austria: 81.9 years
- Netherlands: 81.9 years
- Denmark: 81.8 years
- Greece: 81.8 years
- Finland: 81.6 years
- United Kingdom: 81.3 years
- Germany: 81.1 years
- Czechia: 79.9 years
- Albania: 79.6 years
- Estonia: 79.1 years
Indiana vs Europe
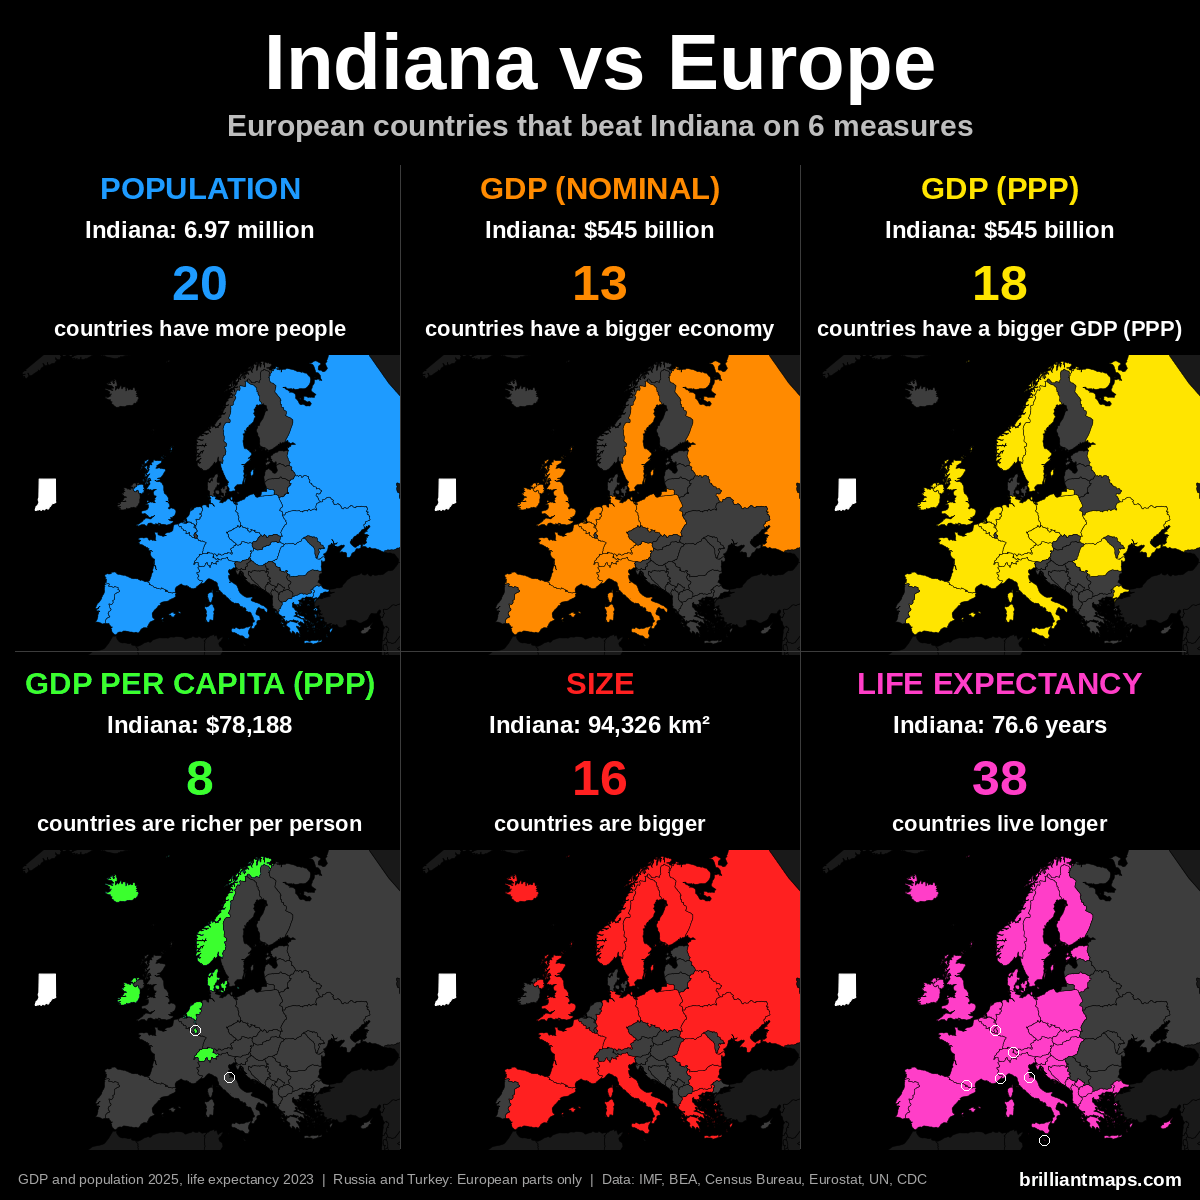
Indiana Vs European Population
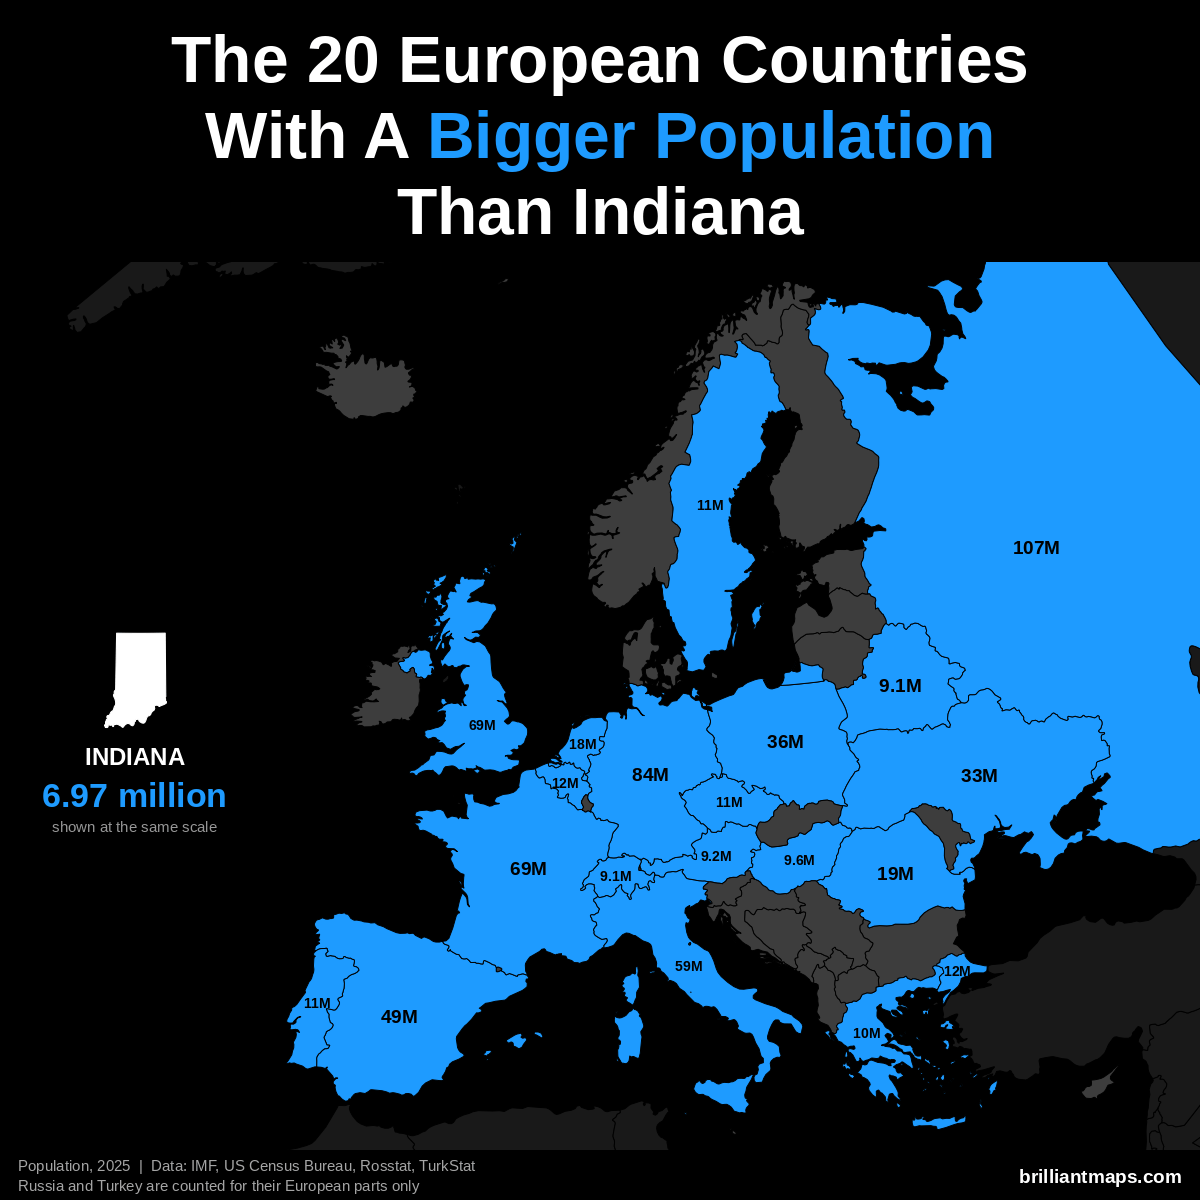
Indiana has a population of 7.0 million (2025). 20 European countries have a bigger population:
- Russia (European part): 107.0 million
- Germany: 83.5 million
- United Kingdom: 69.5 million
- France: 68.9 million
- Italy: 58.9 million
- Spain: 49.5 million
- Poland: 36.5 million
- Ukraine: 32.9 million
- Romania: 19.0 million
- Netherlands: 18.0 million
- Turkey (European part): 12.2 million
- Belgium: 11.9 million
- Portugal: 10.8 million
- Czechia: 10.8 million
- Sweden: 10.7 million
- Greece: 10.4 million
- Hungary: 9.6 million
- Austria: 9.2 million
- Belarus: 9.1 million
- Switzerland: 9.1 million
Indiana Vs European GDP (Nominal)
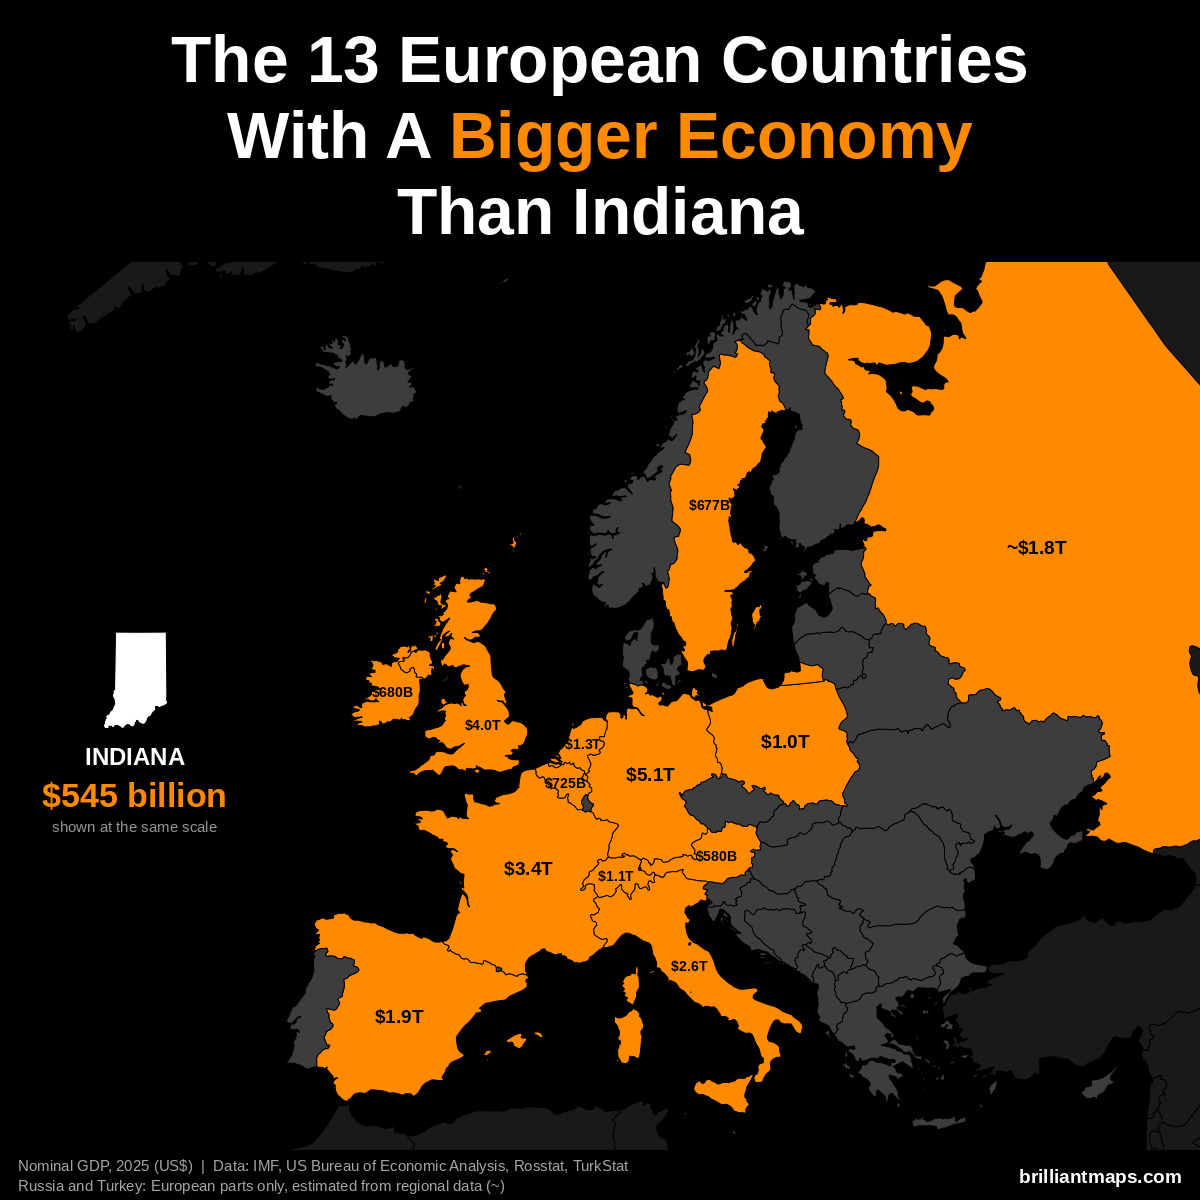
Indiana has a nominal GDP of $545 billion (2025). 13 European countries have a bigger economy:
- Germany: $5.12 trillion
- United Kingdom: $4.01 trillion
- France: $3.38 trillion
- Italy: $2.55 trillion
- Spain: $1.91 trillion
- Russia (European part): ~$1.83 trillion
- Netherlands: $1.32 trillion
- Switzerland: $1.06 trillion
- Poland: $1.04 trillion
- Belgium: $725 billion
- Ireland: $680 billion
- Sweden: $677 billion
- Austria: $580 billion
Indiana Vs European GDP (PPP)
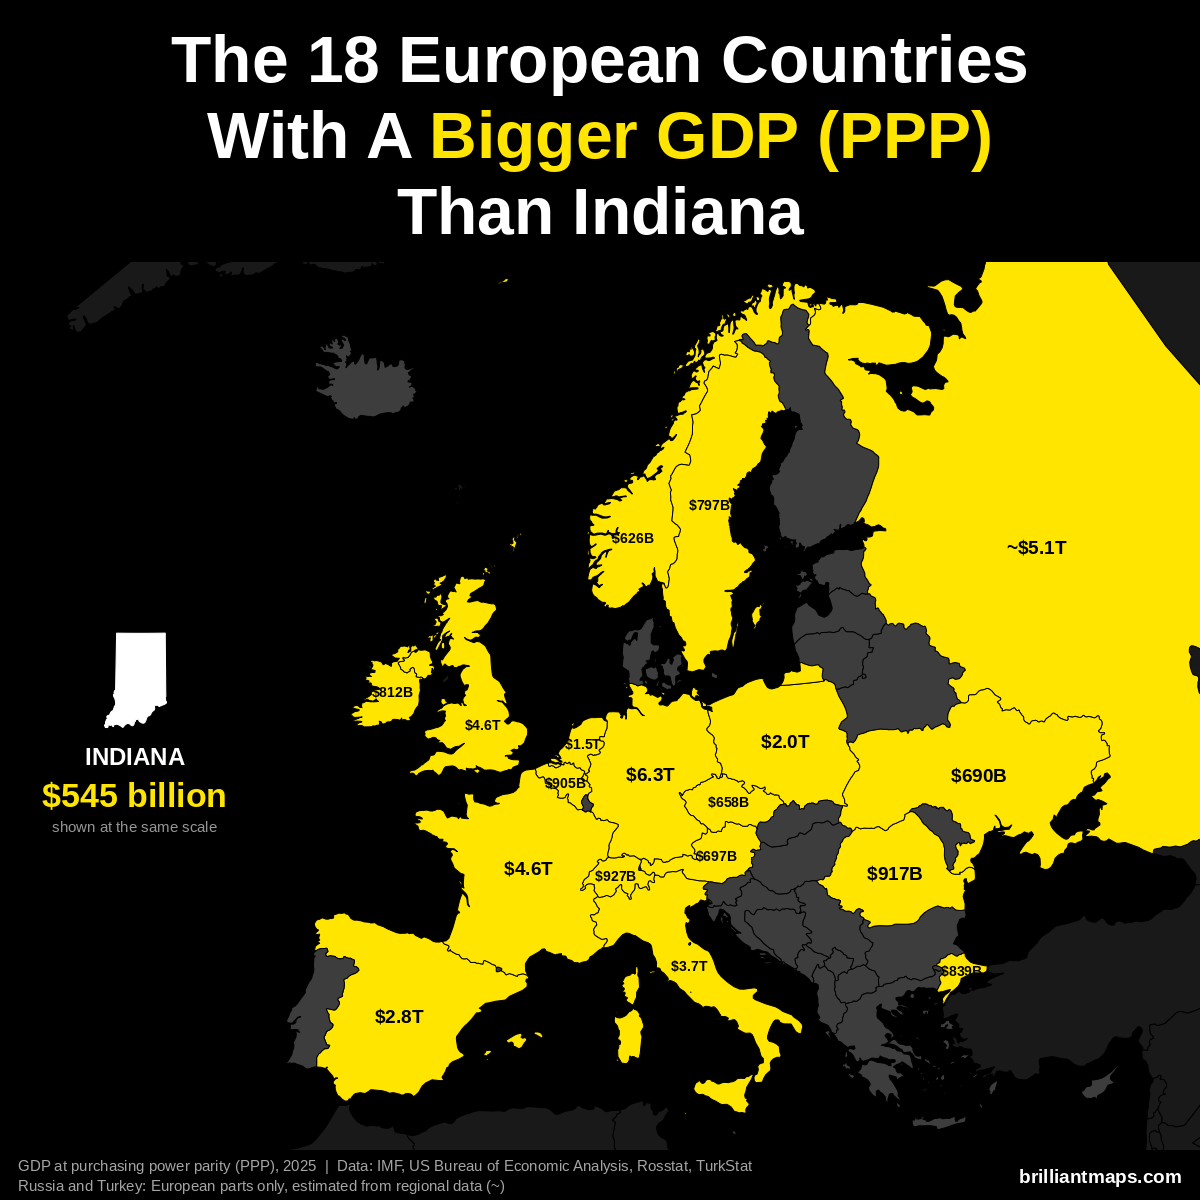
Indiana has a GDP of $545 billion (2025). US states are already measured in the dollars PPP is based on, so the figure is the same as nominal GDP. 18 European countries have a bigger GDP at purchasing power parity:
- Germany: $6.26 trillion
- Russia (European part): ~$5.14 trillion
- France: $4.58 trillion
- United Kingdom: $4.57 trillion
- Italy: $3.74 trillion
- Spain: $2.83 trillion
- Poland: $2.04 trillion
- Netherlands: $1.52 trillion
- Switzerland: $927 billion
- Romania: $917 billion
- Belgium: $905 billion
- Turkey (European part): ~$839 billion
- Ireland: $812 billion
- Sweden: $797 billion
- Austria: $697 billion
- Ukraine: $690 billion
- Czechia: $658 billion
- Norway: $626 billion
Indiana Vs European GDP Per Capita (PPP)
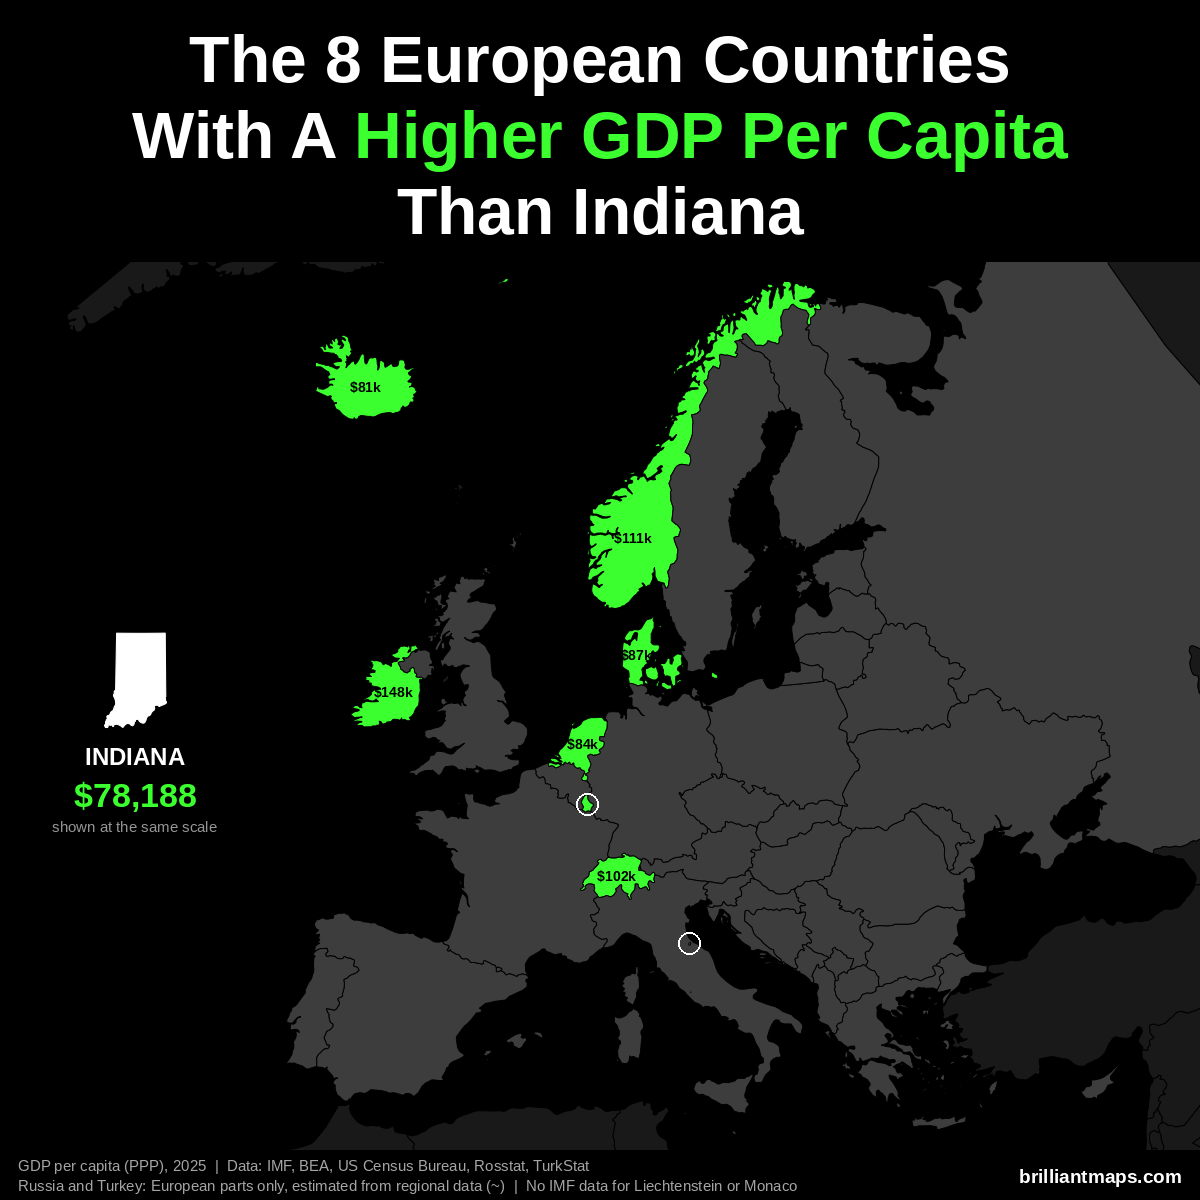
Indiana has a GDP per capita of $78,188 (2025). 8 European countries have a higher GDP per capita at purchasing power parity:
- Luxembourg: $152,894
- Ireland: $147,825
- Norway: $111,462
- Switzerland: $102,397
- Denmark: $87,303
- Netherlands: $84,445
- San Marino: $83,838
- Iceland: $80,915
Liechtenstein and Monaco are not covered by the IMF data and are not counted here.
Indiana Vs European Size
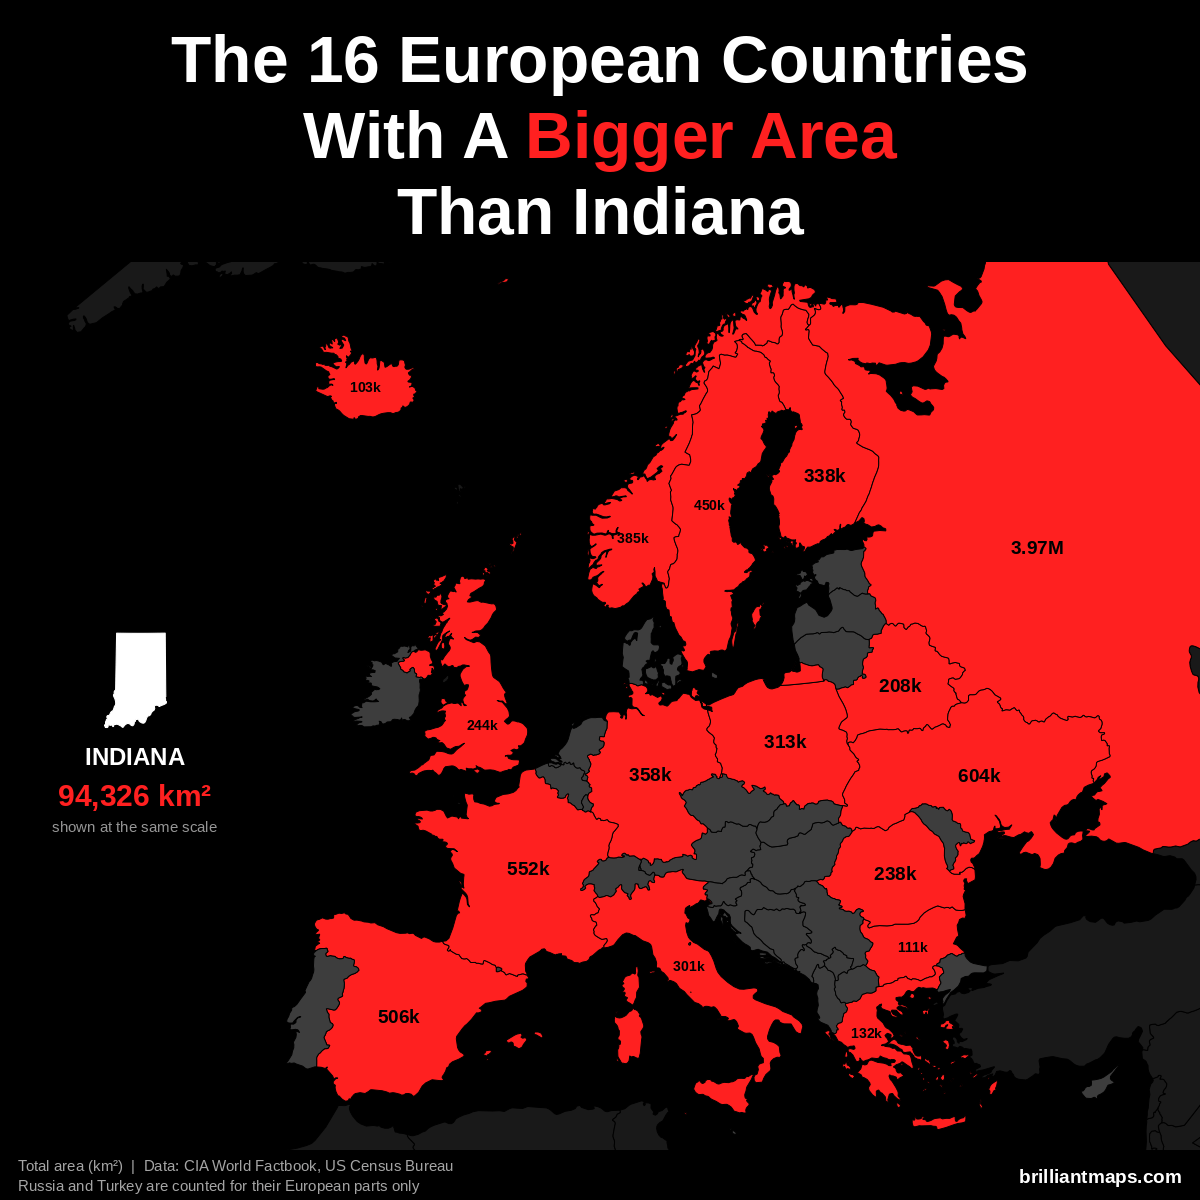
Indiana has a total area of 94,326 km² (36,419 sq mi). 16 European countries have a bigger area:
- Russia (European part): 3,969,100 km² (1,532,477 sq mi)
- Ukraine: 603,550 km² (233,032 sq mi)
- France: 551,695 km² (213,010 sq mi)
- Spain: 505,990 km² (195,364 sq mi)
- Sweden: 450,295 km² (173,860 sq mi)
- Norway: 385,207 km² (148,729 sq mi)
- Germany: 357,588 km² (138,065 sq mi)
- Finland: 338,455 km² (130,678 sq mi)
- Poland: 312,696 km² (120,733 sq mi)
- Italy: 301,340 km² (116,348 sq mi)
- United Kingdom: 243,610 km² (94,058 sq mi)
- Romania: 238,397 km² (92,046 sq mi)
- Belarus: 207,600 km² (80,155 sq mi)
- Greece: 131,957 km² (50,949 sq mi)
- Bulgaria: 110,994 km² (42,855 sq mi)
- Iceland: 103,000 km² (39,768 sq mi)
Indiana Vs European Life Expectancy
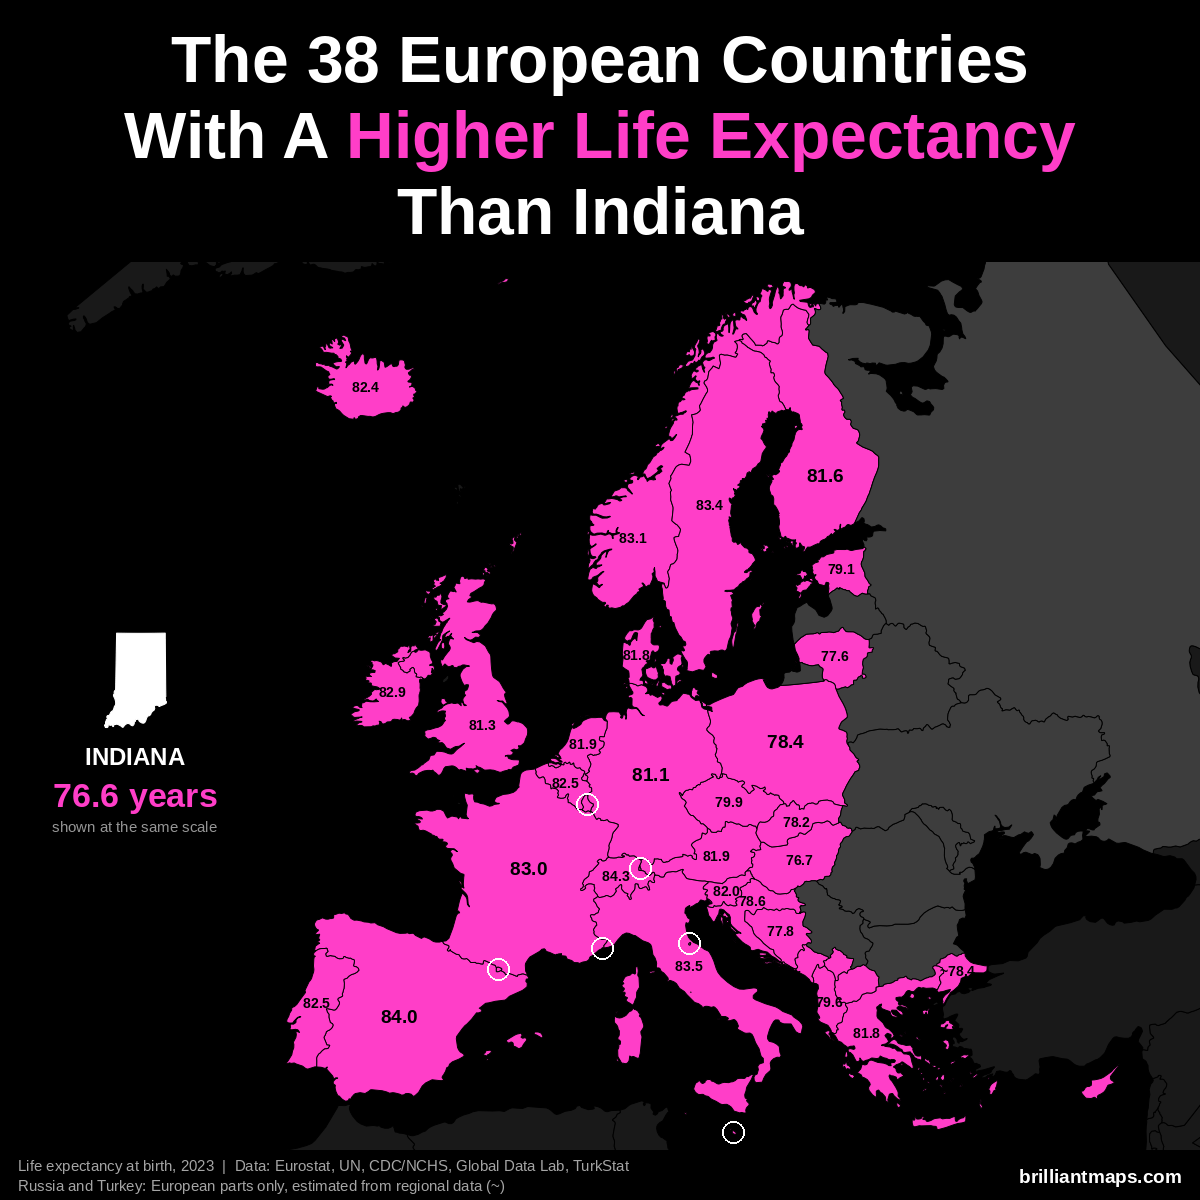
Indiana has a life expectancy at birth of 76.6 years (2023). 38 European countries have a higher life expectancy:
- Monaco: 86.4 years
- San Marino: 85.7 years
- Liechtenstein: 84.6 years
- Switzerland: 84.3 years
- Andorra: 84.0 years
- Spain: 84.0 years
- Italy: 83.5 years
- Luxembourg: 83.4 years
- Malta: 83.4 years
- Sweden: 83.4 years
- Norway: 83.1 years
- France: 83.0 years
- Cyprus: 82.9 years
- Ireland: 82.9 years
- Belgium: 82.5 years
- Portugal: 82.5 years
- Iceland: 82.4 years
- Slovenia: 82.0 years
- Austria: 81.9 years
- Netherlands: 81.9 years
- Denmark: 81.8 years
- Greece: 81.8 years
- Finland: 81.6 years
- United Kingdom: 81.3 years
- Germany: 81.1 years
- Czechia: 79.9 years
- Albania: 79.6 years
- Estonia: 79.1 years
- Croatia: 78.6 years
- Poland: 78.4 years
- Turkey (European part): ~78.4 years
- Slovakia: 78.2 years
- Kosovo: 78.0 years
- Bosnia and Herzegovina: 77.8 years
- Lithuania: 77.6 years
- Montenegro: 77.6 years
- North Macedonia: 77.4 years
- Hungary: 76.7 years
Iowa vs Europe
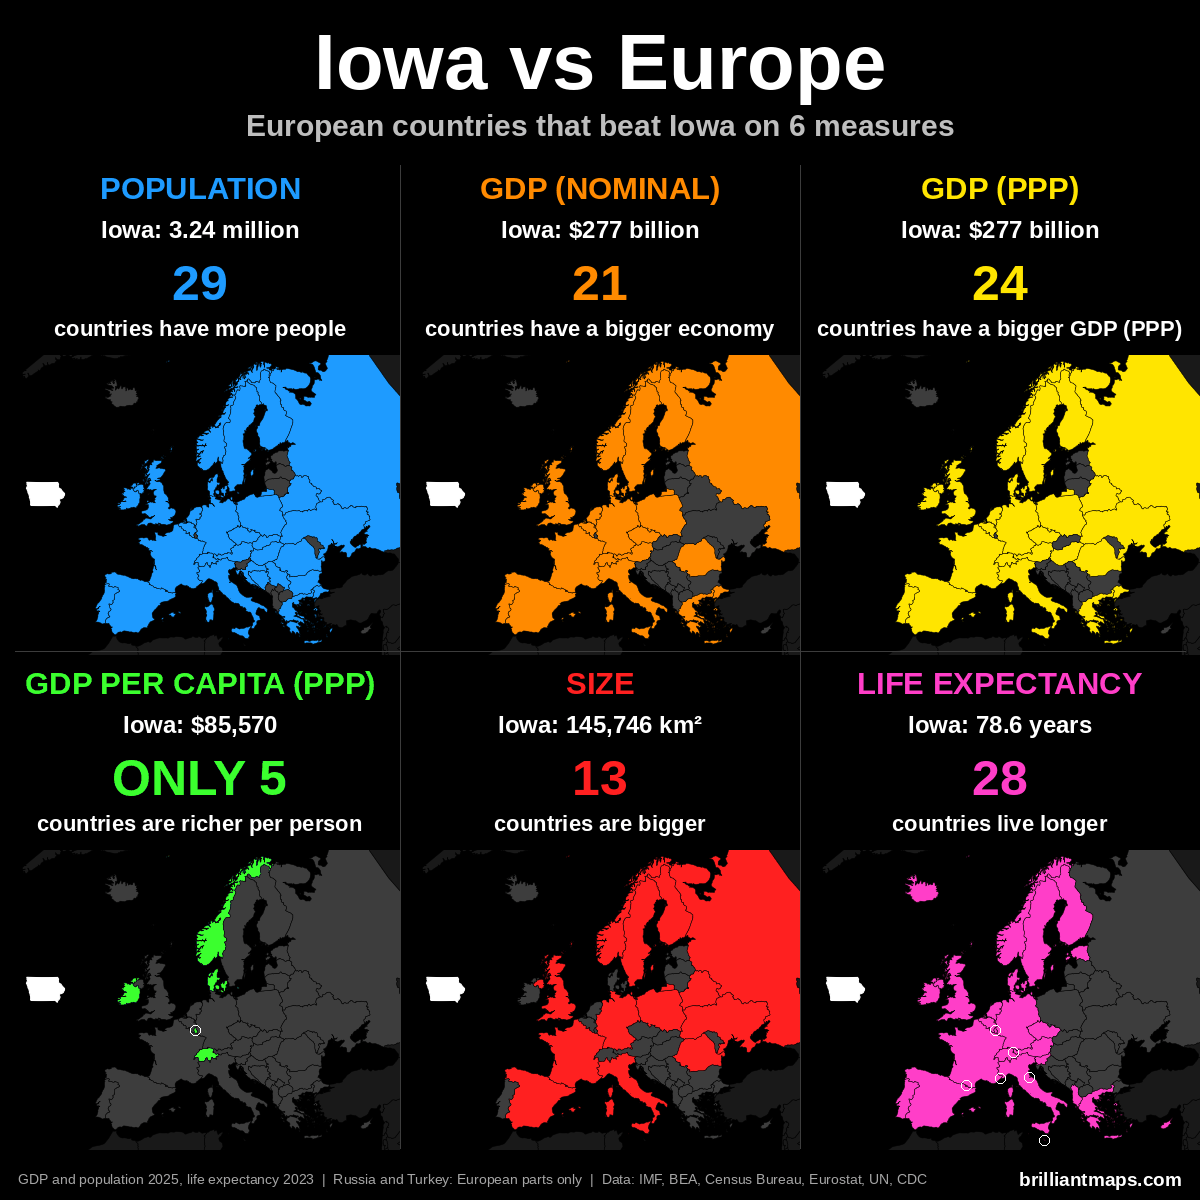
Iowa Vs European Population
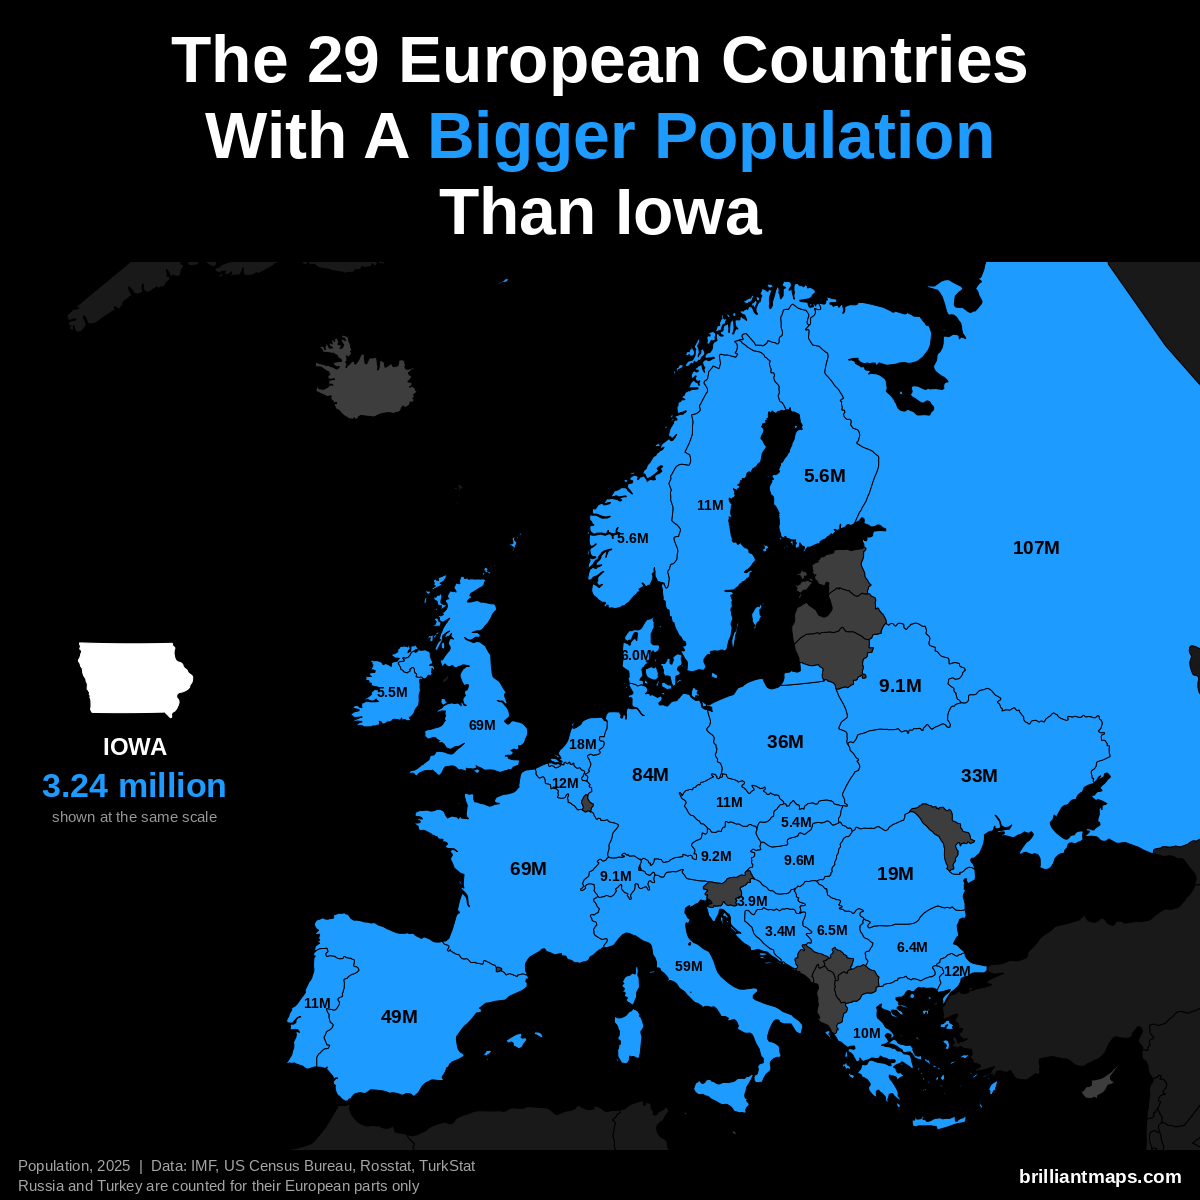
Iowa has a population of 3.2 million (2025). 29 European countries have a bigger population:
- Russia (European part): 107.0 million
- Germany: 83.5 million
- United Kingdom: 69.5 million
- France: 68.9 million
- Italy: 58.9 million
- Spain: 49.5 million
- Poland: 36.5 million
- Ukraine: 32.9 million
- Romania: 19.0 million
- Netherlands: 18.0 million
- Turkey (European part): 12.2 million
- Belgium: 11.9 million
- Portugal: 10.8 million
- Czechia: 10.8 million
- Sweden: 10.7 million
- Greece: 10.4 million
- Hungary: 9.6 million
- Austria: 9.2 million
- Belarus: 9.1 million
- Switzerland: 9.1 million
- Serbia: 6.5 million
- Bulgaria: 6.4 million
- Denmark: 6.0 million
- Norway: 5.6 million
- Finland: 5.6 million
- Ireland: 5.5 million
- Slovakia: 5.4 million
- Croatia: 3.9 million
- Bosnia and Herzegovina: 3.4 million
Iowa Vs European GDP (Nominal)
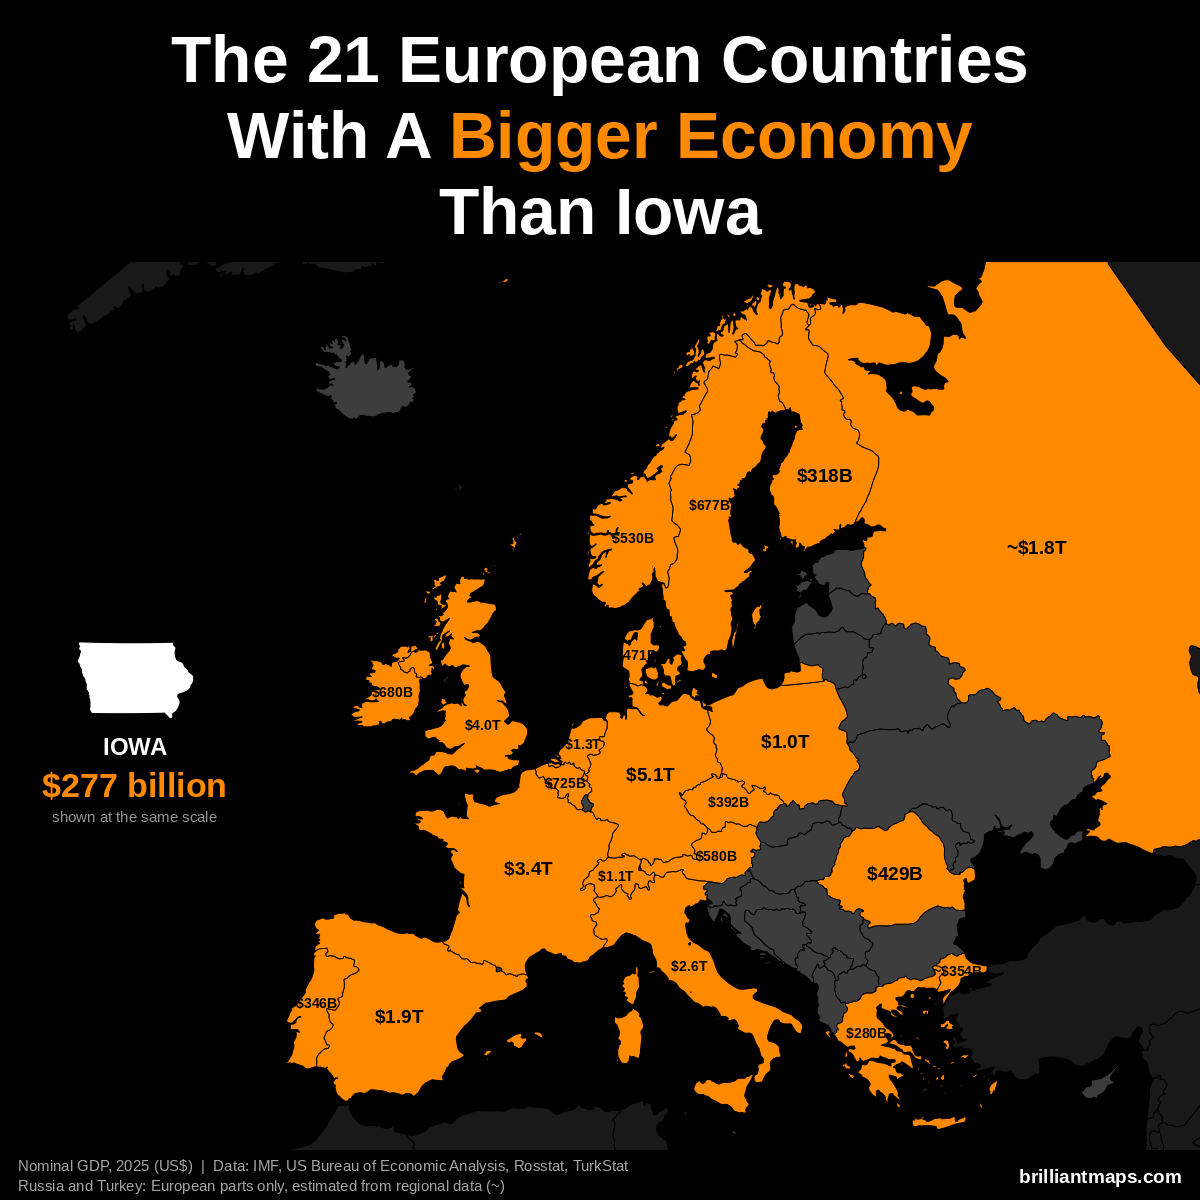
Iowa has a nominal GDP of $277 billion (2025). 21 European countries have a bigger economy:
- Germany: $5.12 trillion
- United Kingdom: $4.01 trillion
- France: $3.38 trillion
- Italy: $2.55 trillion
- Spain: $1.91 trillion
- Russia (European part): ~$1.83 trillion
- Netherlands: $1.32 trillion
- Switzerland: $1.06 trillion
- Poland: $1.04 trillion
- Belgium: $725 billion
- Ireland: $680 billion
- Sweden: $677 billion
- Austria: $580 billion
- Norway: $530 billion
- Denmark: $471 billion
- Romania: $429 billion
- Czechia: $392 billion
- Turkey (European part): ~$354 billion
- Portugal: $346 billion
- Finland: $318 billion
- Greece: $280 billion
Iowa Vs European GDP (PPP)
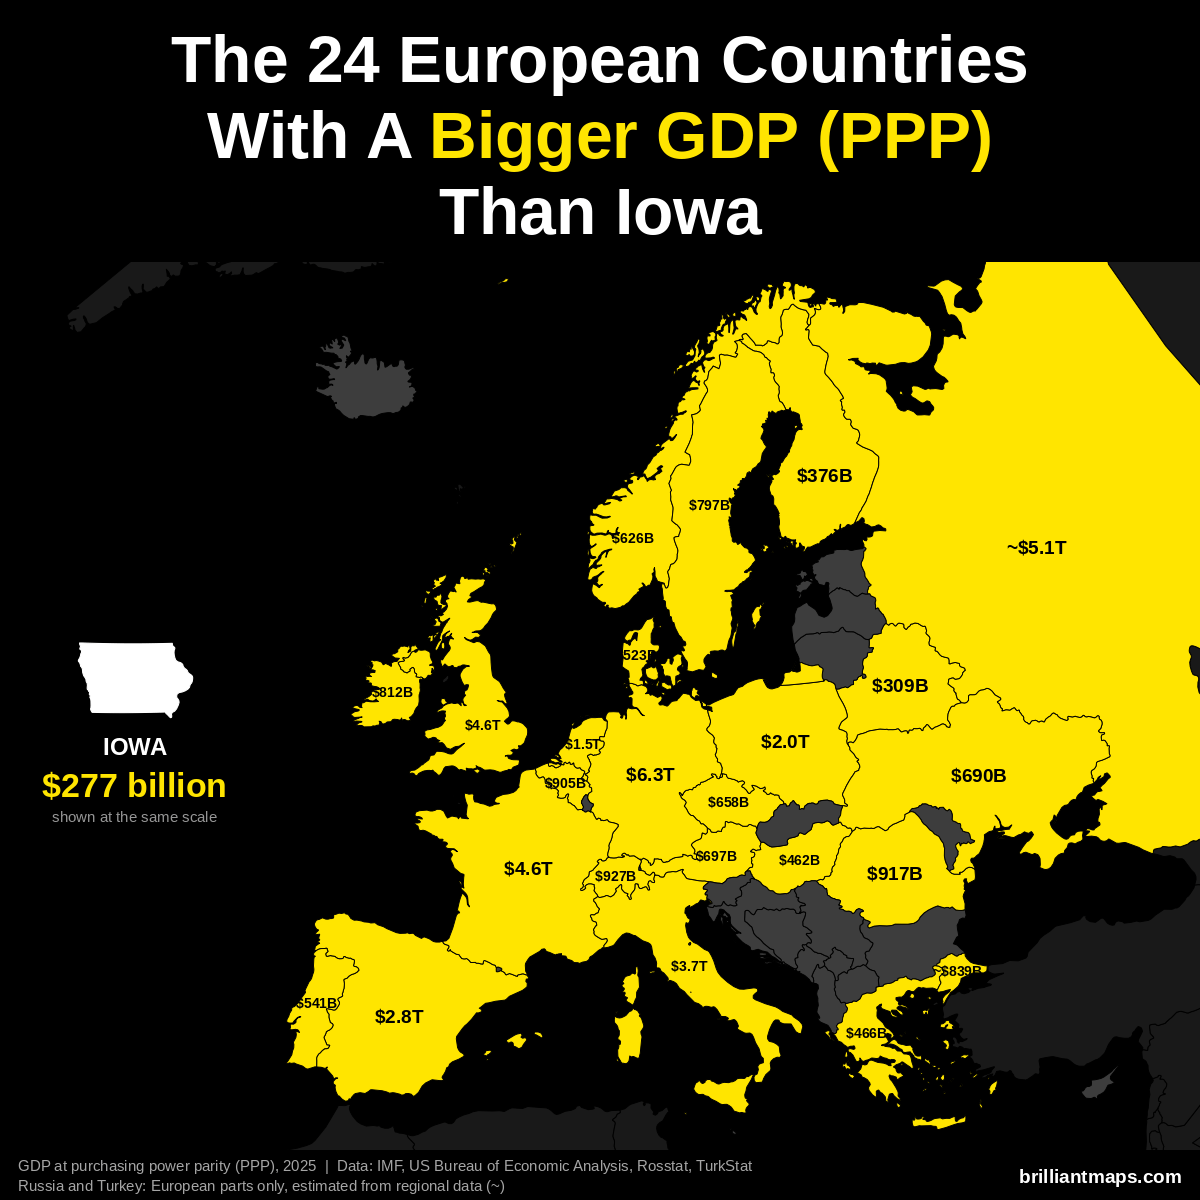
Iowa has a GDP of $277 billion (2025). US states are already measured in the dollars PPP is based on, so the figure is the same as nominal GDP. 24 European countries have a bigger GDP at purchasing power parity:
- Germany: $6.26 trillion
- Russia (European part): ~$5.14 trillion
- France: $4.58 trillion
- United Kingdom: $4.57 trillion
- Italy: $3.74 trillion
- Spain: $2.83 trillion
- Poland: $2.04 trillion
- Netherlands: $1.52 trillion
- Switzerland: $927 billion
- Romania: $917 billion
- Belgium: $905 billion
- Turkey (European part): ~$839 billion
- Ireland: $812 billion
- Sweden: $797 billion
- Austria: $697 billion
- Ukraine: $690 billion
- Czechia: $658 billion
- Norway: $626 billion
- Portugal: $541 billion
- Denmark: $523 billion
- Greece: $466 billion
- Hungary: $462 billion
- Finland: $376 billion
- Belarus: $309 billion
Iowa Vs European GDP Per Capita (PPP)
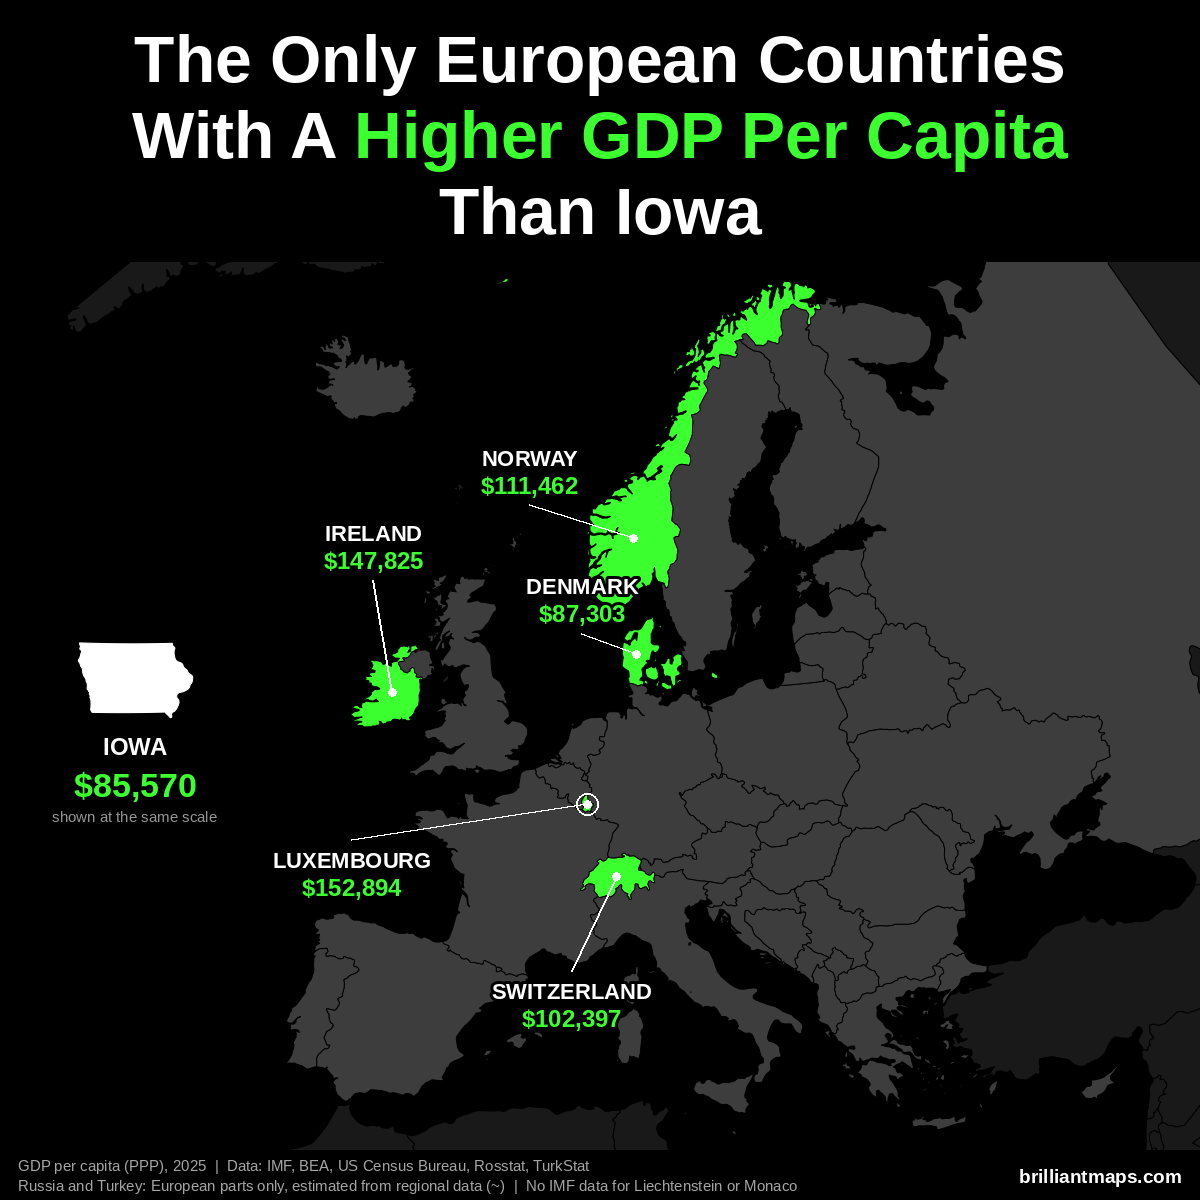
Iowa has a GDP per capita of $85,570 (2025). Only 5 European countries have a higher GDP per capita at purchasing power parity:
- Luxembourg: $152,894
- Ireland: $147,825
- Norway: $111,462
- Switzerland: $102,397
- Denmark: $87,303
Liechtenstein and Monaco are not covered by the IMF data and are not counted here.
Iowa Vs European Size
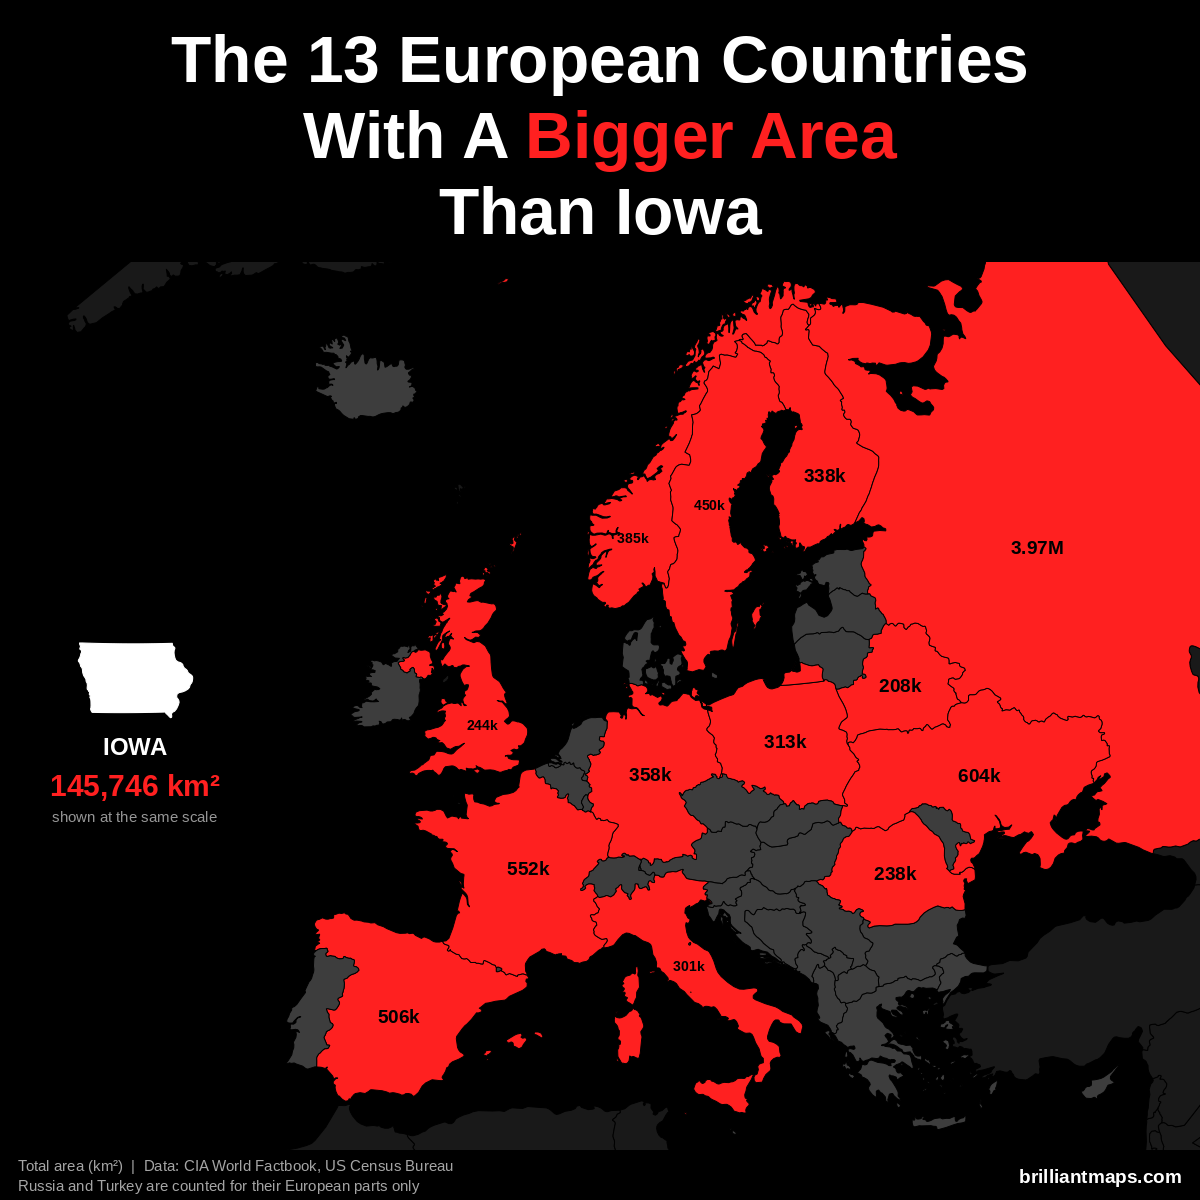
Iowa has a total area of 145,746 km² (56,273 sq mi). 13 European countries have a bigger area:
- Russia (European part): 3,969,100 km² (1,532,477 sq mi)
- Ukraine: 603,550 km² (233,032 sq mi)
- France: 551,695 km² (213,010 sq mi)
- Spain: 505,990 km² (195,364 sq mi)
- Sweden: 450,295 km² (173,860 sq mi)
- Norway: 385,207 km² (148,729 sq mi)
- Germany: 357,588 km² (138,065 sq mi)
- Finland: 338,455 km² (130,678 sq mi)
- Poland: 312,696 km² (120,733 sq mi)
- Italy: 301,340 km² (116,348 sq mi)
- United Kingdom: 243,610 km² (94,058 sq mi)
- Romania: 238,397 km² (92,046 sq mi)
- Belarus: 207,600 km² (80,155 sq mi)
Iowa Vs European Life Expectancy
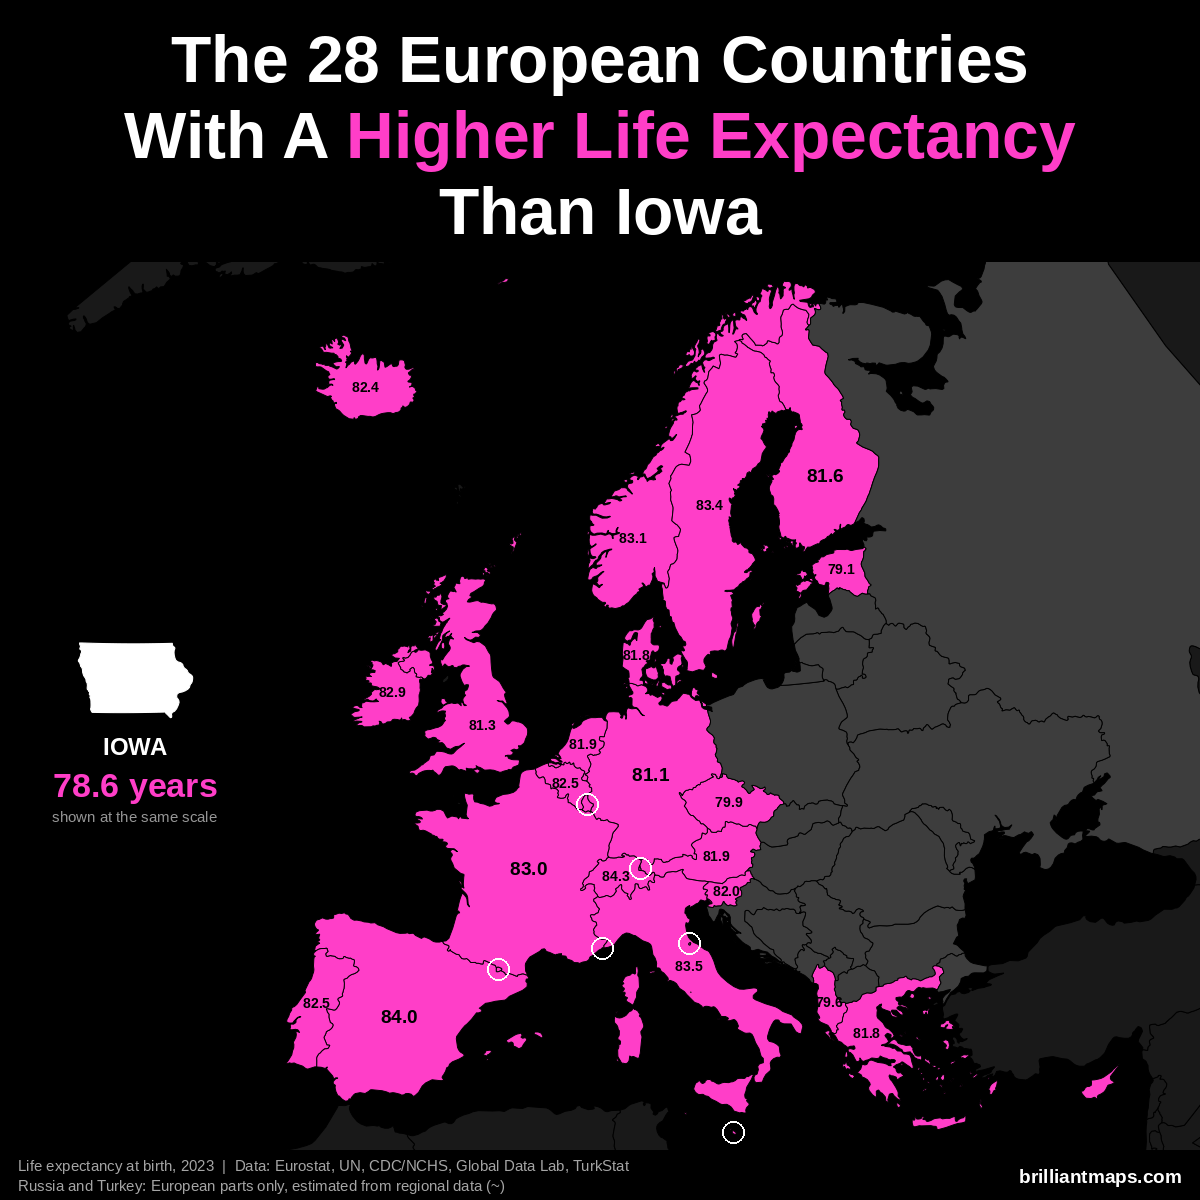
Iowa has a life expectancy at birth of 78.6 years (2023). 28 European countries have a higher life expectancy:
- Monaco: 86.4 years
- San Marino: 85.7 years
- Liechtenstein: 84.6 years
- Switzerland: 84.3 years
- Andorra: 84.0 years
- Spain: 84.0 years
- Italy: 83.5 years
- Luxembourg: 83.4 years
- Malta: 83.4 years
- Sweden: 83.4 years
- Norway: 83.1 years
- France: 83.0 years
- Cyprus: 82.9 years
- Ireland: 82.9 years
- Belgium: 82.5 years
- Portugal: 82.5 years
- Iceland: 82.4 years
- Slovenia: 82.0 years
- Austria: 81.9 years
- Netherlands: 81.9 years
- Denmark: 81.8 years
- Greece: 81.8 years
- Finland: 81.6 years
- United Kingdom: 81.3 years
- Germany: 81.1 years
- Czechia: 79.9 years
- Albania: 79.6 years
- Estonia: 79.1 years
Kansas vs Europe
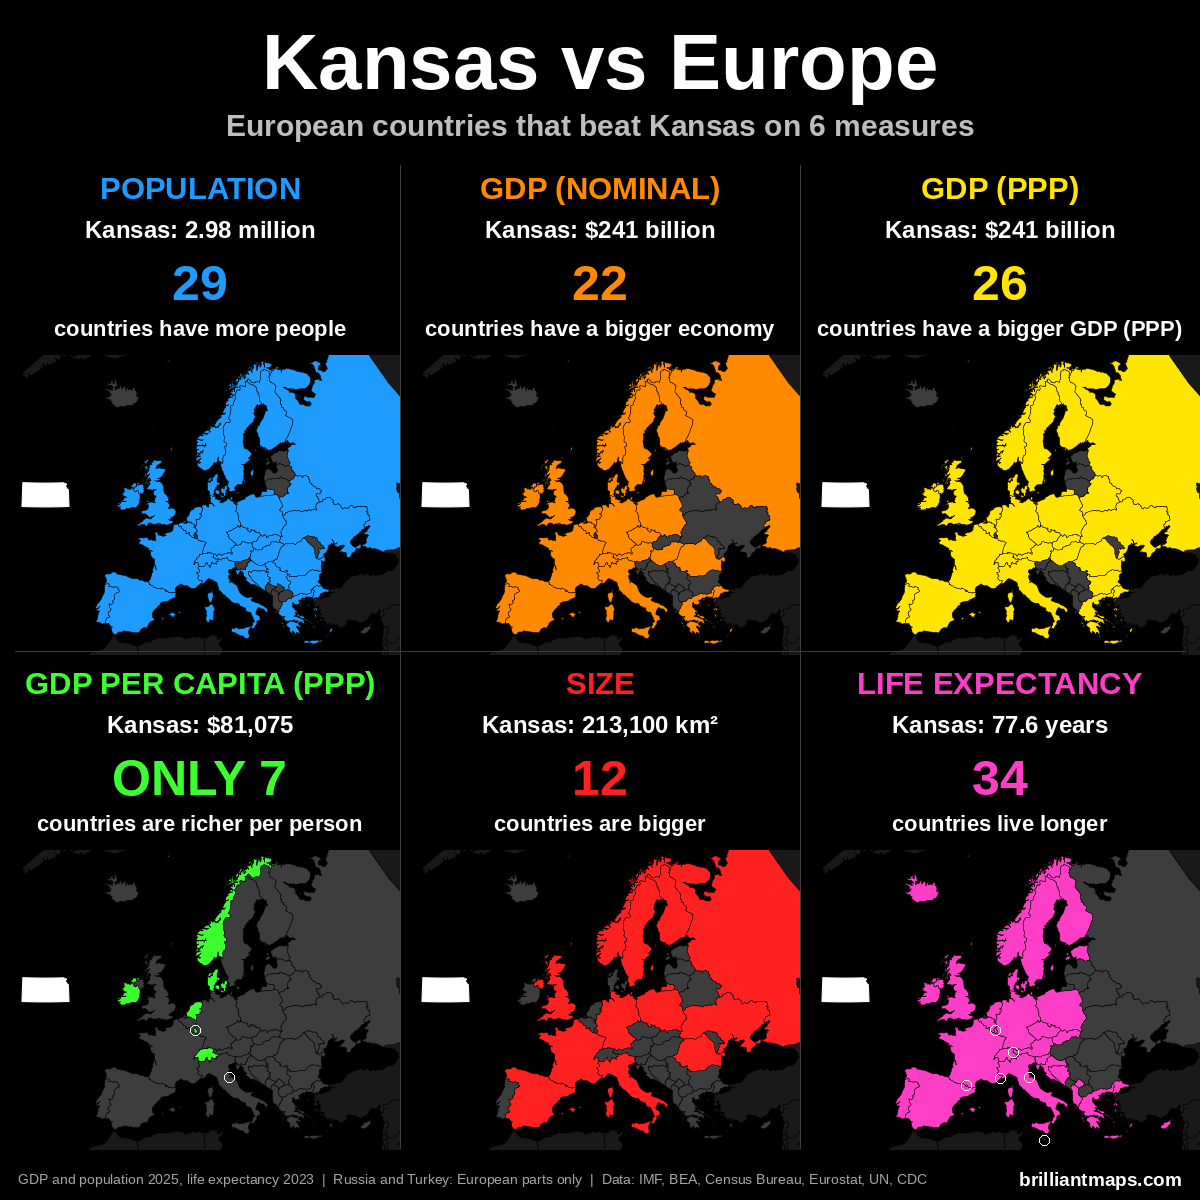
Kansas Vs European Population
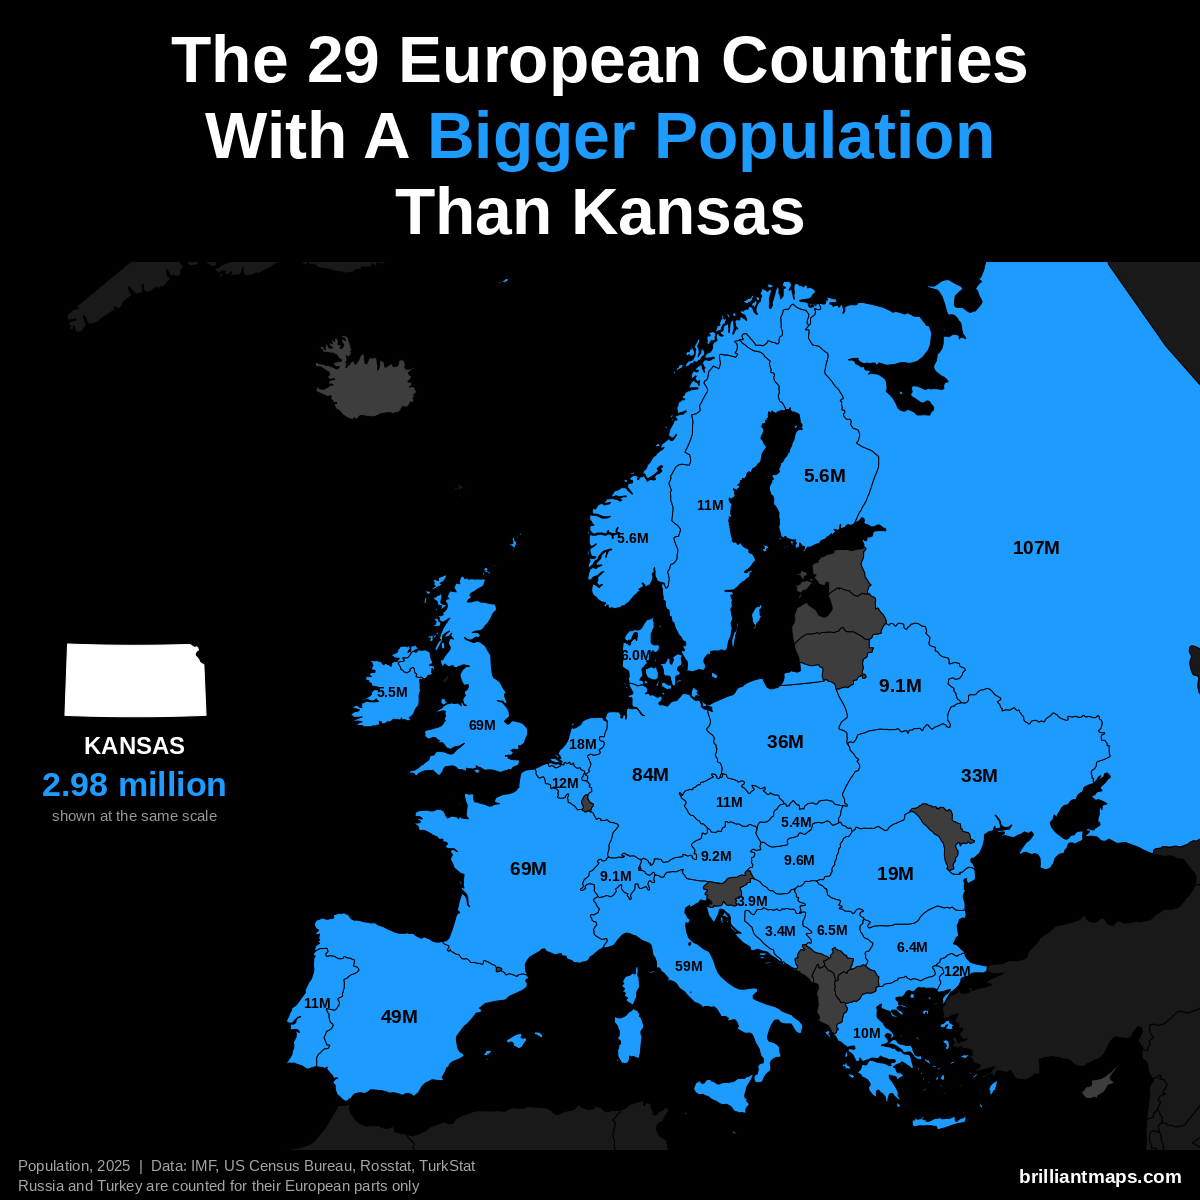
Kansas has a population of 3.0 million (2025). 29 European countries have a bigger population:
- Russia (European part): 107.0 million
- Germany: 83.5 million
- United Kingdom: 69.5 million
- France: 68.9 million
- Italy: 58.9 million
- Spain: 49.5 million
- Poland: 36.5 million
- Ukraine: 32.9 million
- Romania: 19.0 million
- Netherlands: 18.0 million
- Turkey (European part): 12.2 million
- Belgium: 11.9 million
- Portugal: 10.8 million
- Czechia: 10.8 million
- Sweden: 10.7 million
- Greece: 10.4 million
- Hungary: 9.6 million
- Austria: 9.2 million
- Belarus: 9.1 million
- Switzerland: 9.1 million
- Serbia: 6.5 million
- Bulgaria: 6.4 million
- Denmark: 6.0 million
- Norway: 5.6 million
- Finland: 5.6 million
- Ireland: 5.5 million
- Slovakia: 5.4 million
- Croatia: 3.9 million
- Bosnia and Herzegovina: 3.4 million
Kansas Vs European GDP (Nominal)
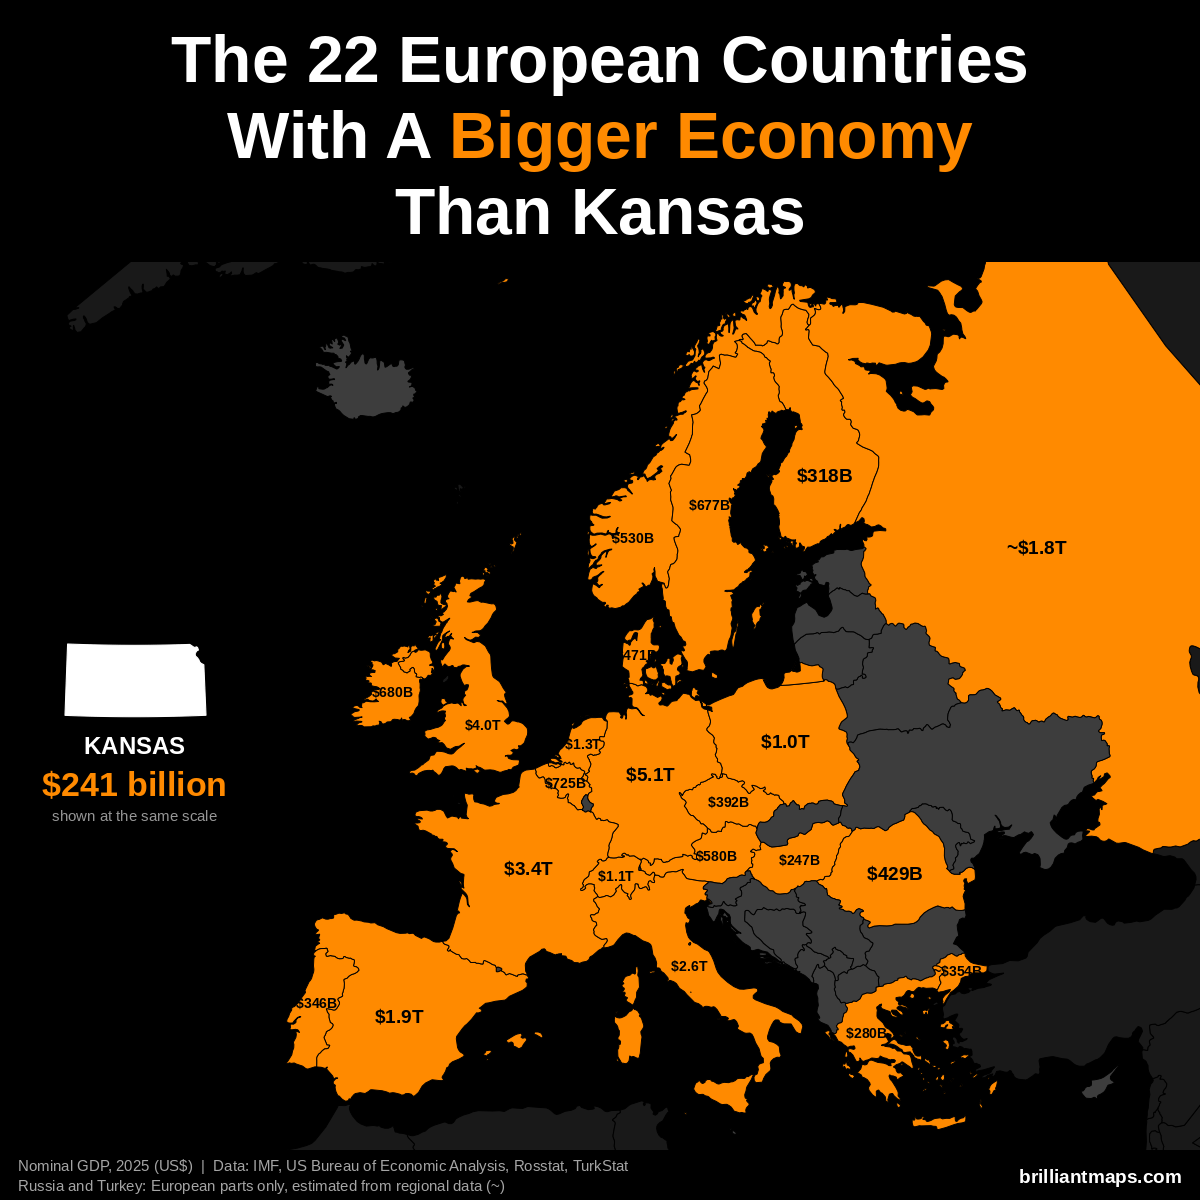
Kansas has a nominal GDP of $241 billion (2025). 22 European countries have a bigger economy:
- Germany: $5.12 trillion
- United Kingdom: $4.01 trillion
- France: $3.38 trillion
- Italy: $2.55 trillion
- Spain: $1.91 trillion
- Russia (European part): ~$1.83 trillion
- Netherlands: $1.32 trillion
- Switzerland: $1.06 trillion
- Poland: $1.04 trillion
- Belgium: $725 billion
- Ireland: $680 billion
- Sweden: $677 billion
- Austria: $580 billion
- Norway: $530 billion
- Denmark: $471 billion
- Romania: $429 billion
- Czechia: $392 billion
- Turkey (European part): ~$354 billion
- Portugal: $346 billion
- Finland: $318 billion
- Greece: $280 billion
- Hungary: $247 billion
Kansas Vs European GDP (PPP)
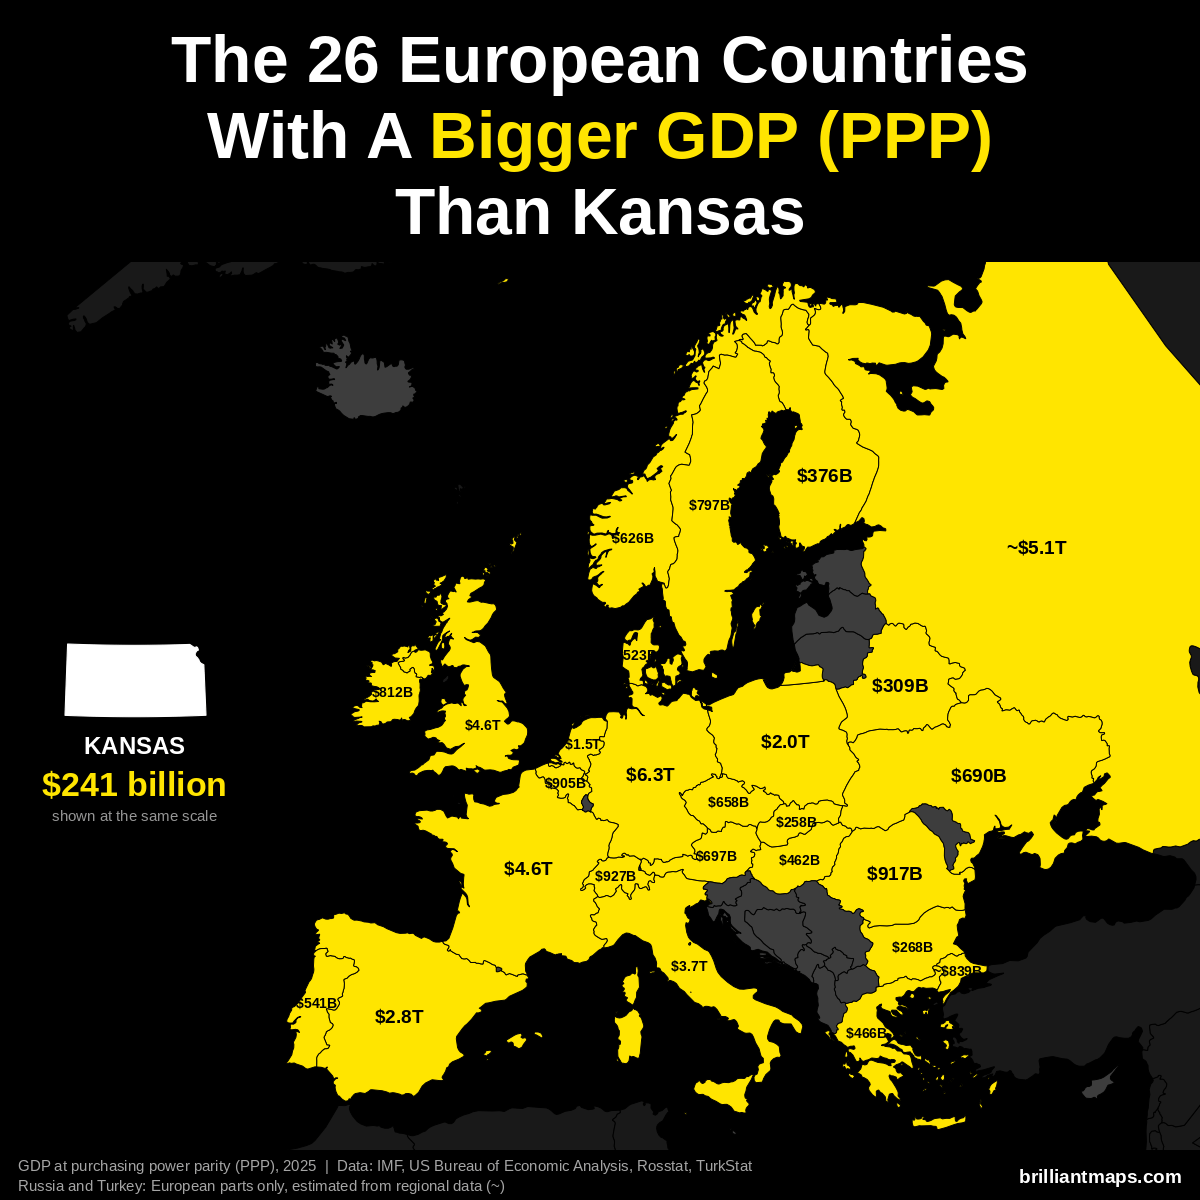
Kansas has a GDP of $241 billion (2025). US states are already measured in the dollars PPP is based on, so the figure is the same as nominal GDP. 26 European countries have a bigger GDP at purchasing power parity:
- Germany: $6.26 trillion
- Russia (European part): ~$5.14 trillion
- France: $4.58 trillion
- United Kingdom: $4.57 trillion
- Italy: $3.74 trillion
- Spain: $2.83 trillion
- Poland: $2.04 trillion
- Netherlands: $1.52 trillion
- Switzerland: $927 billion
- Romania: $917 billion
- Belgium: $905 billion
- Turkey (European part): ~$839 billion
- Ireland: $812 billion
- Sweden: $797 billion
- Austria: $697 billion
- Ukraine: $690 billion
- Czechia: $658 billion
- Norway: $626 billion
- Portugal: $541 billion
- Denmark: $523 billion
- Greece: $466 billion
- Hungary: $462 billion
- Finland: $376 billion
- Belarus: $309 billion
- Bulgaria: $268 billion
- Slovakia: $258 billion
Kansas Vs European GDP Per Capita (PPP)
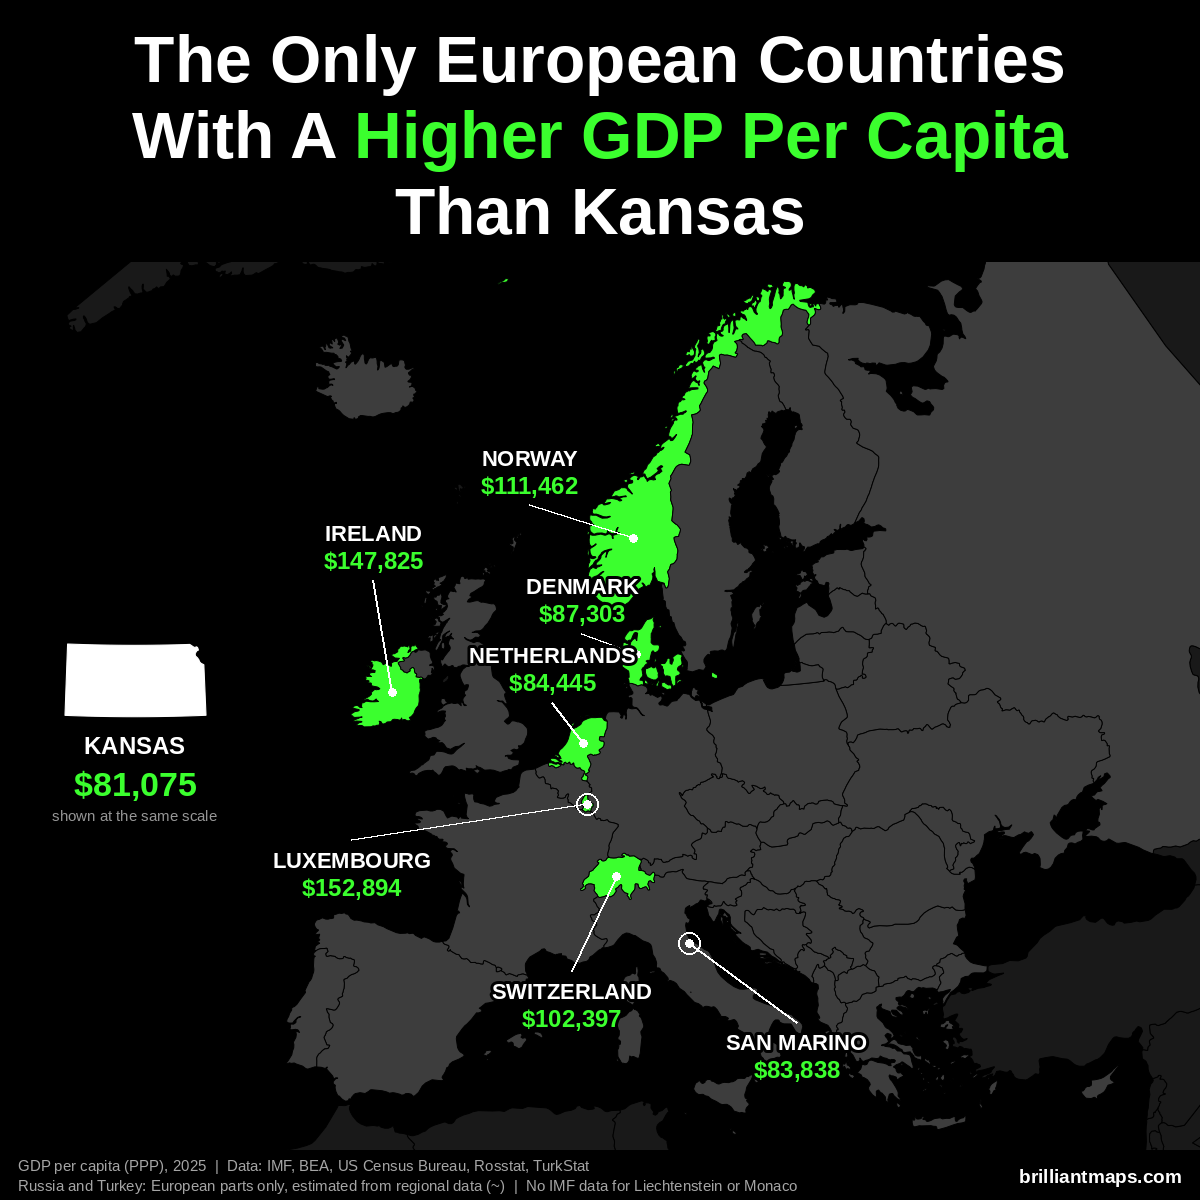
Kansas has a GDP per capita of $81,075 (2025). Only 7 European countries have a higher GDP per capita at purchasing power parity:
- Luxembourg: $152,894
- Ireland: $147,825
- Norway: $111,462
- Switzerland: $102,397
- Denmark: $87,303
- Netherlands: $84,445
- San Marino: $83,838
Liechtenstein and Monaco are not covered by the IMF data and are not counted here.
Kansas Vs European Size
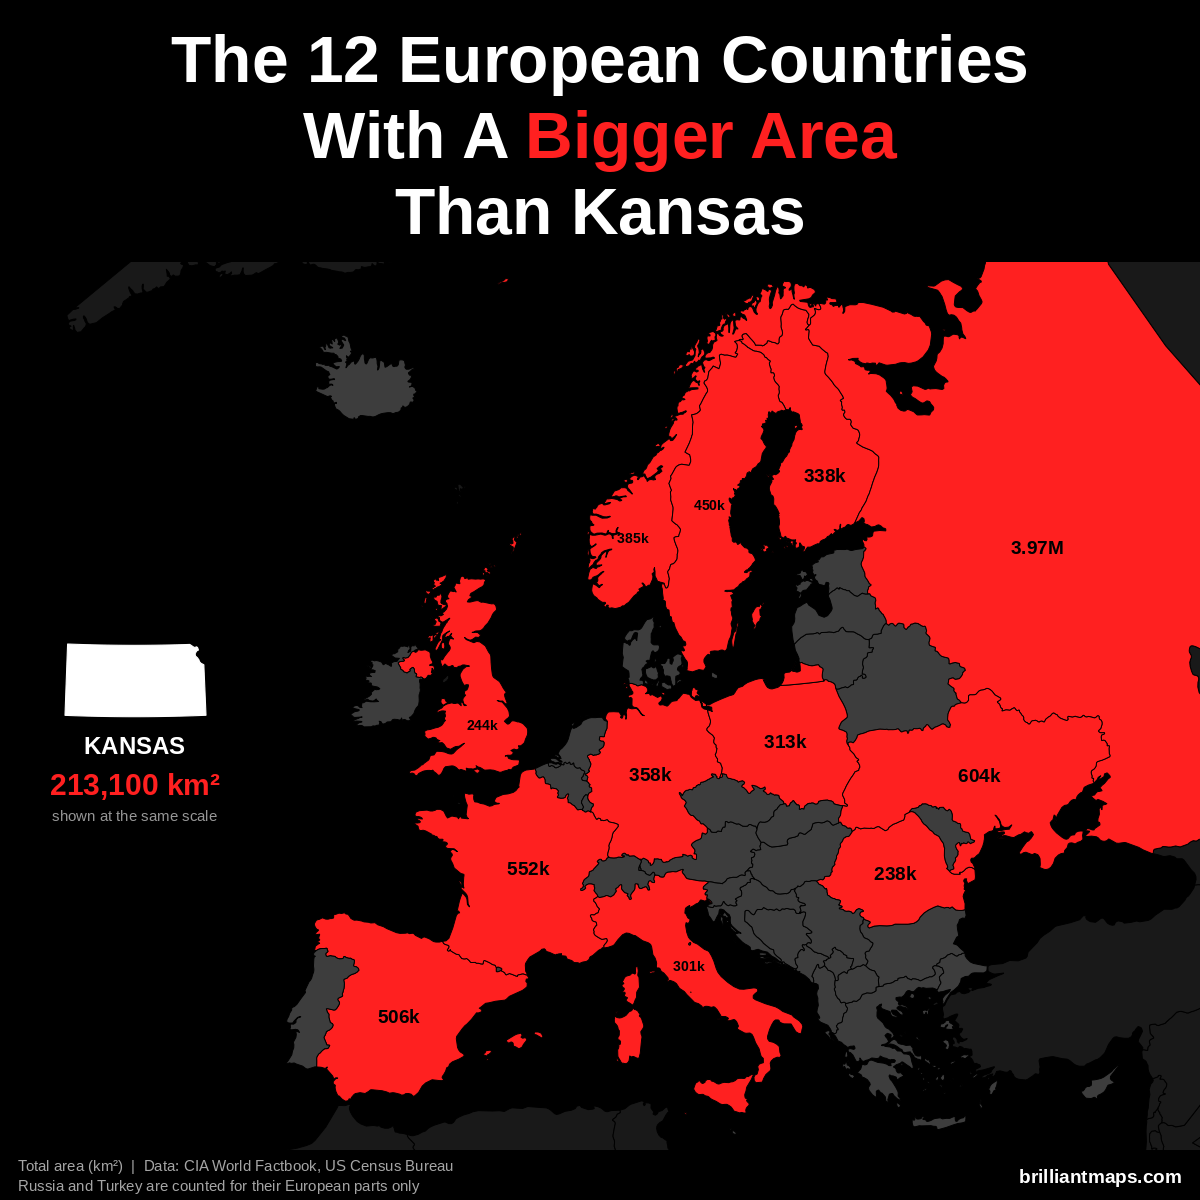
Kansas has a total area of 213,100 km² (82,278 sq mi). 12 European countries have a bigger area:
- Russia (European part): 3,969,100 km² (1,532,477 sq mi)
- Ukraine: 603,550 km² (233,032 sq mi)
- France: 551,695 km² (213,010 sq mi)
- Spain: 505,990 km² (195,364 sq mi)
- Sweden: 450,295 km² (173,860 sq mi)
- Norway: 385,207 km² (148,729 sq mi)
- Germany: 357,588 km² (138,065 sq mi)
- Finland: 338,455 km² (130,678 sq mi)
- Poland: 312,696 km² (120,733 sq mi)
- Italy: 301,340 km² (116,348 sq mi)
- United Kingdom: 243,610 km² (94,058 sq mi)
- Romania: 238,397 km² (92,046 sq mi)
Kansas Vs European Life Expectancy
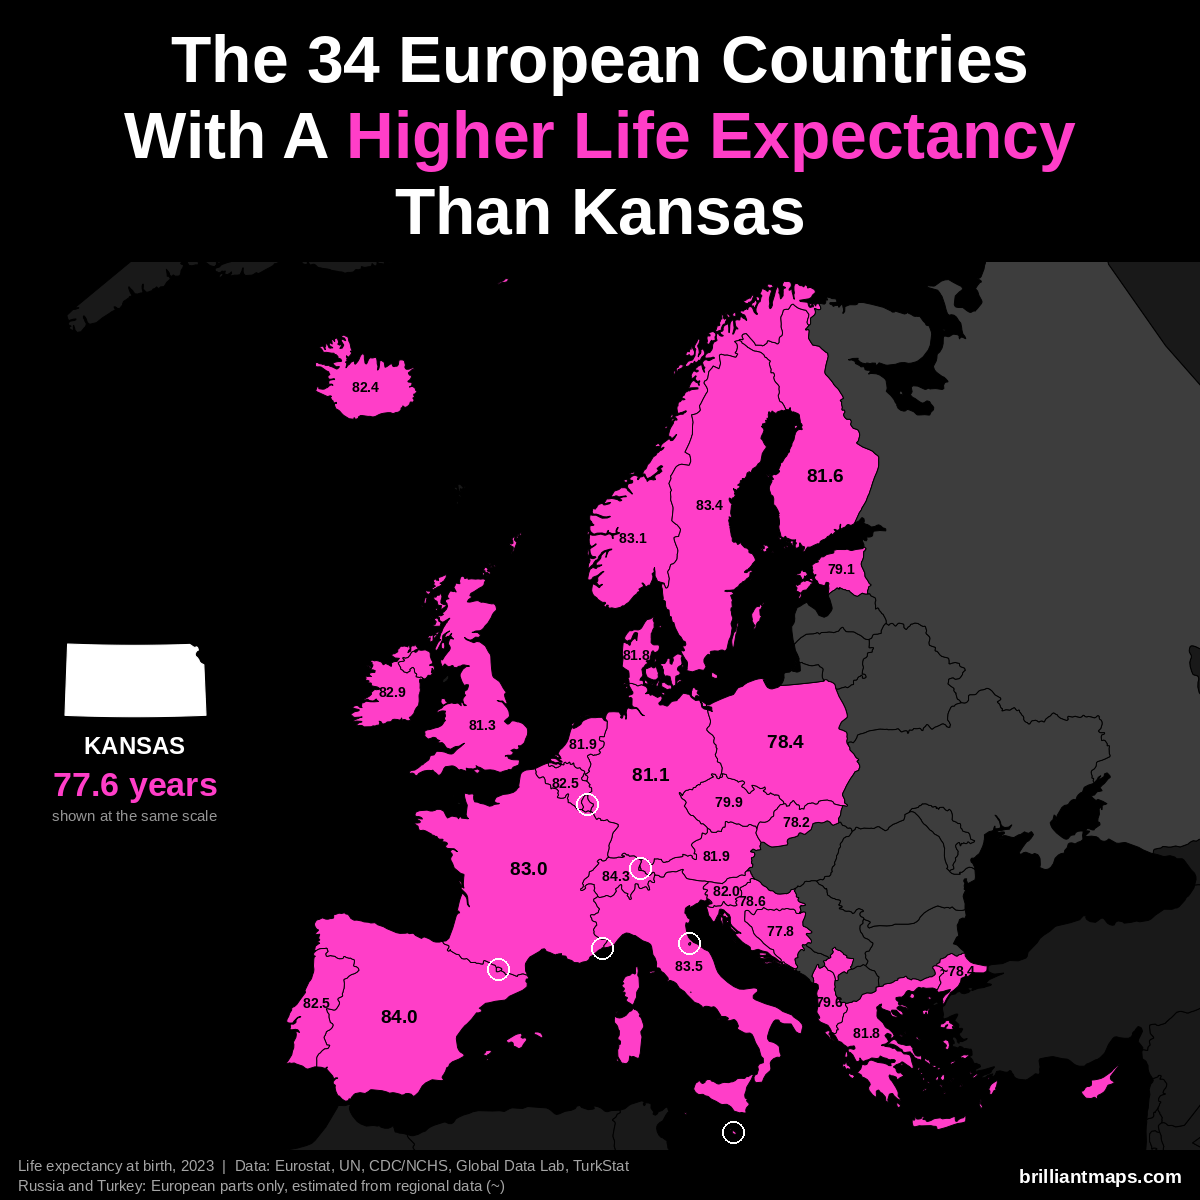
Kansas has a life expectancy at birth of 77.6 years (2023). 34 European countries have a higher life expectancy:
- Monaco: 86.4 years
- San Marino: 85.7 years
- Liechtenstein: 84.6 years
- Switzerland: 84.3 years
- Andorra: 84.0 years
- Spain: 84.0 years
- Italy: 83.5 years
- Luxembourg: 83.4 years
- Malta: 83.4 years
- Sweden: 83.4 years
- Norway: 83.1 years
- France: 83.0 years
- Cyprus: 82.9 years
- Ireland: 82.9 years
- Belgium: 82.5 years
- Portugal: 82.5 years
- Iceland: 82.4 years
- Slovenia: 82.0 years
- Austria: 81.9 years
- Netherlands: 81.9 years
- Denmark: 81.8 years
- Greece: 81.8 years
- Finland: 81.6 years
- United Kingdom: 81.3 years
- Germany: 81.1 years
- Czechia: 79.9 years
- Albania: 79.6 years
- Estonia: 79.1 years
- Croatia: 78.6 years
- Poland: 78.4 years
- Turkey (European part): ~78.4 years
- Slovakia: 78.2 years
- Kosovo: 78.0 years
- Bosnia and Herzegovina: 77.8 years
Kentucky vs Europe
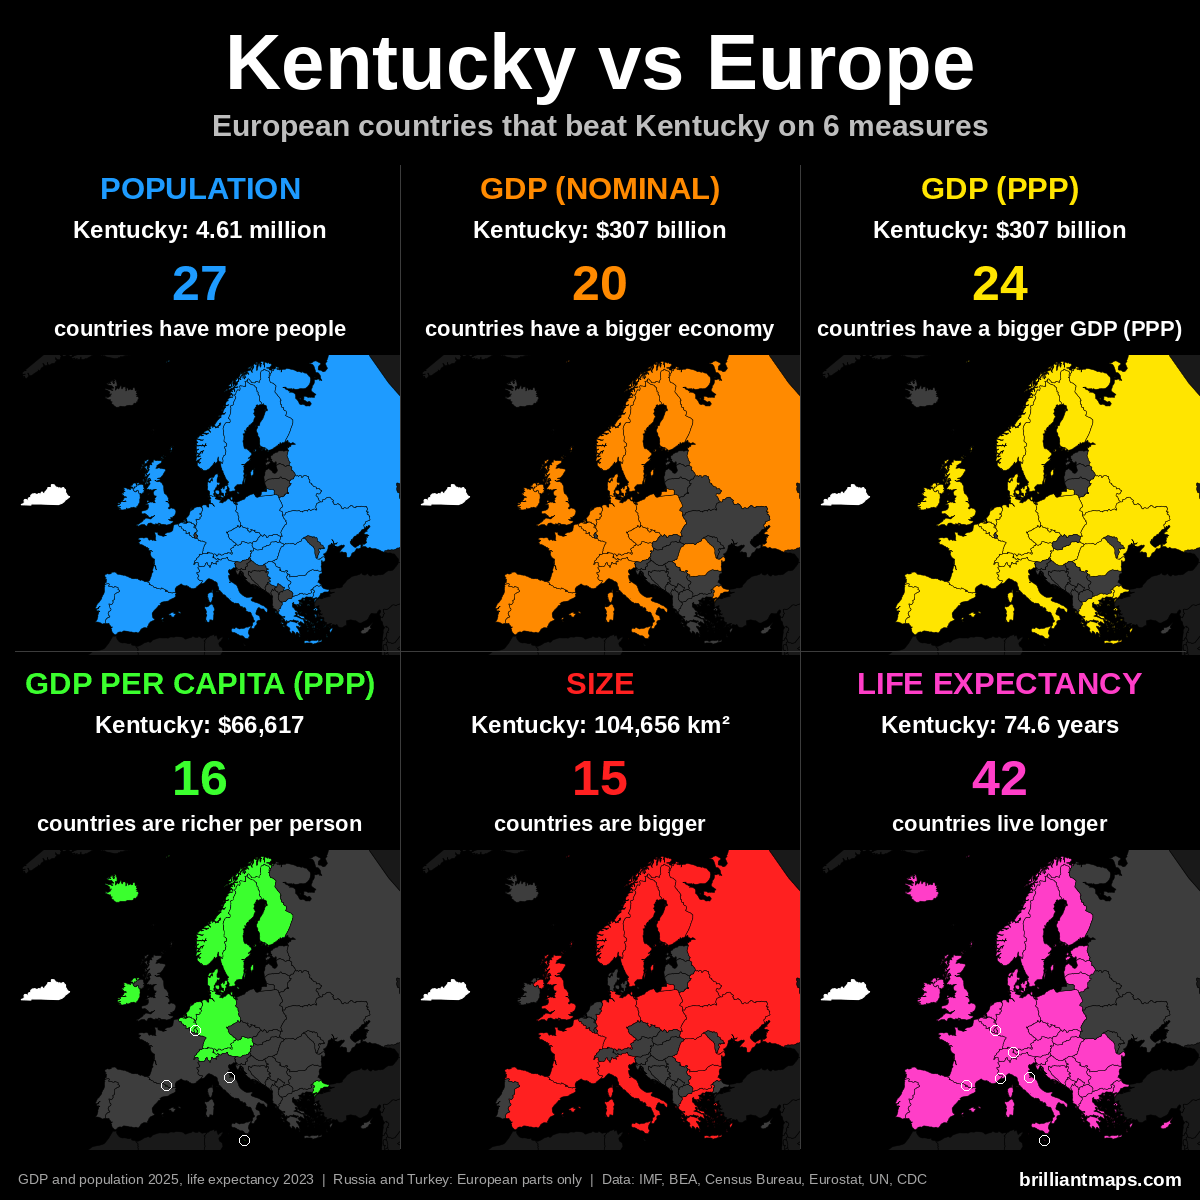
Kentucky Vs European Population
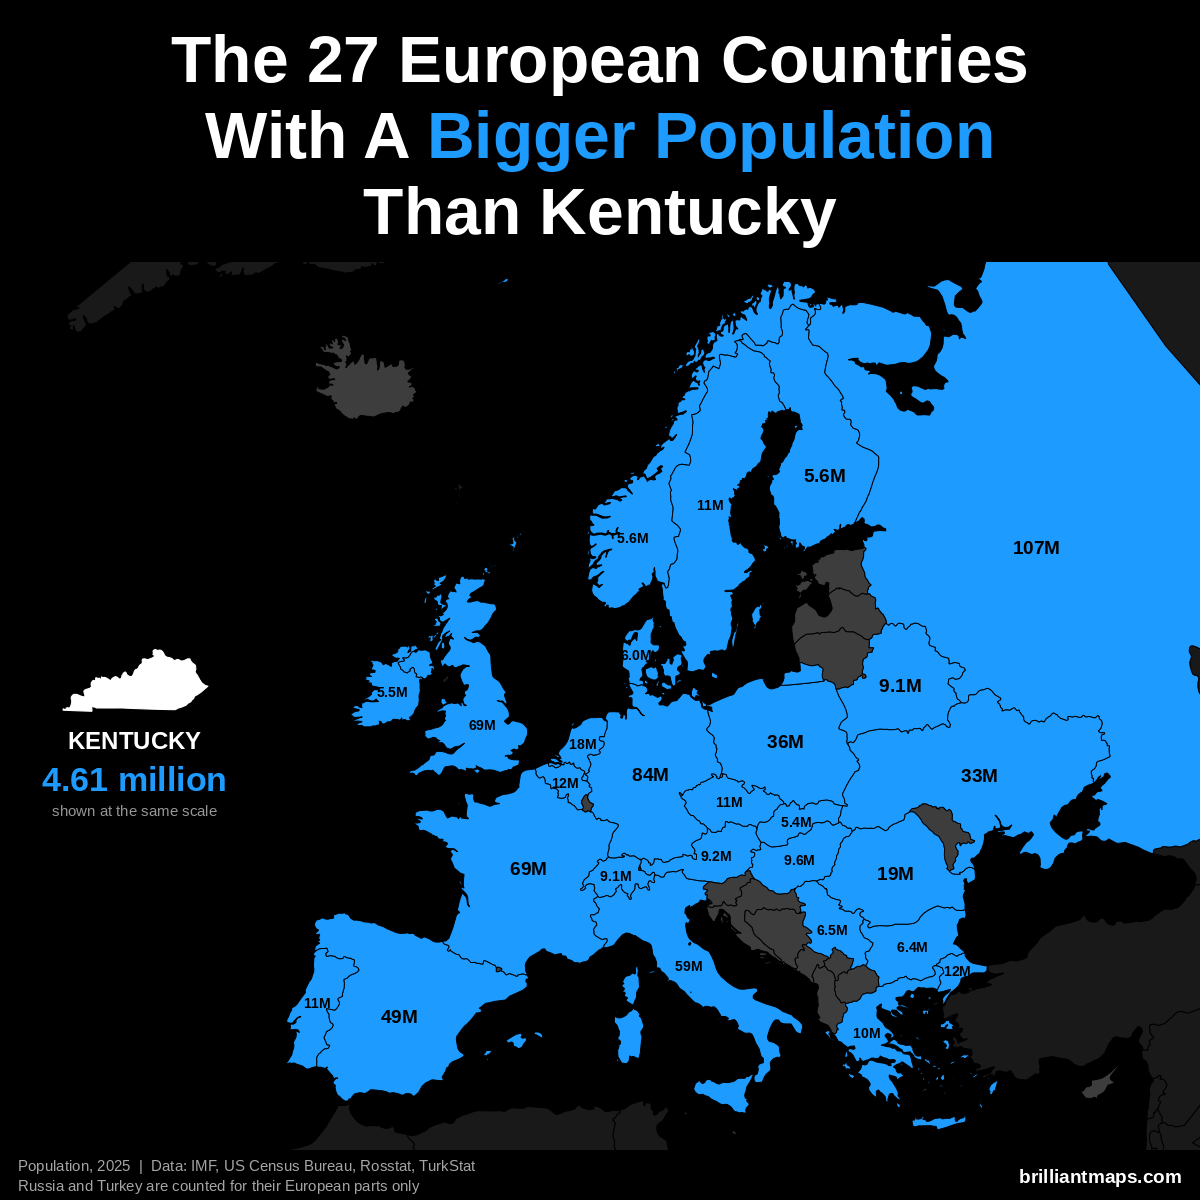
Kentucky has a population of 4.6 million (2025). 27 European countries have a bigger population:
- Russia (European part): 107.0 million
- Germany: 83.5 million
- United Kingdom: 69.5 million
- France: 68.9 million
- Italy: 58.9 million
- Spain: 49.5 million
- Poland: 36.5 million
- Ukraine: 32.9 million
- Romania: 19.0 million
- Netherlands: 18.0 million
- Turkey (European part): 12.2 million
- Belgium: 11.9 million
- Portugal: 10.8 million
- Czechia: 10.8 million
- Sweden: 10.7 million
- Greece: 10.4 million
- Hungary: 9.6 million
- Austria: 9.2 million
- Belarus: 9.1 million
- Switzerland: 9.1 million
- Serbia: 6.5 million
- Bulgaria: 6.4 million
- Denmark: 6.0 million
- Norway: 5.6 million
- Finland: 5.6 million
- Ireland: 5.5 million
- Slovakia: 5.4 million
Kentucky Vs European GDP (Nominal)
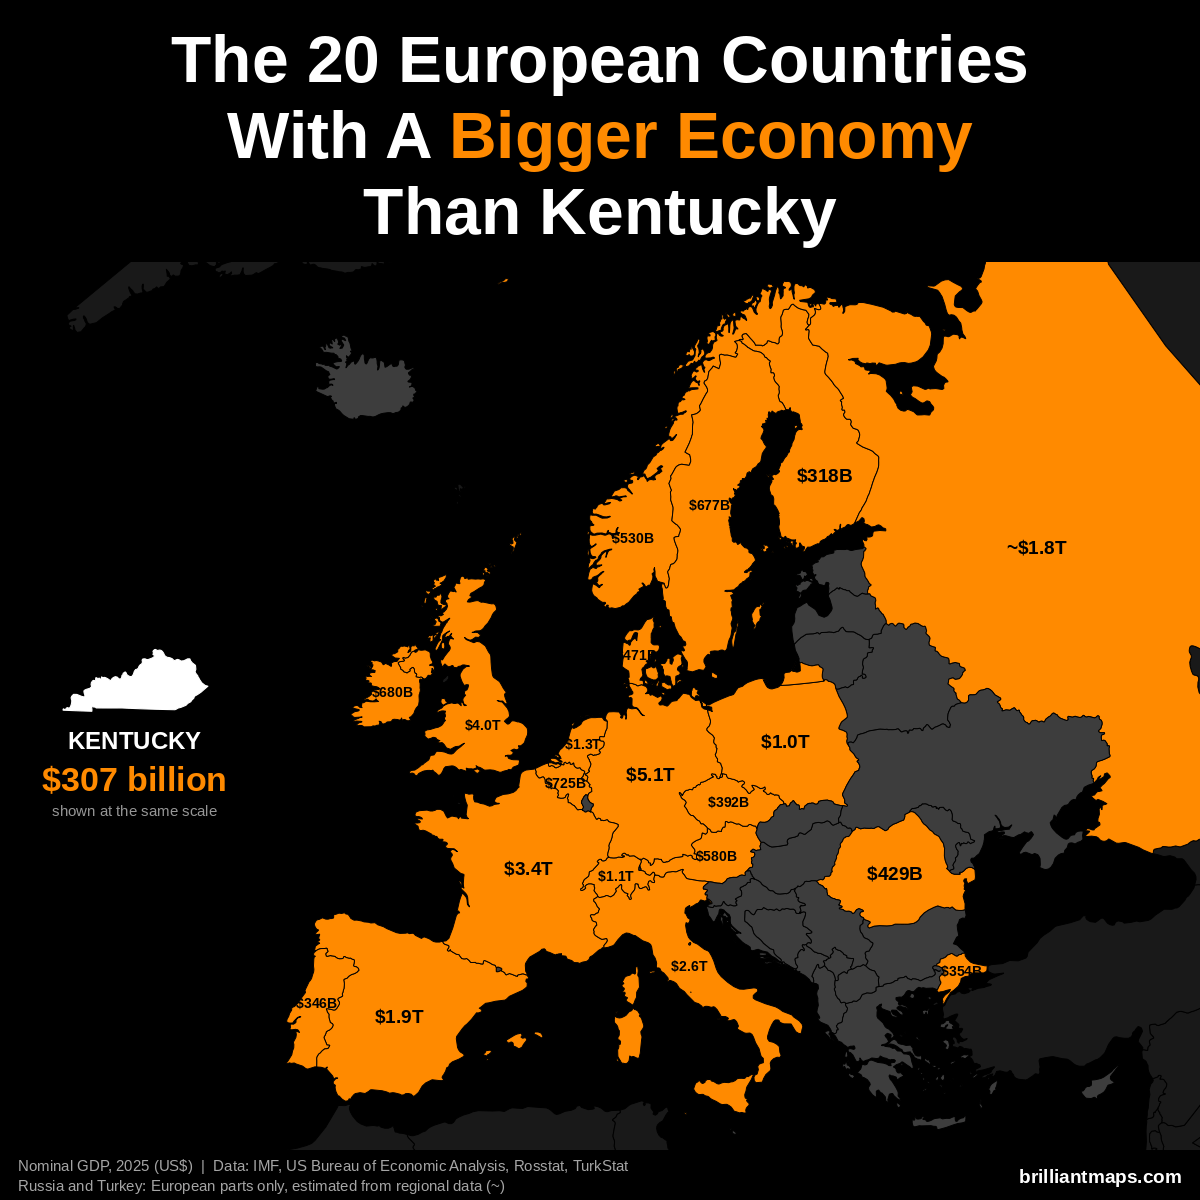
Kentucky has a nominal GDP of $307 billion (2025). 20 European countries have a bigger economy:
- Germany: $5.12 trillion
- United Kingdom: $4.01 trillion
- France: $3.38 trillion
- Italy: $2.55 trillion
- Spain: $1.91 trillion
- Russia (European part): ~$1.83 trillion
- Netherlands: $1.32 trillion
- Switzerland: $1.06 trillion
- Poland: $1.04 trillion
- Belgium: $725 billion
- Ireland: $680 billion
- Sweden: $677 billion
- Austria: $580 billion
- Norway: $530 billion
- Denmark: $471 billion
- Romania: $429 billion
- Czechia: $392 billion
- Turkey (European part): ~$354 billion
- Portugal: $346 billion
- Finland: $318 billion
Kentucky Vs European GDP (PPP)
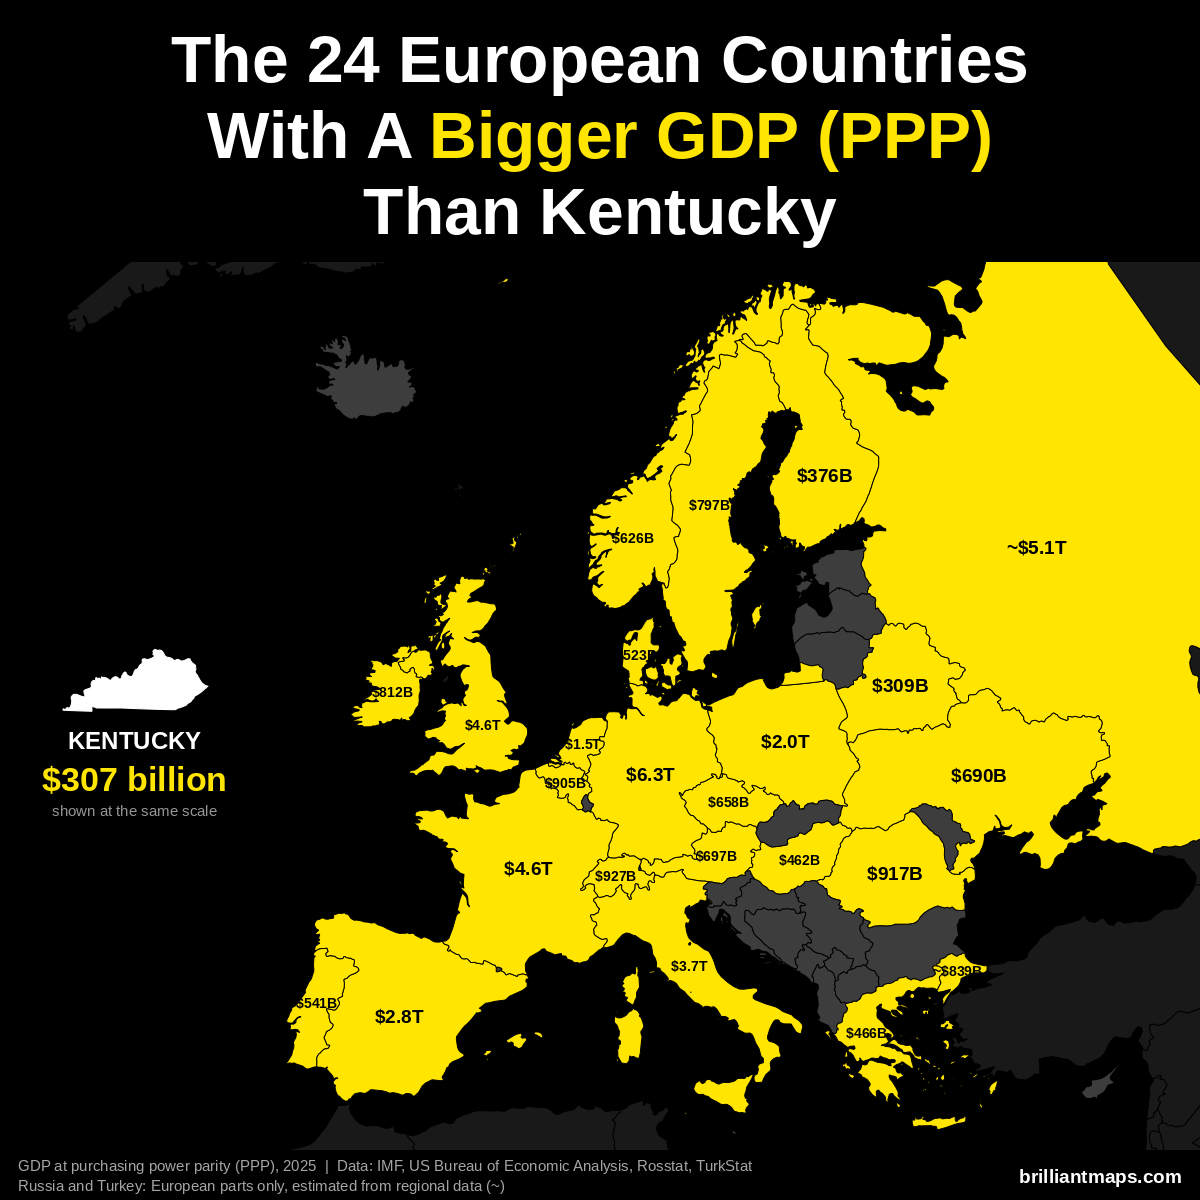
Kentucky has a GDP of $307 billion (2025). US states are already measured in the dollars PPP is based on, so the figure is the same as nominal GDP. 24 European countries have a bigger GDP at purchasing power parity:
- Germany: $6.26 trillion
- Russia (European part): ~$5.14 trillion
- France: $4.58 trillion
- United Kingdom: $4.57 trillion
- Italy: $3.74 trillion
- Spain: $2.83 trillion
- Poland: $2.04 trillion
- Netherlands: $1.52 trillion
- Switzerland: $927 billion
- Romania: $917 billion
- Belgium: $905 billion
- Turkey (European part): ~$839 billion
- Ireland: $812 billion
- Sweden: $797 billion
- Austria: $697 billion
- Ukraine: $690 billion
- Czechia: $658 billion
- Norway: $626 billion
- Portugal: $541 billion
- Denmark: $523 billion
- Greece: $466 billion
- Hungary: $462 billion
- Finland: $376 billion
- Belarus: $309 billion
Kentucky Vs European GDP Per Capita (PPP)
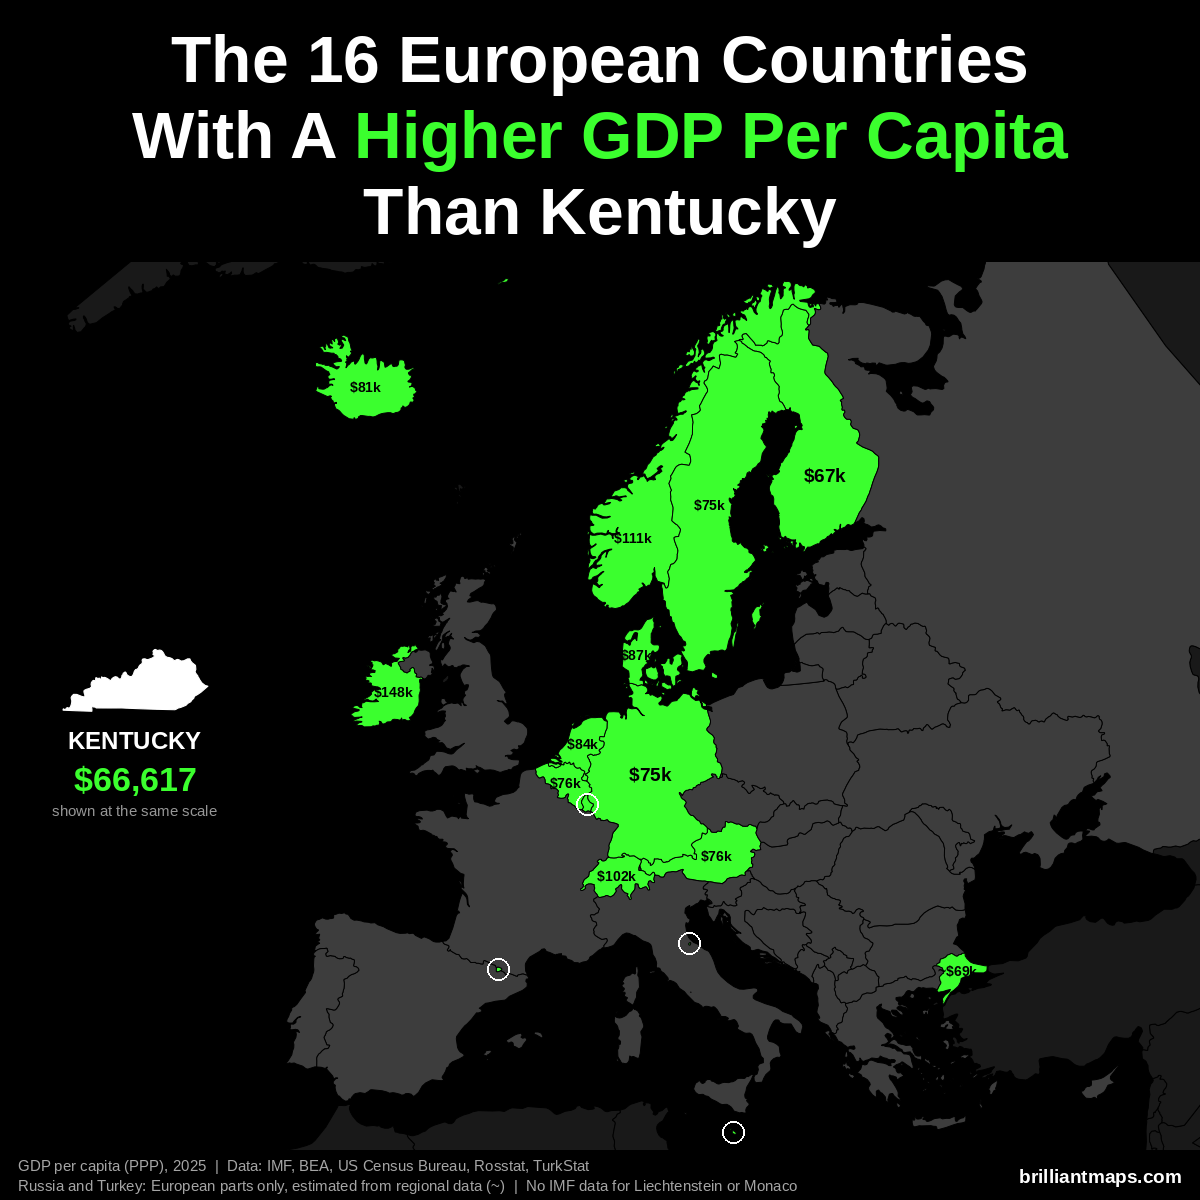
Kentucky has a GDP per capita of $66,617 (2025). 16 European countries have a higher GDP per capita at purchasing power parity:
- Luxembourg: $152,894
- Ireland: $147,825
- Norway: $111,462
- Switzerland: $102,397
- Denmark: $87,303
- Netherlands: $84,445
- San Marino: $83,838
- Iceland: $80,915
- Belgium: $76,136
- Austria: $75,965
- Malta: $75,687
- Germany: $74,901
- Sweden: $74,651
- Andorra: $74,059
- Turkey (European part): ~$68,800
- Finland: $67,097
Liechtenstein and Monaco are not covered by the IMF data and are not counted here.
Kentucky Vs European Size
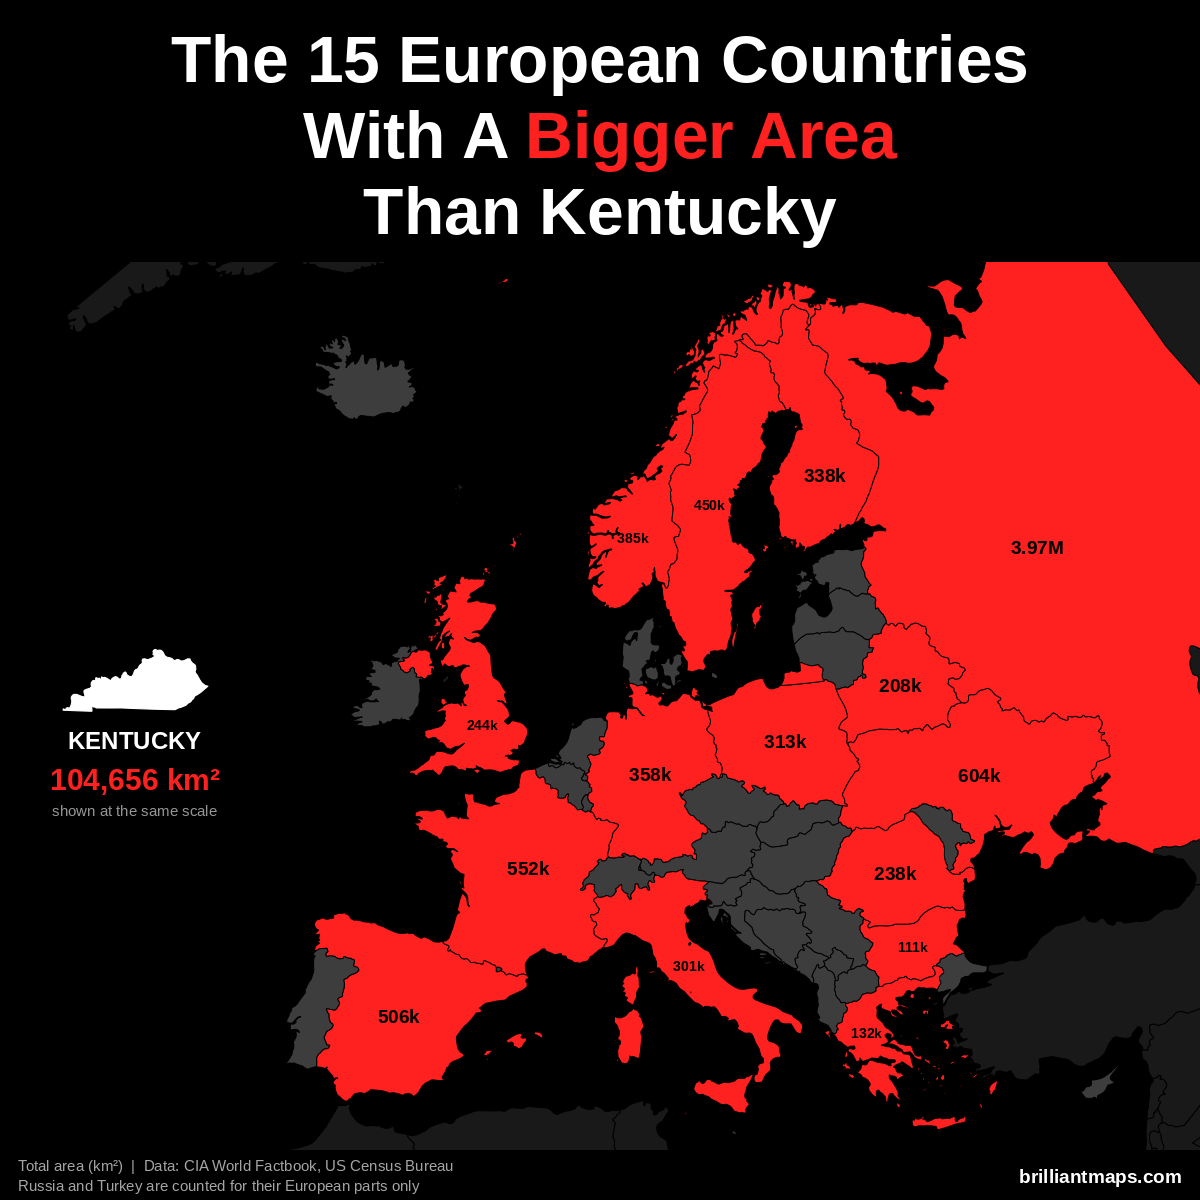
Kentucky has a total area of 104,656 km² (40,408 sq mi). 15 European countries have a bigger area:
- Russia (European part): 3,969,100 km² (1,532,477 sq mi)
- Ukraine: 603,550 km² (233,032 sq mi)
- France: 551,695 km² (213,010 sq mi)
- Spain: 505,990 km² (195,364 sq mi)
- Sweden: 450,295 km² (173,860 sq mi)
- Norway: 385,207 km² (148,729 sq mi)
- Germany: 357,588 km² (138,065 sq mi)
- Finland: 338,455 km² (130,678 sq mi)
- Poland: 312,696 km² (120,733 sq mi)
- Italy: 301,340 km² (116,348 sq mi)
- United Kingdom: 243,610 km² (94,058 sq mi)
- Romania: 238,397 km² (92,046 sq mi)
- Belarus: 207,600 km² (80,155 sq mi)
- Greece: 131,957 km² (50,949 sq mi)
- Bulgaria: 110,994 km² (42,855 sq mi)
Kentucky Vs European Life Expectancy
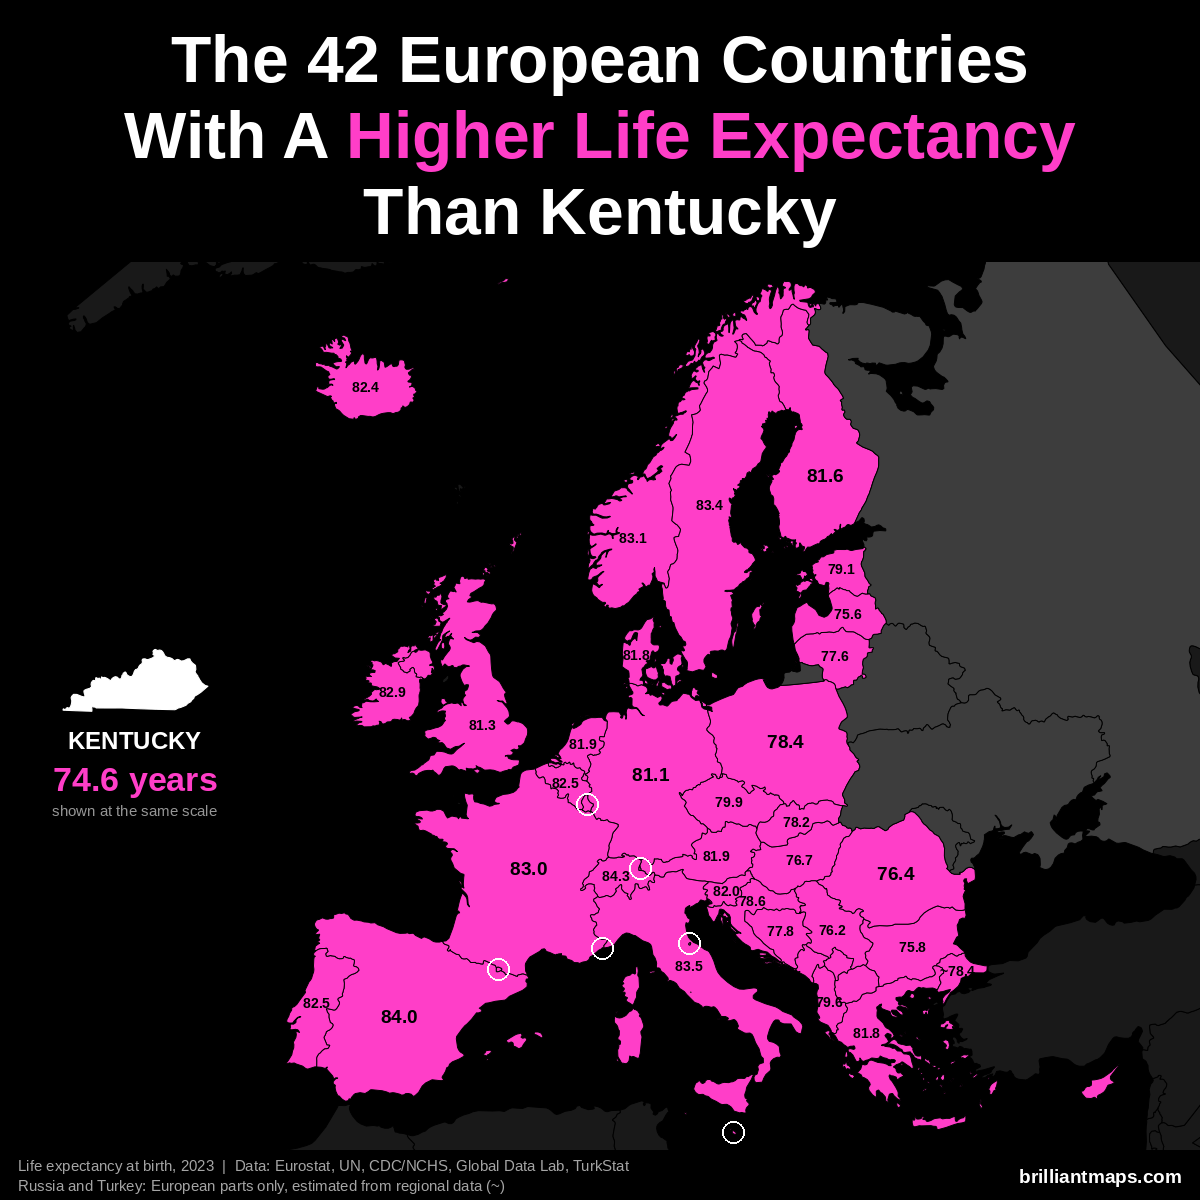
Kentucky has a life expectancy at birth of 74.6 years (2023). 42 European countries have a higher life expectancy:
- Monaco: 86.4 years
- San Marino: 85.7 years
- Liechtenstein: 84.6 years
- Switzerland: 84.3 years
- Andorra: 84.0 years
- Spain: 84.0 years
- Italy: 83.5 years
- Luxembourg: 83.4 years
- Malta: 83.4 years
- Sweden: 83.4 years
- Norway: 83.1 years
- France: 83.0 years
- Cyprus: 82.9 years
- Ireland: 82.9 years
- Belgium: 82.5 years
- Portugal: 82.5 years
- Iceland: 82.4 years
- Slovenia: 82.0 years
- Austria: 81.9 years
- Netherlands: 81.9 years
- Denmark: 81.8 years
- Greece: 81.8 years
- Finland: 81.6 years
- United Kingdom: 81.3 years
- Germany: 81.1 years
- Czechia: 79.9 years
- Albania: 79.6 years
- Estonia: 79.1 years
- Croatia: 78.6 years
- Poland: 78.4 years
- Turkey (European part): ~78.4 years
- Slovakia: 78.2 years
- Kosovo: 78.0 years
- Bosnia and Herzegovina: 77.8 years
- Lithuania: 77.6 years
- Montenegro: 77.6 years
- North Macedonia: 77.4 years
- Hungary: 76.7 years
- Romania: 76.4 years
- Serbia: 76.2 years
- Bulgaria: 75.8 years
- Latvia: 75.6 years
Louisiana vs Europe
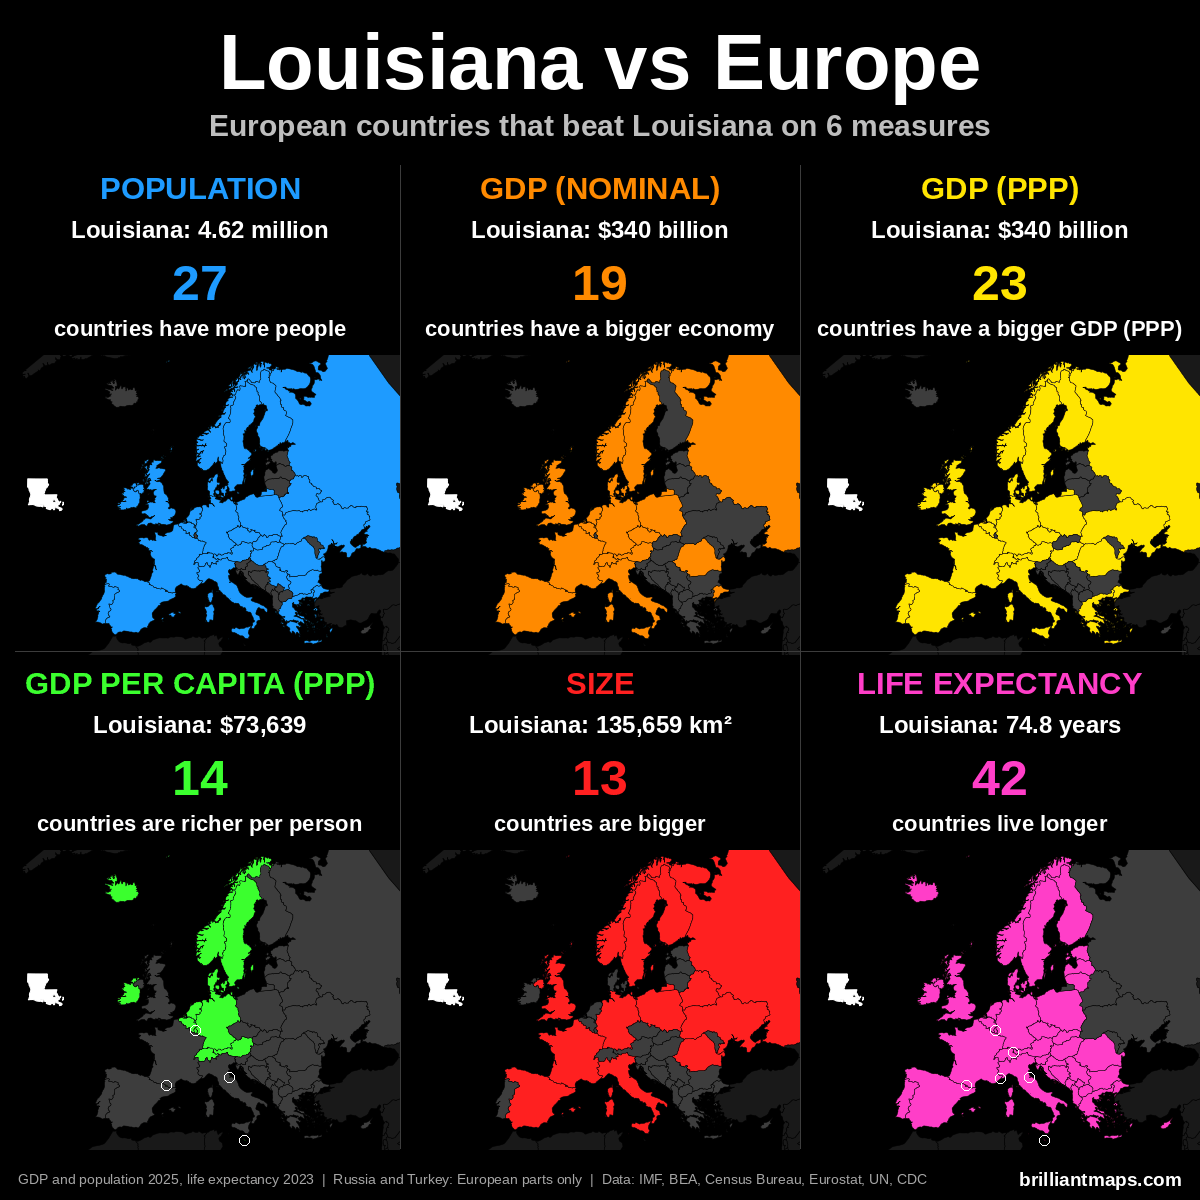
Louisiana Vs European Population
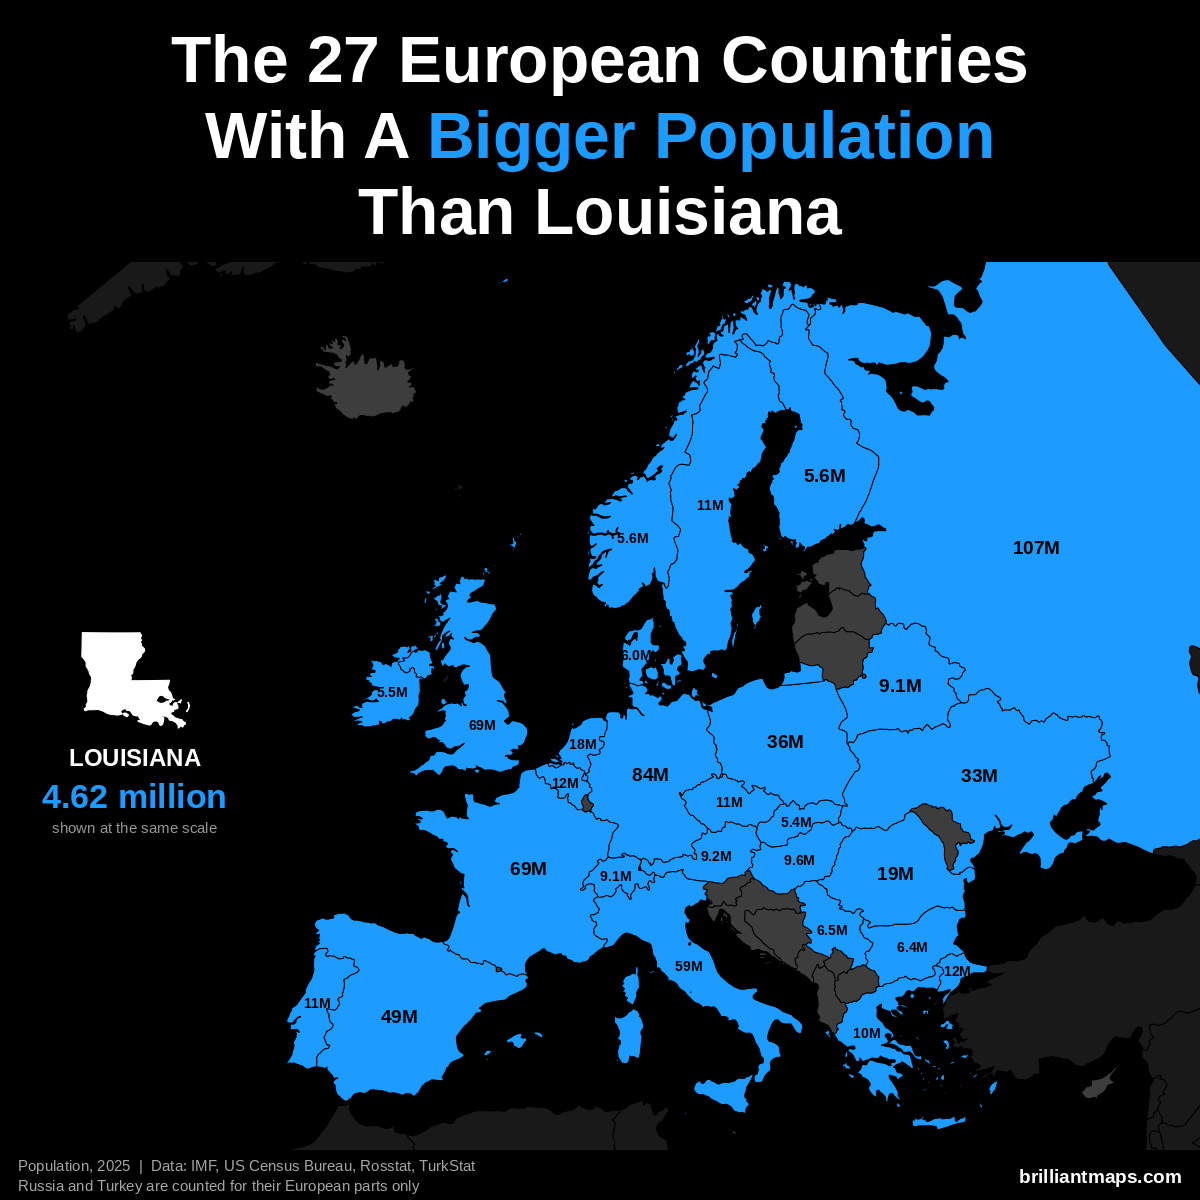
Louisiana has a population of 4.6 million (2025). 27 European countries have a bigger population:
- Russia (European part): 107.0 million
- Germany: 83.5 million
- United Kingdom: 69.5 million
- France: 68.9 million
- Italy: 58.9 million
- Spain: 49.5 million
- Poland: 36.5 million
- Ukraine: 32.9 million
- Romania: 19.0 million
- Netherlands: 18.0 million
- Turkey (European part): 12.2 million
- Belgium: 11.9 million
- Portugal: 10.8 million
- Czechia: 10.8 million
- Sweden: 10.7 million
- Greece: 10.4 million
- Hungary: 9.6 million
- Austria: 9.2 million
- Belarus: 9.1 million
- Switzerland: 9.1 million
- Serbia: 6.5 million
- Bulgaria: 6.4 million
- Denmark: 6.0 million
- Norway: 5.6 million
- Finland: 5.6 million
- Ireland: 5.5 million
- Slovakia: 5.4 million
Louisiana Vs European GDP (Nominal)
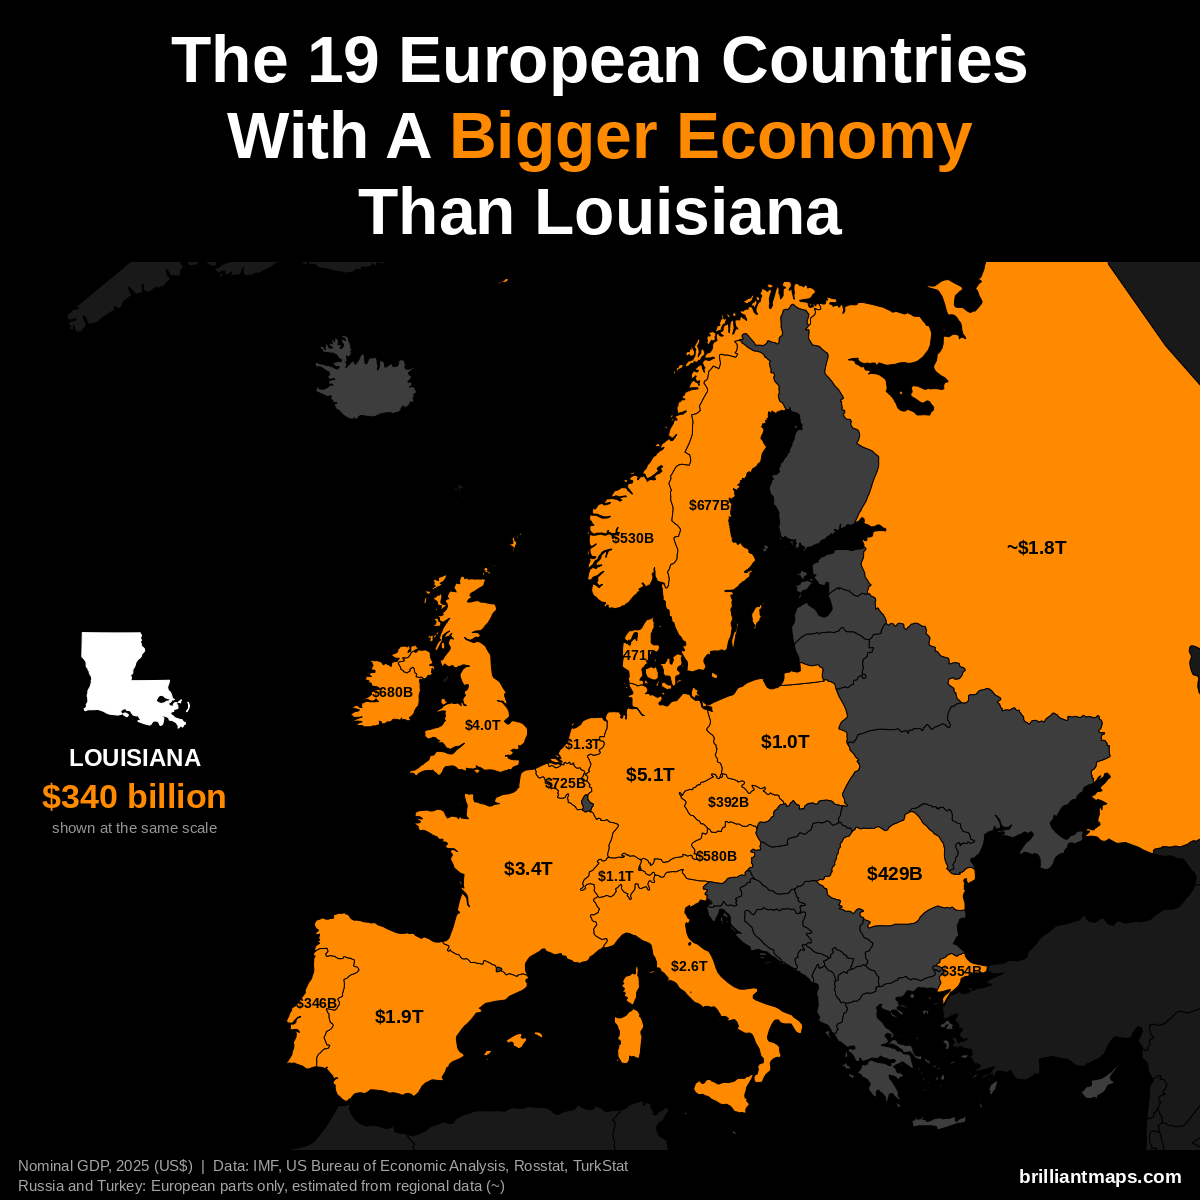
Louisiana has a nominal GDP of $340 billion (2025). 19 European countries have a bigger economy:
- Germany: $5.12 trillion
- United Kingdom: $4.01 trillion
- France: $3.38 trillion
- Italy: $2.55 trillion
- Spain: $1.91 trillion
- Russia (European part): ~$1.83 trillion
- Netherlands: $1.32 trillion
- Switzerland: $1.06 trillion
- Poland: $1.04 trillion
- Belgium: $725 billion
- Ireland: $680 billion
- Sweden: $677 billion
- Austria: $580 billion
- Norway: $530 billion
- Denmark: $471 billion
- Romania: $429 billion
- Czechia: $392 billion
- Turkey (European part): ~$354 billion
- Portugal: $346 billion
Louisiana Vs European GDP (PPP)
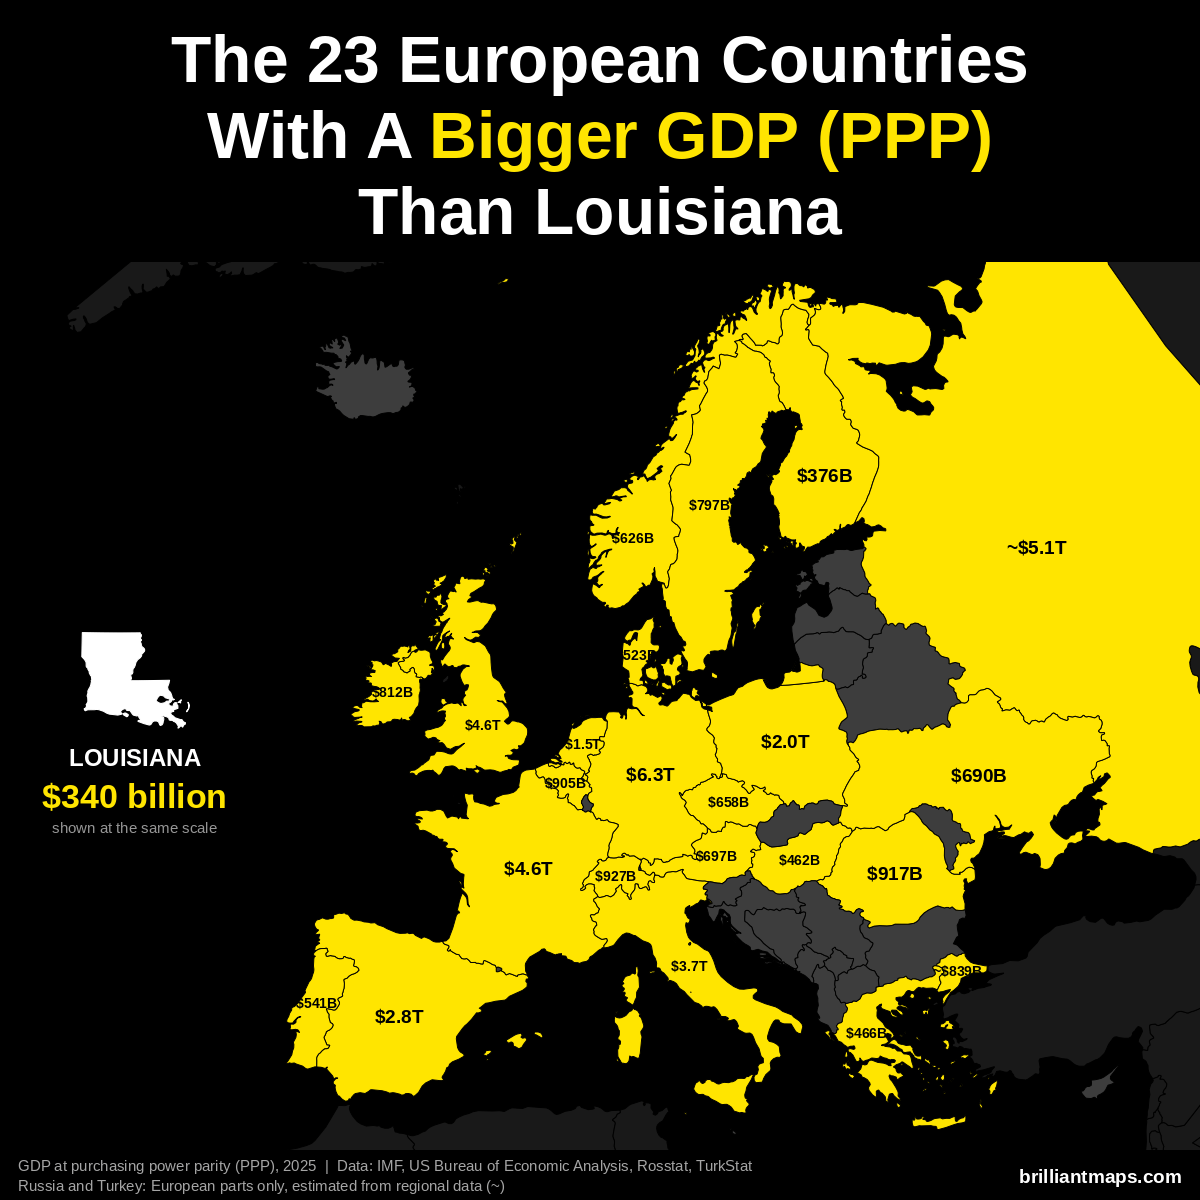
Louisiana has a GDP of $340 billion (2025). US states are already measured in the dollars PPP is based on, so the figure is the same as nominal GDP. 23 European countries have a bigger GDP at purchasing power parity:
- Germany: $6.26 trillion
- Russia (European part): ~$5.14 trillion
- France: $4.58 trillion
- United Kingdom: $4.57 trillion
- Italy: $3.74 trillion
- Spain: $2.83 trillion
- Poland: $2.04 trillion
- Netherlands: $1.52 trillion
- Switzerland: $927 billion
- Romania: $917 billion
- Belgium: $905 billion
- Turkey (European part): ~$839 billion
- Ireland: $812 billion
- Sweden: $797 billion
- Austria: $697 billion
- Ukraine: $690 billion
- Czechia: $658 billion
- Norway: $626 billion
- Portugal: $541 billion
- Denmark: $523 billion
- Greece: $466 billion
- Hungary: $462 billion
- Finland: $376 billion
Louisiana Vs European GDP Per Capita (PPP)
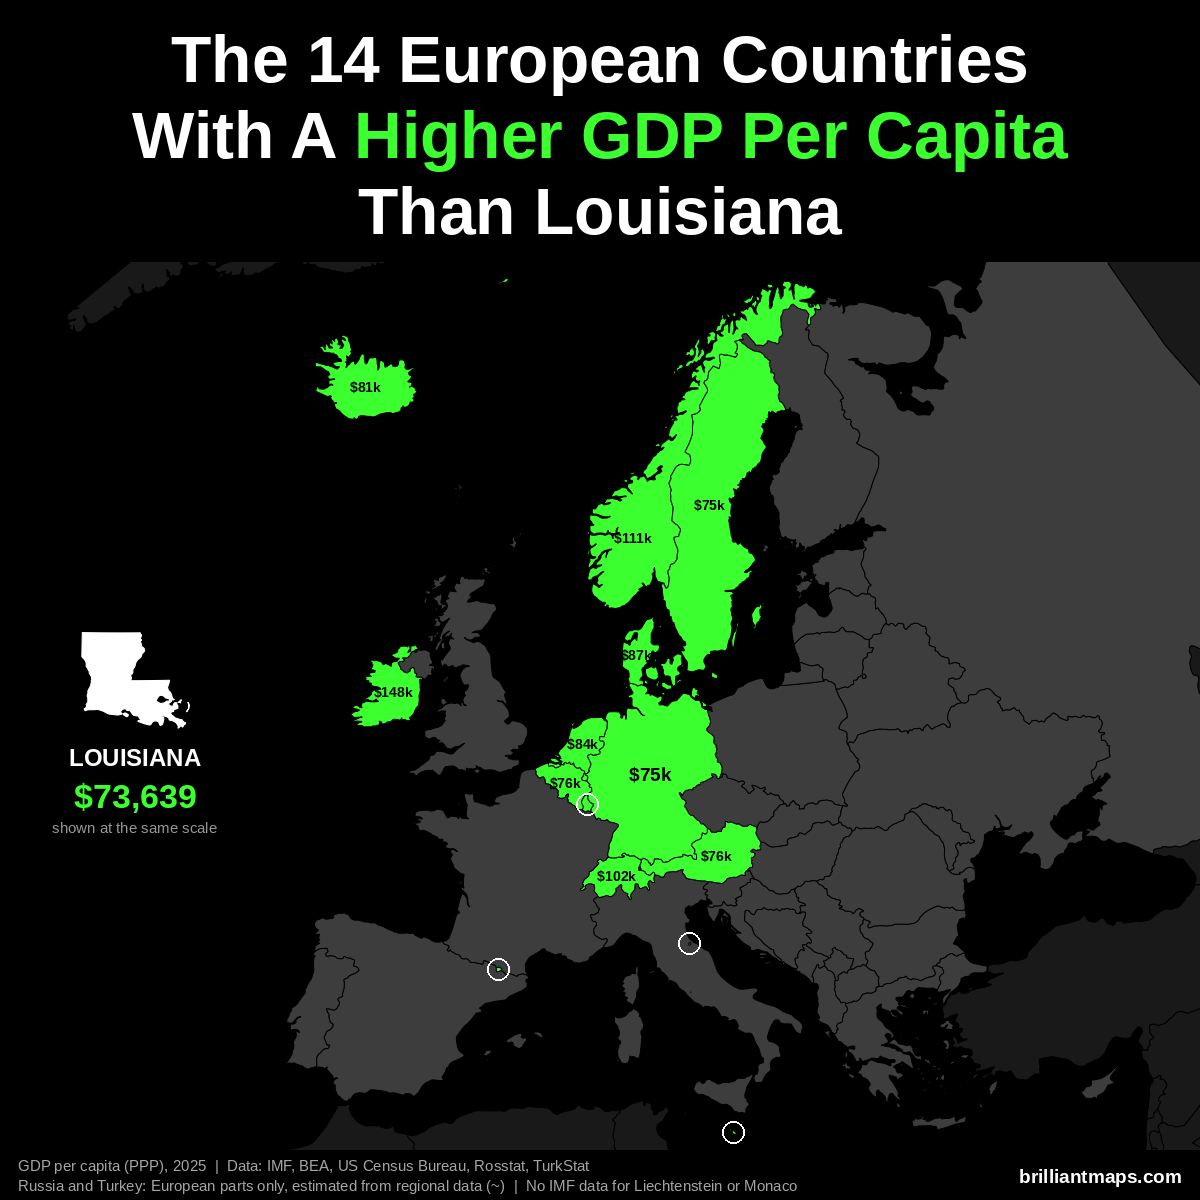
Louisiana has a GDP per capita of $73,639 (2025). 14 European countries have a higher GDP per capita at purchasing power parity:
- Luxembourg: $152,894
- Ireland: $147,825
- Norway: $111,462
- Switzerland: $102,397
- Denmark: $87,303
- Netherlands: $84,445
- San Marino: $83,838
- Iceland: $80,915
- Belgium: $76,136
- Austria: $75,965
- Malta: $75,687
- Germany: $74,901
- Sweden: $74,651
- Andorra: $74,059
Liechtenstein and Monaco are not covered by the IMF data and are not counted here.
Louisiana Vs European Size
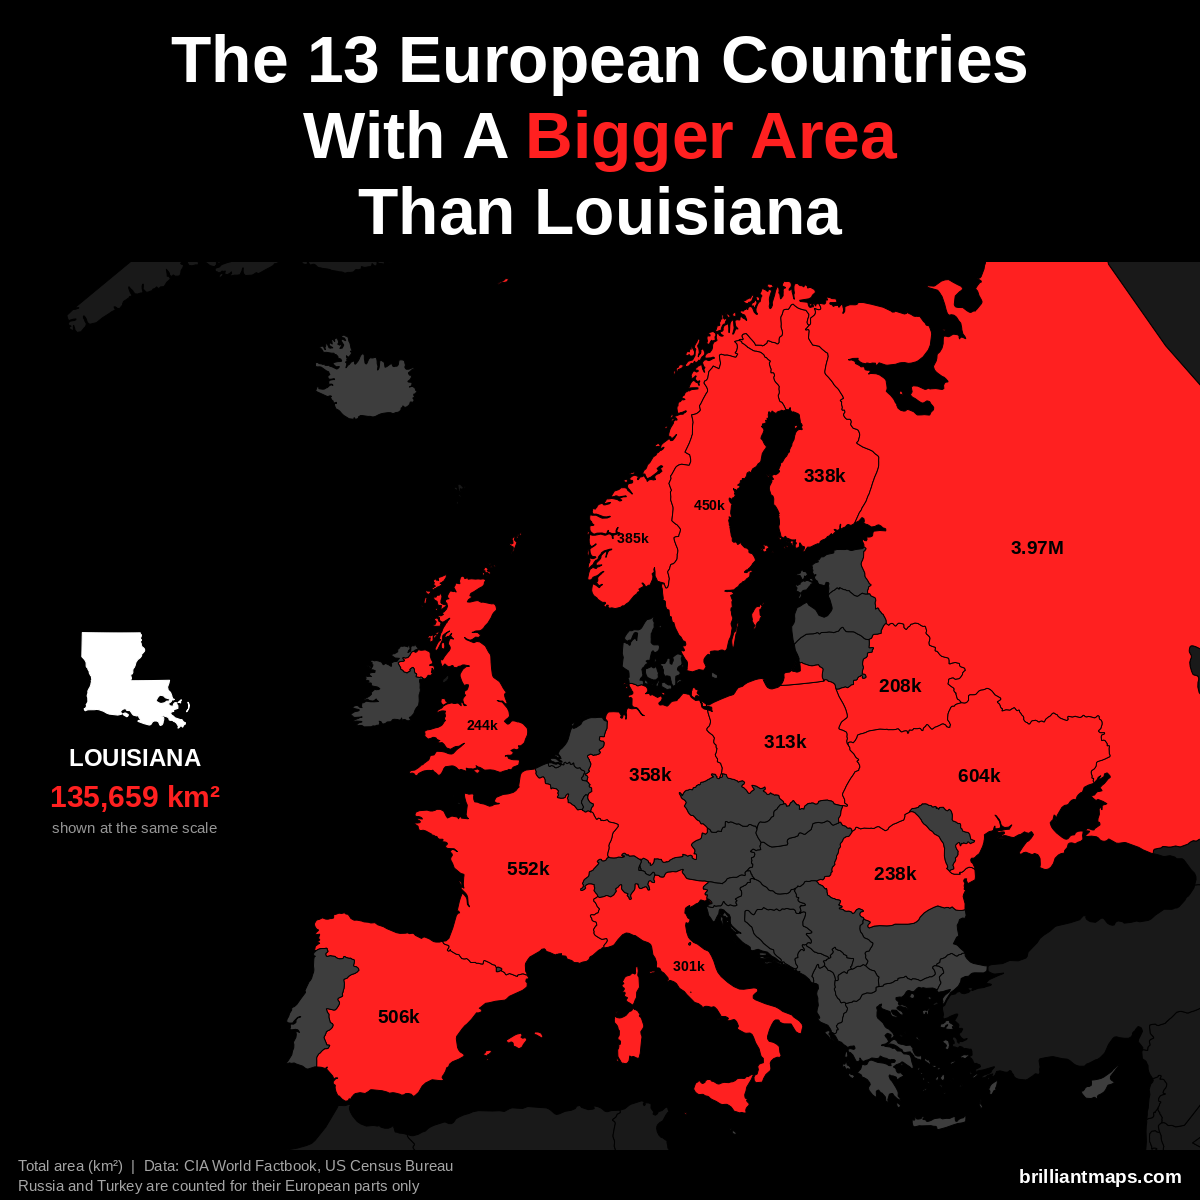
Louisiana has a total area of 135,659 km² (52,378 sq mi). 13 European countries have a bigger area:
- Russia (European part): 3,969,100 km² (1,532,477 sq mi)
- Ukraine: 603,550 km² (233,032 sq mi)
- France: 551,695 km² (213,010 sq mi)
- Spain: 505,990 km² (195,364 sq mi)
- Sweden: 450,295 km² (173,860 sq mi)
- Norway: 385,207 km² (148,729 sq mi)
- Germany: 357,588 km² (138,065 sq mi)
- Finland: 338,455 km² (130,678 sq mi)
- Poland: 312,696 km² (120,733 sq mi)
- Italy: 301,340 km² (116,348 sq mi)
- United Kingdom: 243,610 km² (94,058 sq mi)
- Romania: 238,397 km² (92,046 sq mi)
- Belarus: 207,600 km² (80,155 sq mi)
Louisiana Vs European Life Expectancy
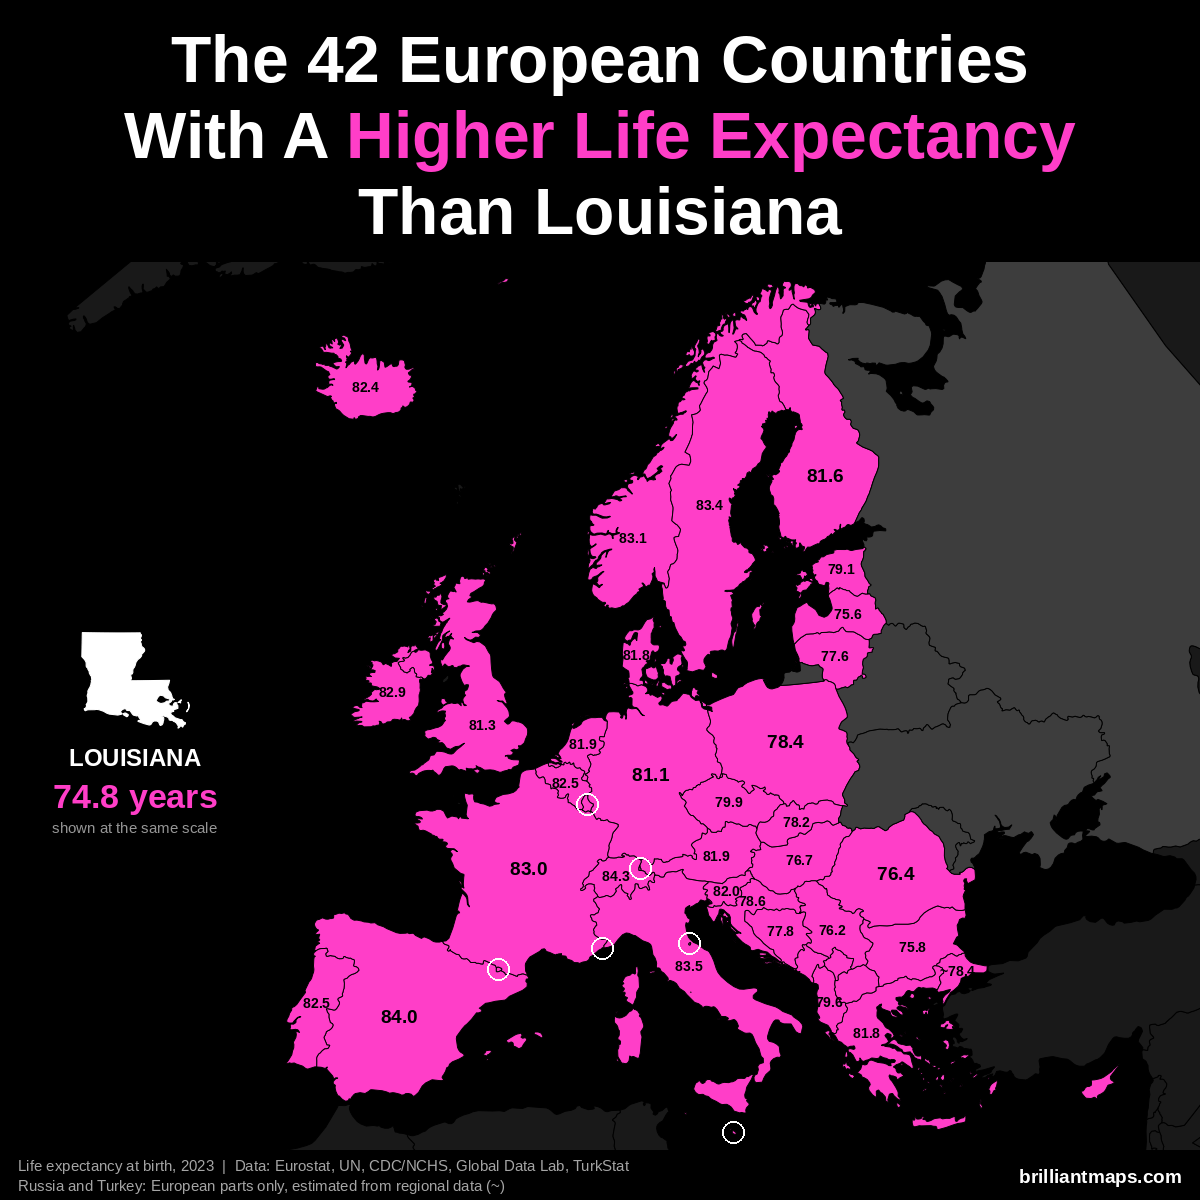
Louisiana has a life expectancy at birth of 74.8 years (2023). 42 European countries have a higher life expectancy:
- Monaco: 86.4 years
- San Marino: 85.7 years
- Liechtenstein: 84.6 years
- Switzerland: 84.3 years
- Andorra: 84.0 years
- Spain: 84.0 years
- Italy: 83.5 years
- Luxembourg: 83.4 years
- Malta: 83.4 years
- Sweden: 83.4 years
- Norway: 83.1 years
- France: 83.0 years
- Cyprus: 82.9 years
- Ireland: 82.9 years
- Belgium: 82.5 years
- Portugal: 82.5 years
- Iceland: 82.4 years
- Slovenia: 82.0 years
- Austria: 81.9 years
- Netherlands: 81.9 years
- Denmark: 81.8 years
- Greece: 81.8 years
- Finland: 81.6 years
- United Kingdom: 81.3 years
- Germany: 81.1 years
- Czechia: 79.9 years
- Albania: 79.6 years
- Estonia: 79.1 years
- Croatia: 78.6 years
- Poland: 78.4 years
- Turkey (European part): ~78.4 years
- Slovakia: 78.2 years
- Kosovo: 78.0 years
- Bosnia and Herzegovina: 77.8 years
- Lithuania: 77.6 years
- Montenegro: 77.6 years
- North Macedonia: 77.4 years
- Hungary: 76.7 years
- Romania: 76.4 years
- Serbia: 76.2 years
- Bulgaria: 75.8 years
- Latvia: 75.6 years
Maine vs Europe
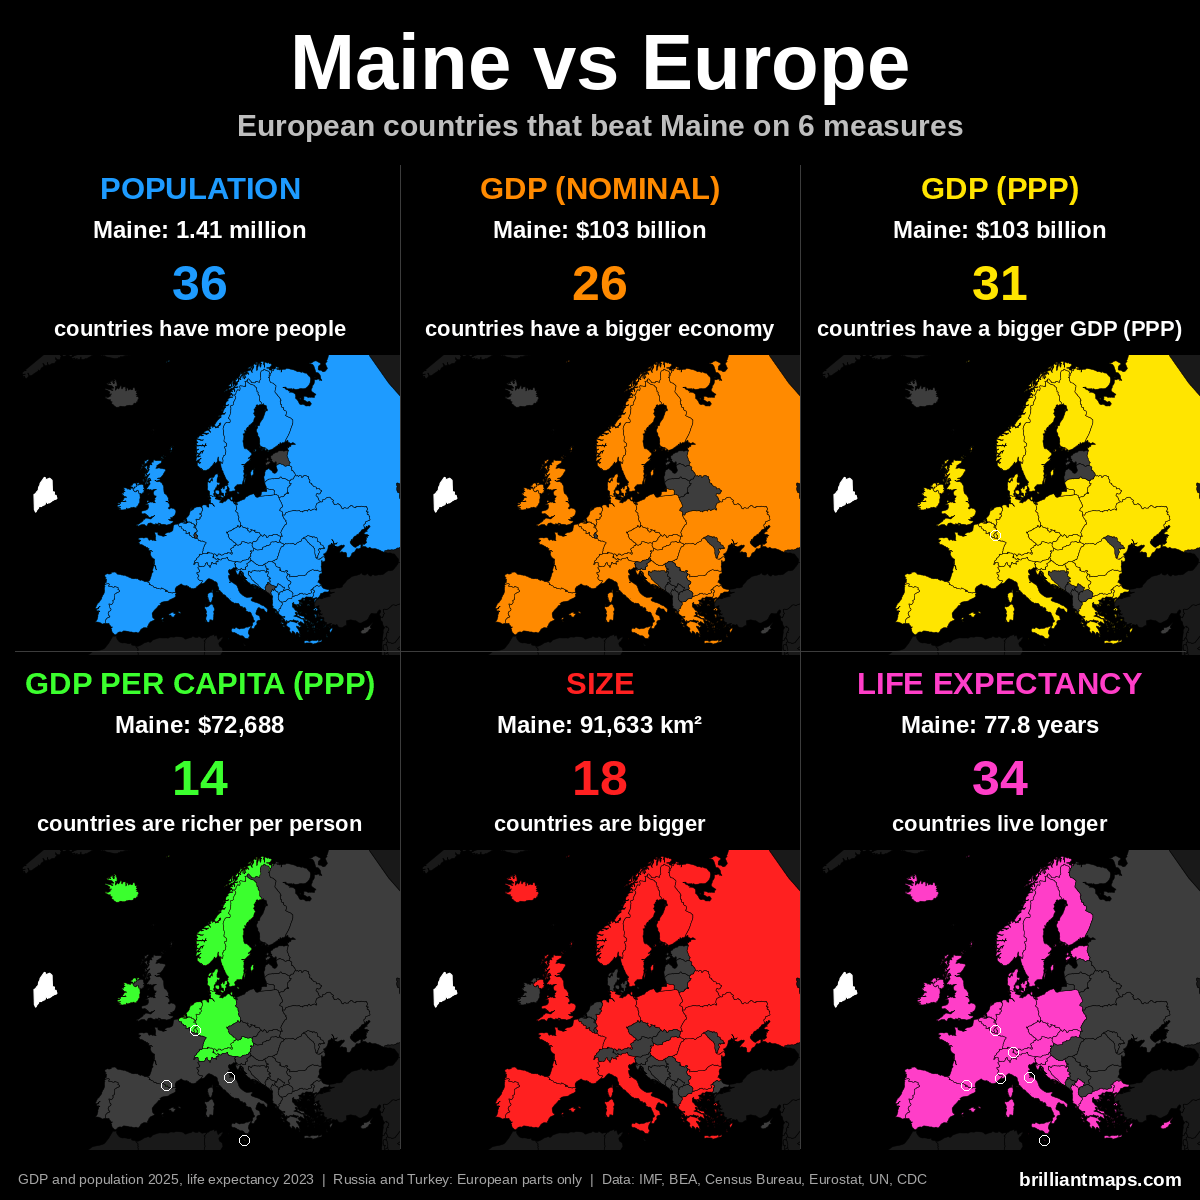
Maine Vs European Population
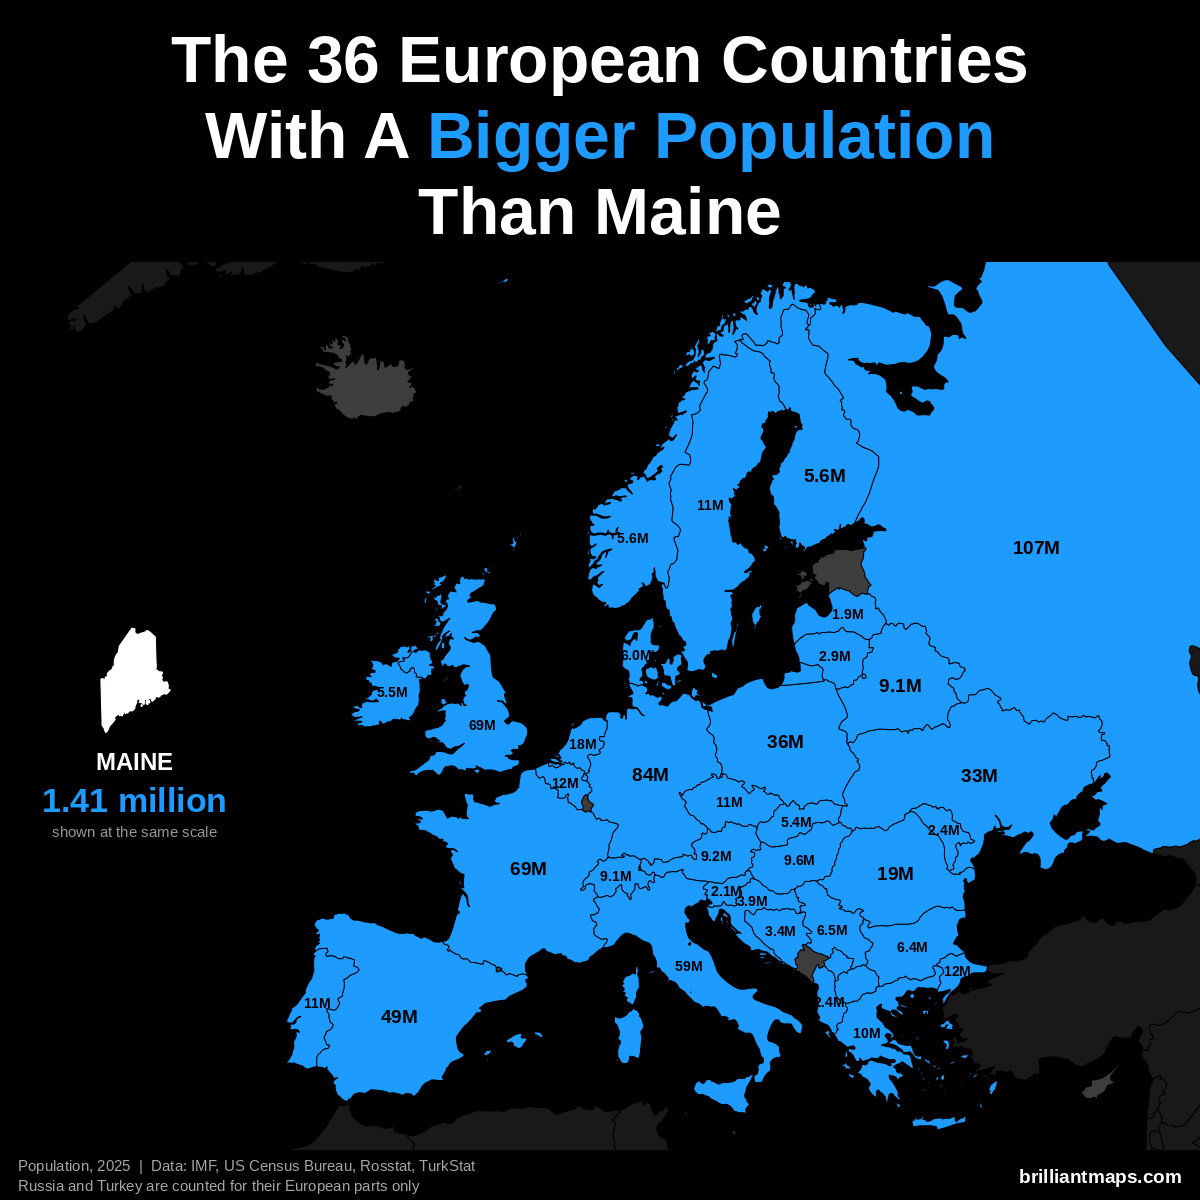
Maine has a population of 1.4 million (2025). 36 European countries have a bigger population:
- Russia (European part): 107.0 million
- Germany: 83.5 million
- United Kingdom: 69.5 million
- France: 68.9 million
- Italy: 58.9 million
- Spain: 49.5 million
- Poland: 36.5 million
- Ukraine: 32.9 million
- Romania: 19.0 million
- Netherlands: 18.0 million
- Turkey (European part): 12.2 million
- Belgium: 11.9 million
- Portugal: 10.8 million
- Czechia: 10.8 million
- Sweden: 10.7 million
- Greece: 10.4 million
- Hungary: 9.6 million
- Austria: 9.2 million
- Belarus: 9.1 million
- Switzerland: 9.1 million
- Serbia: 6.5 million
- Bulgaria: 6.4 million
- Denmark: 6.0 million
- Norway: 5.6 million
- Finland: 5.6 million
- Ireland: 5.5 million
- Slovakia: 5.4 million
- Croatia: 3.9 million
- Bosnia and Herzegovina: 3.4 million
- Lithuania: 2.9 million
- Moldova: 2.4 million
- Albania: 2.4 million
- Slovenia: 2.1 million
- Latvia: 1.9 million
- North Macedonia: 1.8 million
- Kosovo: 1.6 million
Maine Vs European GDP (Nominal)
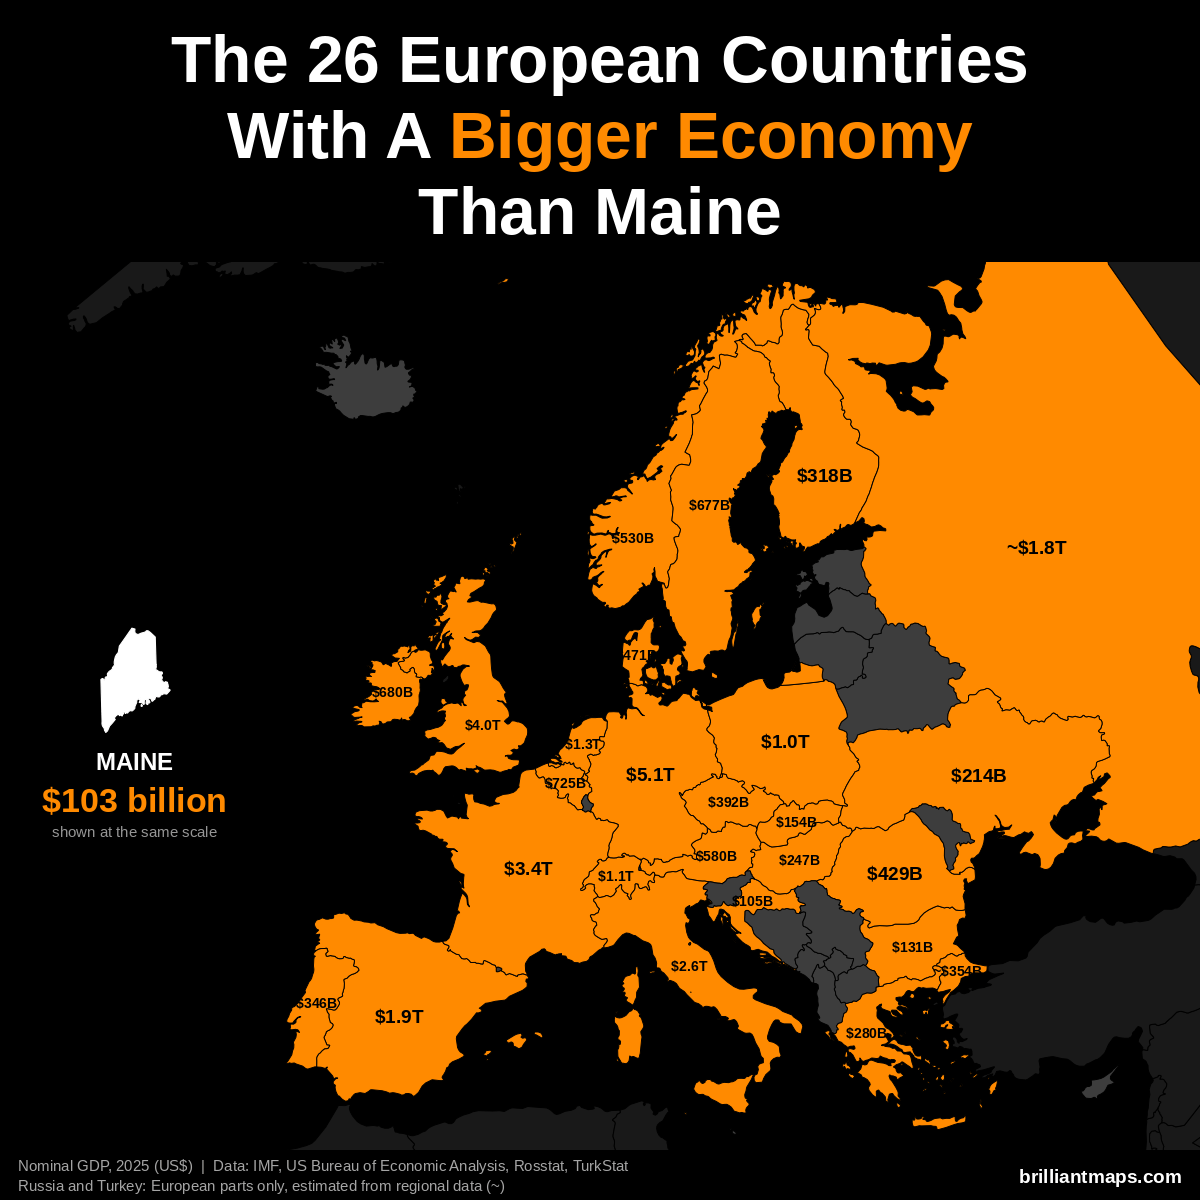
Maine has a nominal GDP of $103 billion (2025). 26 European countries have a bigger economy:
- Germany: $5.12 trillion
- United Kingdom: $4.01 trillion
- France: $3.38 trillion
- Italy: $2.55 trillion
- Spain: $1.91 trillion
- Russia (European part): ~$1.83 trillion
- Netherlands: $1.32 trillion
- Switzerland: $1.06 trillion
- Poland: $1.04 trillion
- Belgium: $725 billion
- Ireland: $680 billion
- Sweden: $677 billion
- Austria: $580 billion
- Norway: $530 billion
- Denmark: $471 billion
- Romania: $429 billion
- Czechia: $392 billion
- Turkey (European part): ~$354 billion
- Portugal: $346 billion
- Finland: $318 billion
- Greece: $280 billion
- Hungary: $247 billion
- Ukraine: $214 billion
- Slovakia: $154 billion
- Bulgaria: $131 billion
- Croatia: $105 billion
Maine Vs European GDP (PPP)
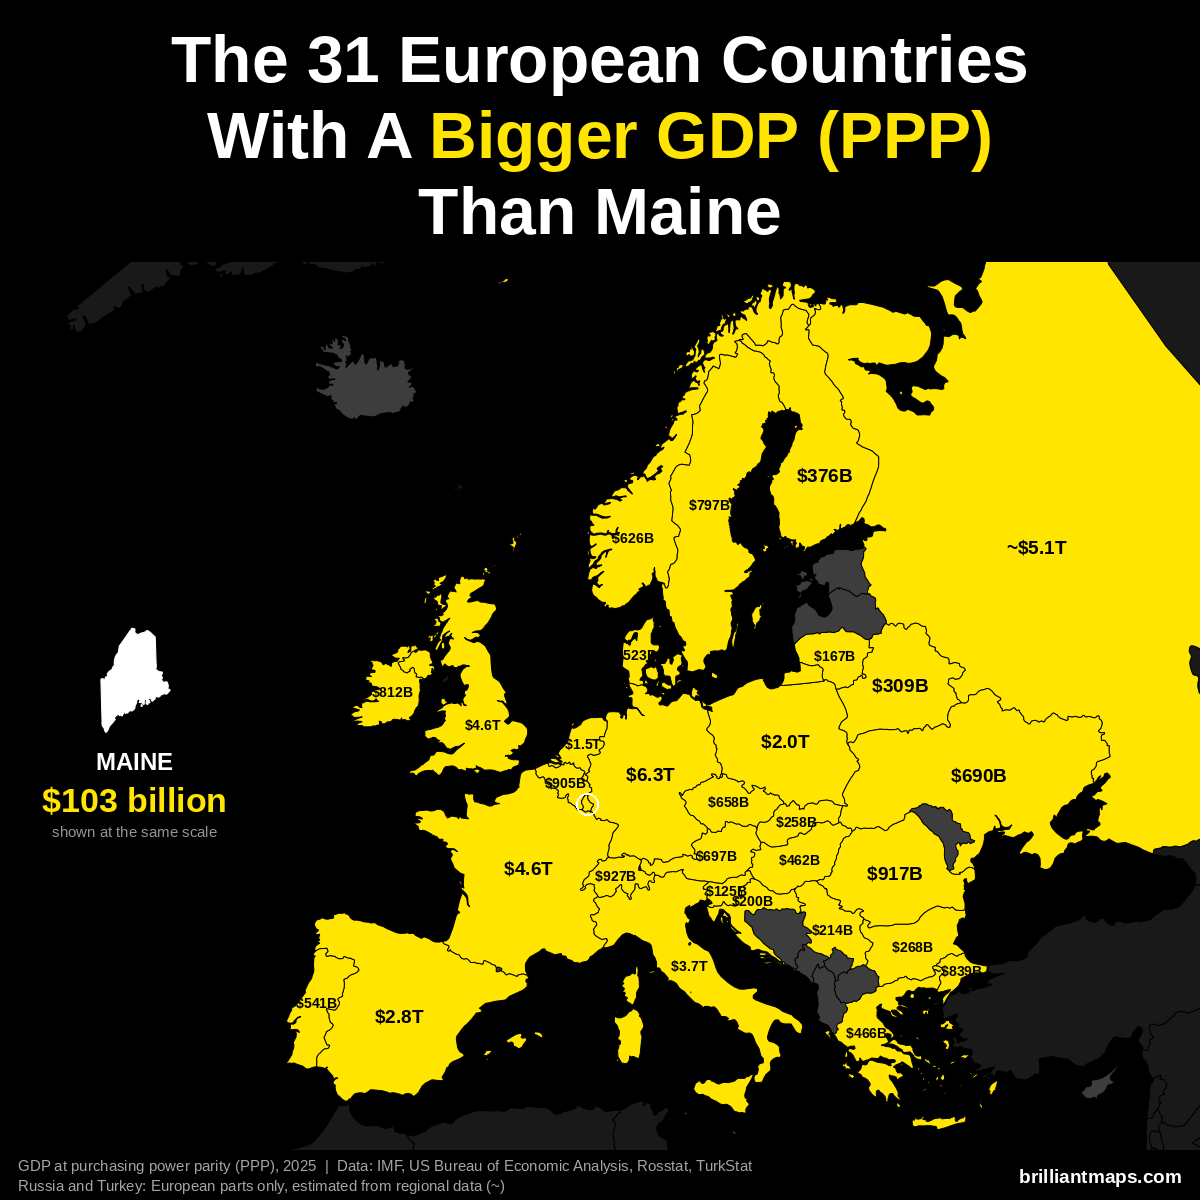
Maine has a GDP of $103 billion (2025). US states are already measured in the dollars PPP is based on, so the figure is the same as nominal GDP. 31 European countries have a bigger GDP at purchasing power parity:
- Germany: $6.26 trillion
- Russia (European part): ~$5.14 trillion
- France: $4.58 trillion
- United Kingdom: $4.57 trillion
- Italy: $3.74 trillion
- Spain: $2.83 trillion
- Poland: $2.04 trillion
- Netherlands: $1.52 trillion
- Switzerland: $927 billion
- Romania: $917 billion
- Belgium: $905 billion
- Turkey (European part): ~$839 billion
- Ireland: $812 billion
- Sweden: $797 billion
- Austria: $697 billion
- Ukraine: $690 billion
- Czechia: $658 billion
- Norway: $626 billion
- Portugal: $541 billion
- Denmark: $523 billion
- Greece: $466 billion
- Hungary: $462 billion
- Finland: $376 billion
- Belarus: $309 billion
- Bulgaria: $268 billion
- Slovakia: $258 billion
- Serbia: $214 billion
- Croatia: $200 billion
- Lithuania: $167 billion
- Slovenia: $125 billion
- Luxembourg: $104 billion
Maine Vs European GDP Per Capita (PPP)
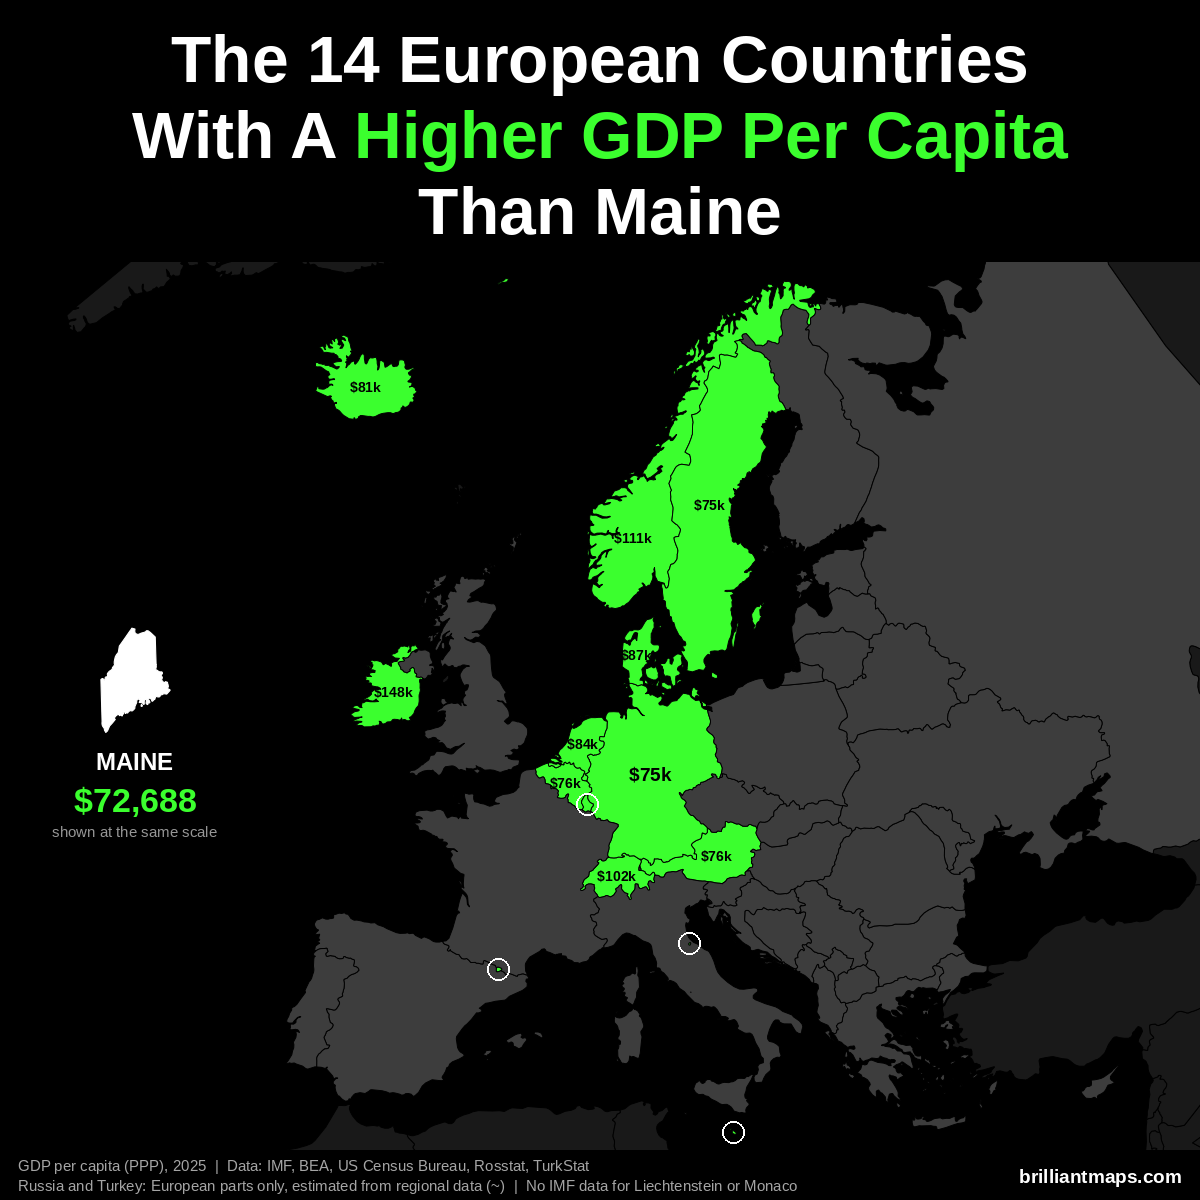
Maine has a GDP per capita of $72,688 (2025). 14 European countries have a higher GDP per capita at purchasing power parity:
- Luxembourg: $152,894
- Ireland: $147,825
- Norway: $111,462
- Switzerland: $102,397
- Denmark: $87,303
- Netherlands: $84,445
- San Marino: $83,838
- Iceland: $80,915
- Belgium: $76,136
- Austria: $75,965
- Malta: $75,687
- Germany: $74,901
- Sweden: $74,651
- Andorra: $74,059
Liechtenstein and Monaco are not covered by the IMF data and are not counted here.
Maine Vs European Size
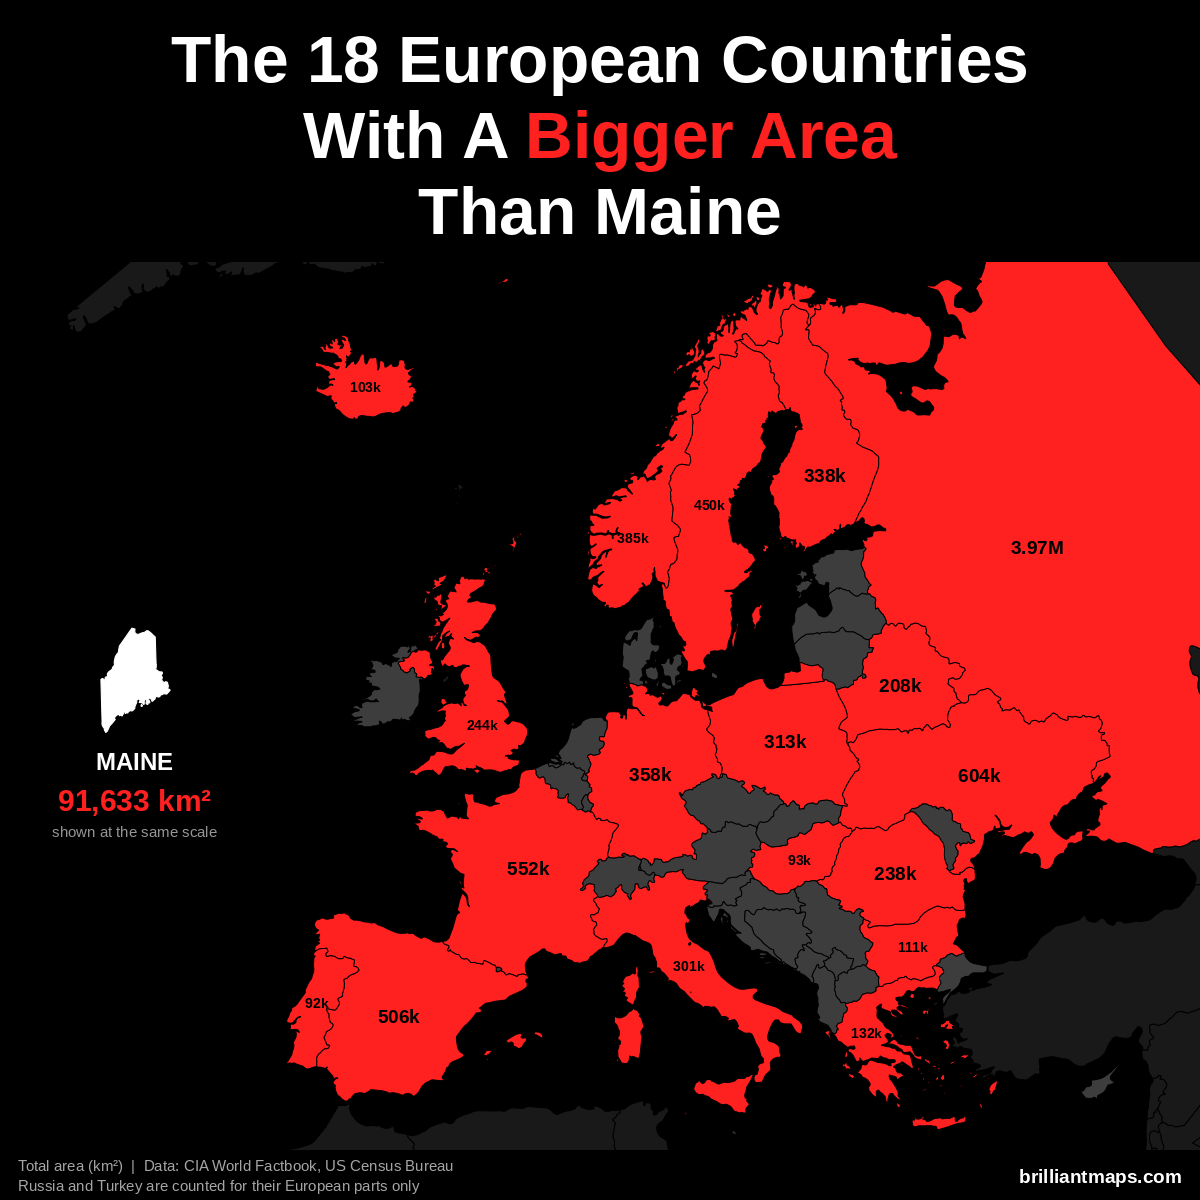
Maine has a total area of 91,633 km² (35,380 sq mi). 18 European countries have a bigger area:
- Russia (European part): 3,969,100 km² (1,532,477 sq mi)
- Ukraine: 603,550 km² (233,032 sq mi)
- France: 551,695 km² (213,010 sq mi)
- Spain: 505,990 km² (195,364 sq mi)
- Sweden: 450,295 km² (173,860 sq mi)
- Norway: 385,207 km² (148,729 sq mi)
- Germany: 357,588 km² (138,065 sq mi)
- Finland: 338,455 km² (130,678 sq mi)
- Poland: 312,696 km² (120,733 sq mi)
- Italy: 301,340 km² (116,348 sq mi)
- United Kingdom: 243,610 km² (94,058 sq mi)
- Romania: 238,397 km² (92,046 sq mi)
- Belarus: 207,600 km² (80,155 sq mi)
- Greece: 131,957 km² (50,949 sq mi)
- Bulgaria: 110,994 km² (42,855 sq mi)
- Iceland: 103,000 km² (39,768 sq mi)
- Hungary: 93,028 km² (35,918 sq mi)
- Portugal: 92,212 km² (35,603 sq mi)
Maine Vs European Life Expectancy
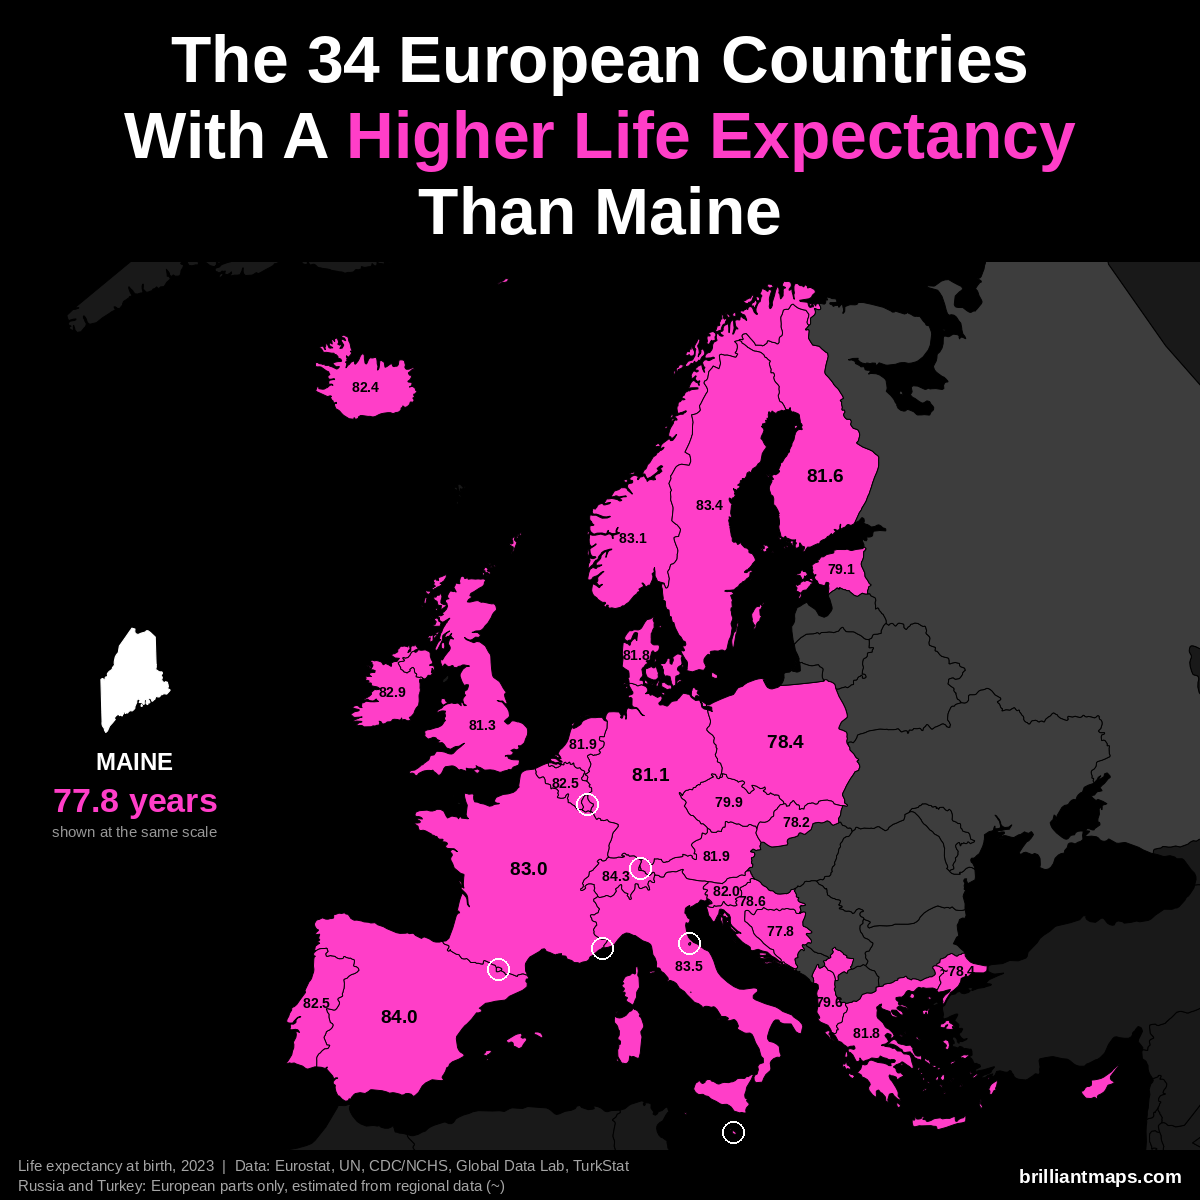
Maine has a life expectancy at birth of 77.8 years (2023). 34 European countries have a higher life expectancy:
- Monaco: 86.4 years
- San Marino: 85.7 years
- Liechtenstein: 84.6 years
- Switzerland: 84.3 years
- Andorra: 84.0 years
- Spain: 84.0 years
- Italy: 83.5 years
- Luxembourg: 83.4 years
- Malta: 83.4 years
- Sweden: 83.4 years
- Norway: 83.1 years
- France: 83.0 years
- Cyprus: 82.9 years
- Ireland: 82.9 years
- Belgium: 82.5 years
- Portugal: 82.5 years
- Iceland: 82.4 years
- Slovenia: 82.0 years
- Austria: 81.9 years
- Netherlands: 81.9 years
- Denmark: 81.8 years
- Greece: 81.8 years
- Finland: 81.6 years
- United Kingdom: 81.3 years
- Germany: 81.1 years
- Czechia: 79.9 years
- Albania: 79.6 years
- Estonia: 79.1 years
- Croatia: 78.6 years
- Poland: 78.4 years
- Turkey (European part): ~78.4 years
- Slovakia: 78.2 years
- Kosovo: 78.0 years
- Bosnia and Herzegovina: 77.8 years
Maryland vs Europe
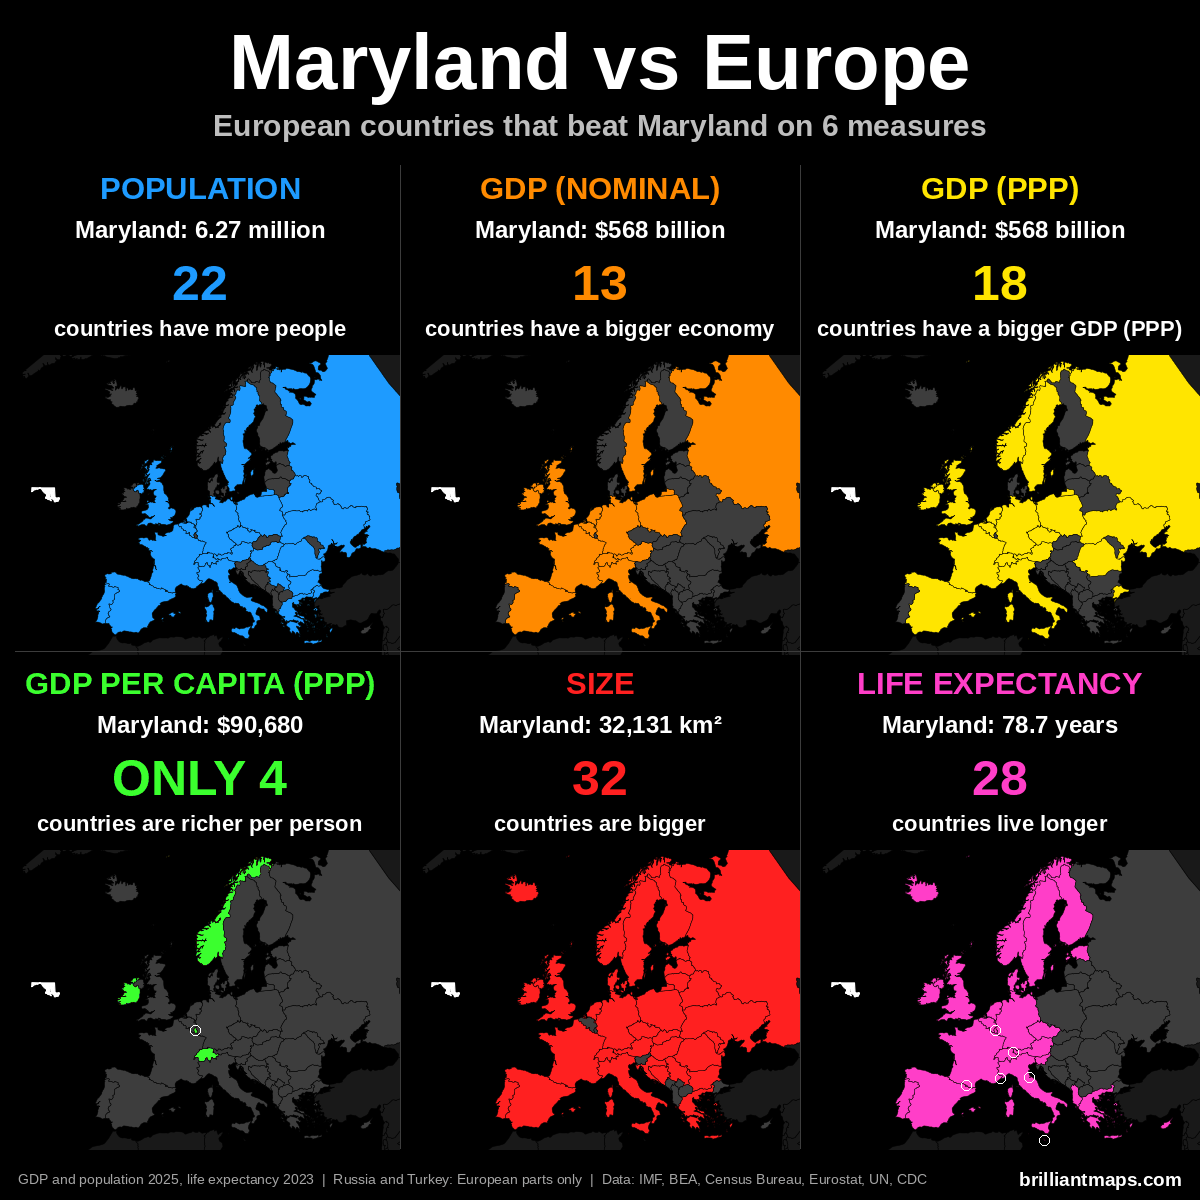
Maryland Vs European Population
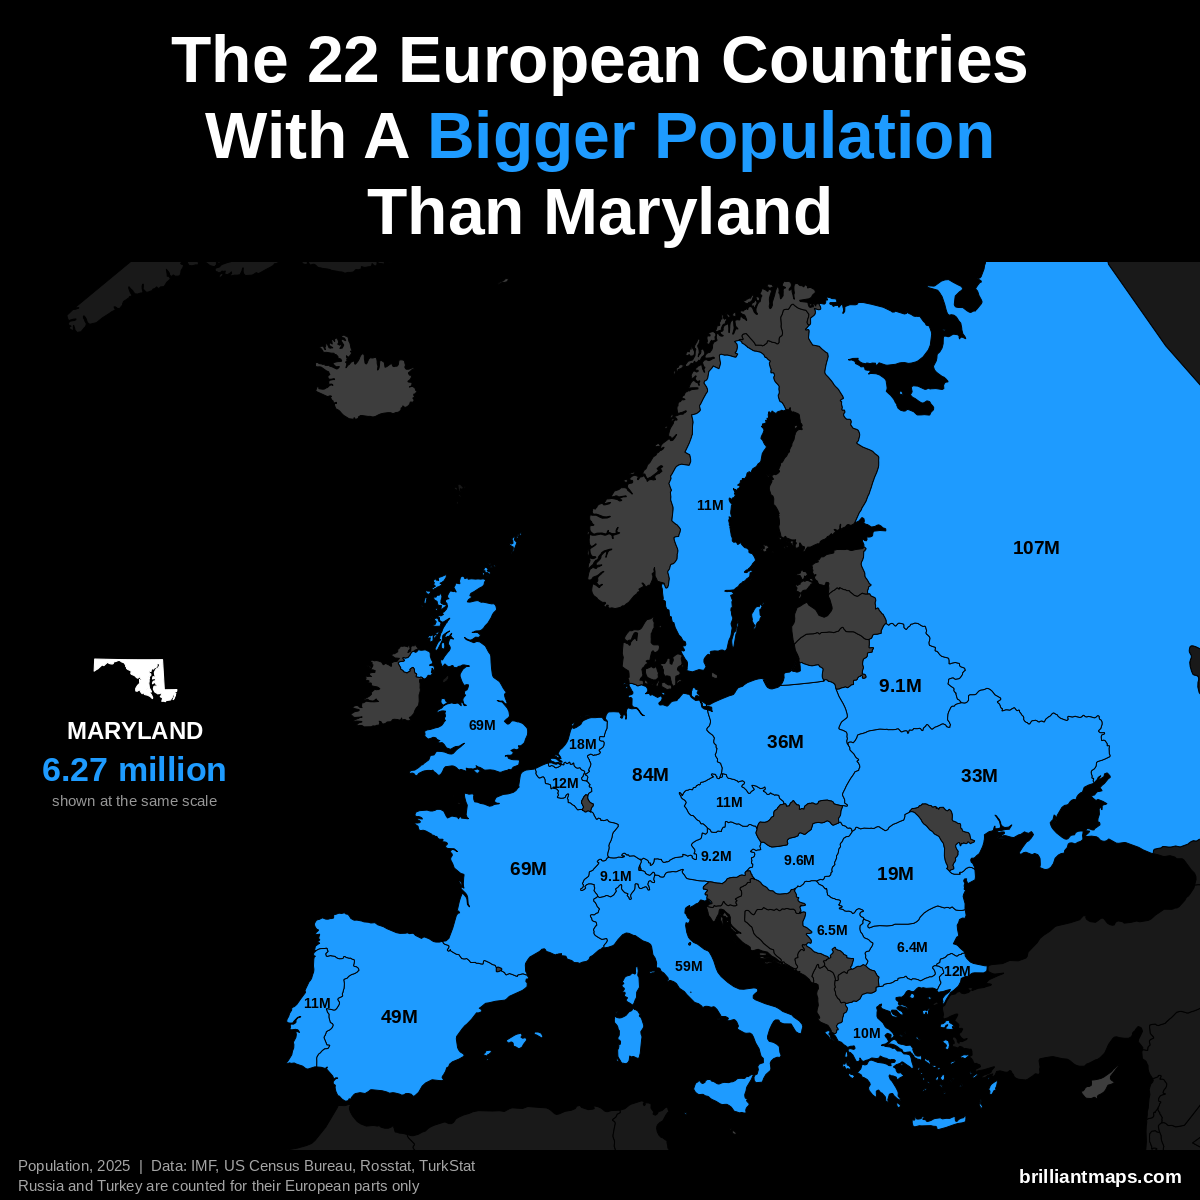
Maryland has a population of 6.3 million (2025). 22 European countries have a bigger population:
- Russia (European part): 107.0 million
- Germany: 83.5 million
- United Kingdom: 69.5 million
- France: 68.9 million
- Italy: 58.9 million
- Spain: 49.5 million
- Poland: 36.5 million
- Ukraine: 32.9 million
- Romania: 19.0 million
- Netherlands: 18.0 million
- Turkey (European part): 12.2 million
- Belgium: 11.9 million
- Portugal: 10.8 million
- Czechia: 10.8 million
- Sweden: 10.7 million
- Greece: 10.4 million
- Hungary: 9.6 million
- Austria: 9.2 million
- Belarus: 9.1 million
- Switzerland: 9.1 million
- Serbia: 6.5 million
- Bulgaria: 6.4 million
Maryland Vs European GDP (Nominal)
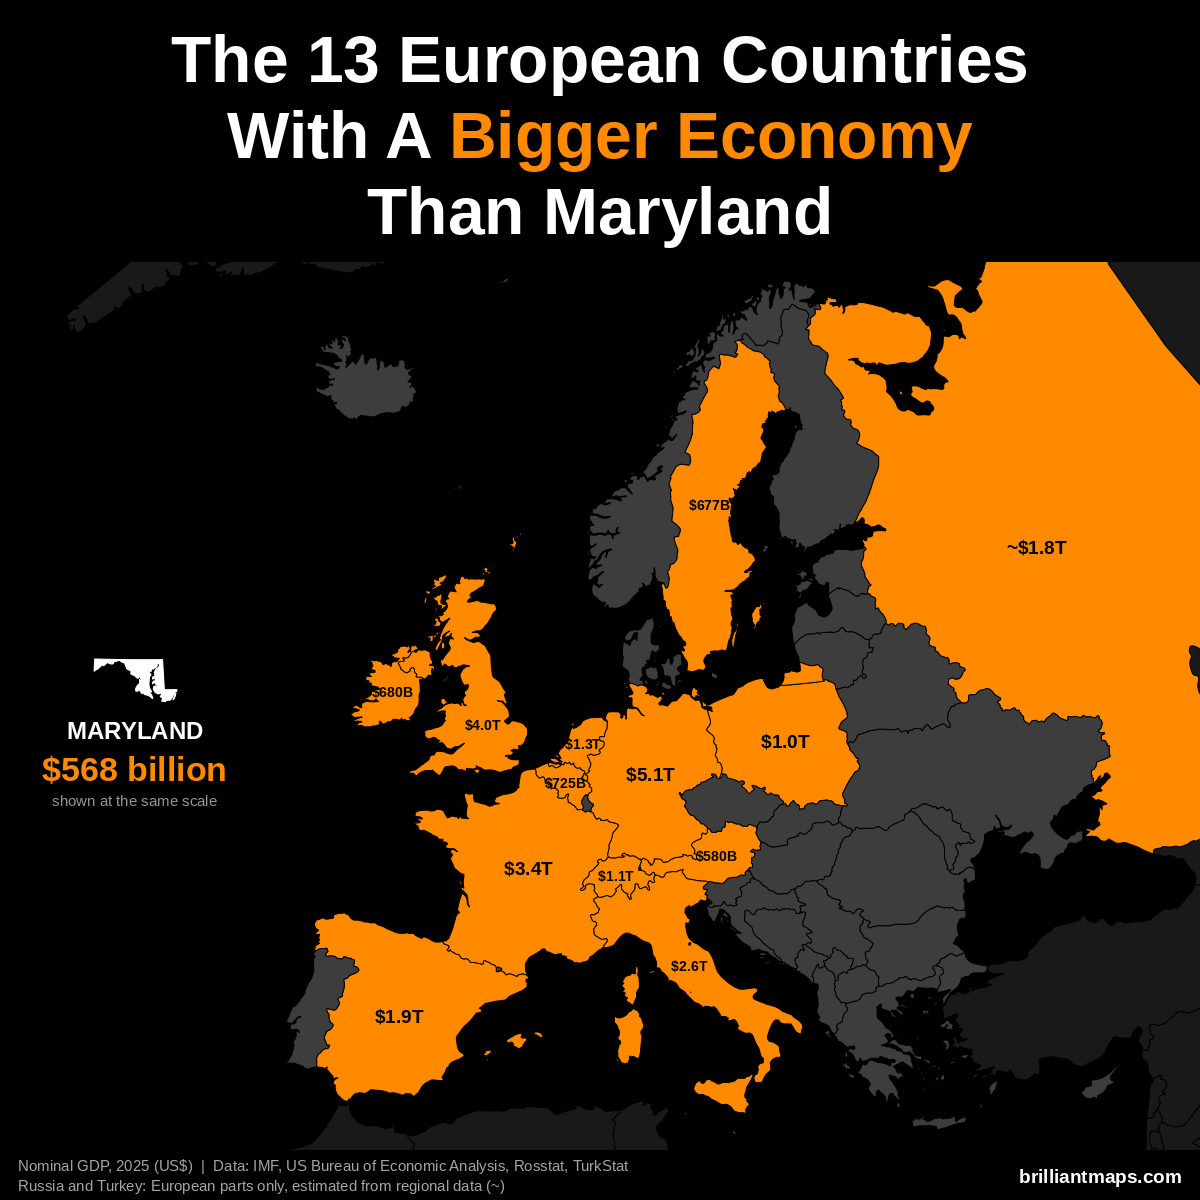
Maryland has a nominal GDP of $568 billion (2025). 13 European countries have a bigger economy:
- Germany: $5.12 trillion
- United Kingdom: $4.01 trillion
- France: $3.38 trillion
- Italy: $2.55 trillion
- Spain: $1.91 trillion
- Russia (European part): ~$1.83 trillion
- Netherlands: $1.32 trillion
- Switzerland: $1.06 trillion
- Poland: $1.04 trillion
- Belgium: $725 billion
- Ireland: $680 billion
- Sweden: $677 billion
- Austria: $580 billion
Maryland Vs European GDP (PPP)
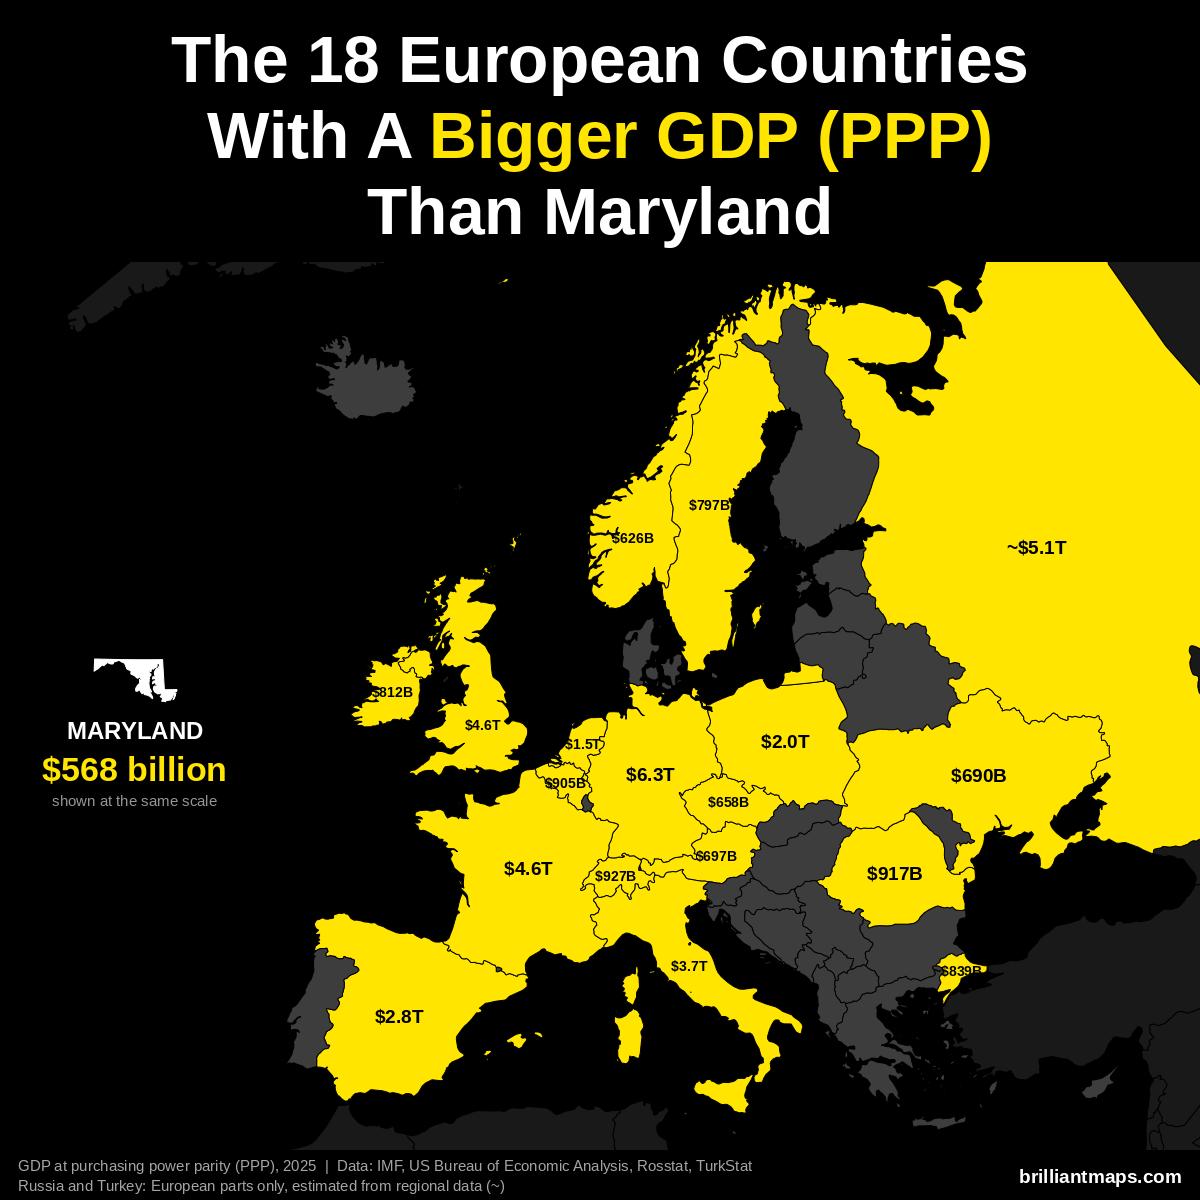
Maryland has a GDP of $568 billion (2025). US states are already measured in the dollars PPP is based on, so the figure is the same as nominal GDP. 18 European countries have a bigger GDP at purchasing power parity:
- Germany: $6.26 trillion
- Russia (European part): ~$5.14 trillion
- France: $4.58 trillion
- United Kingdom: $4.57 trillion
- Italy: $3.74 trillion
- Spain: $2.83 trillion
- Poland: $2.04 trillion
- Netherlands: $1.52 trillion
- Switzerland: $927 billion
- Romania: $917 billion
- Belgium: $905 billion
- Turkey (European part): ~$839 billion
- Ireland: $812 billion
- Sweden: $797 billion
- Austria: $697 billion
- Ukraine: $690 billion
- Czechia: $658 billion
- Norway: $626 billion
Maryland Vs European GDP Per Capita (PPP)
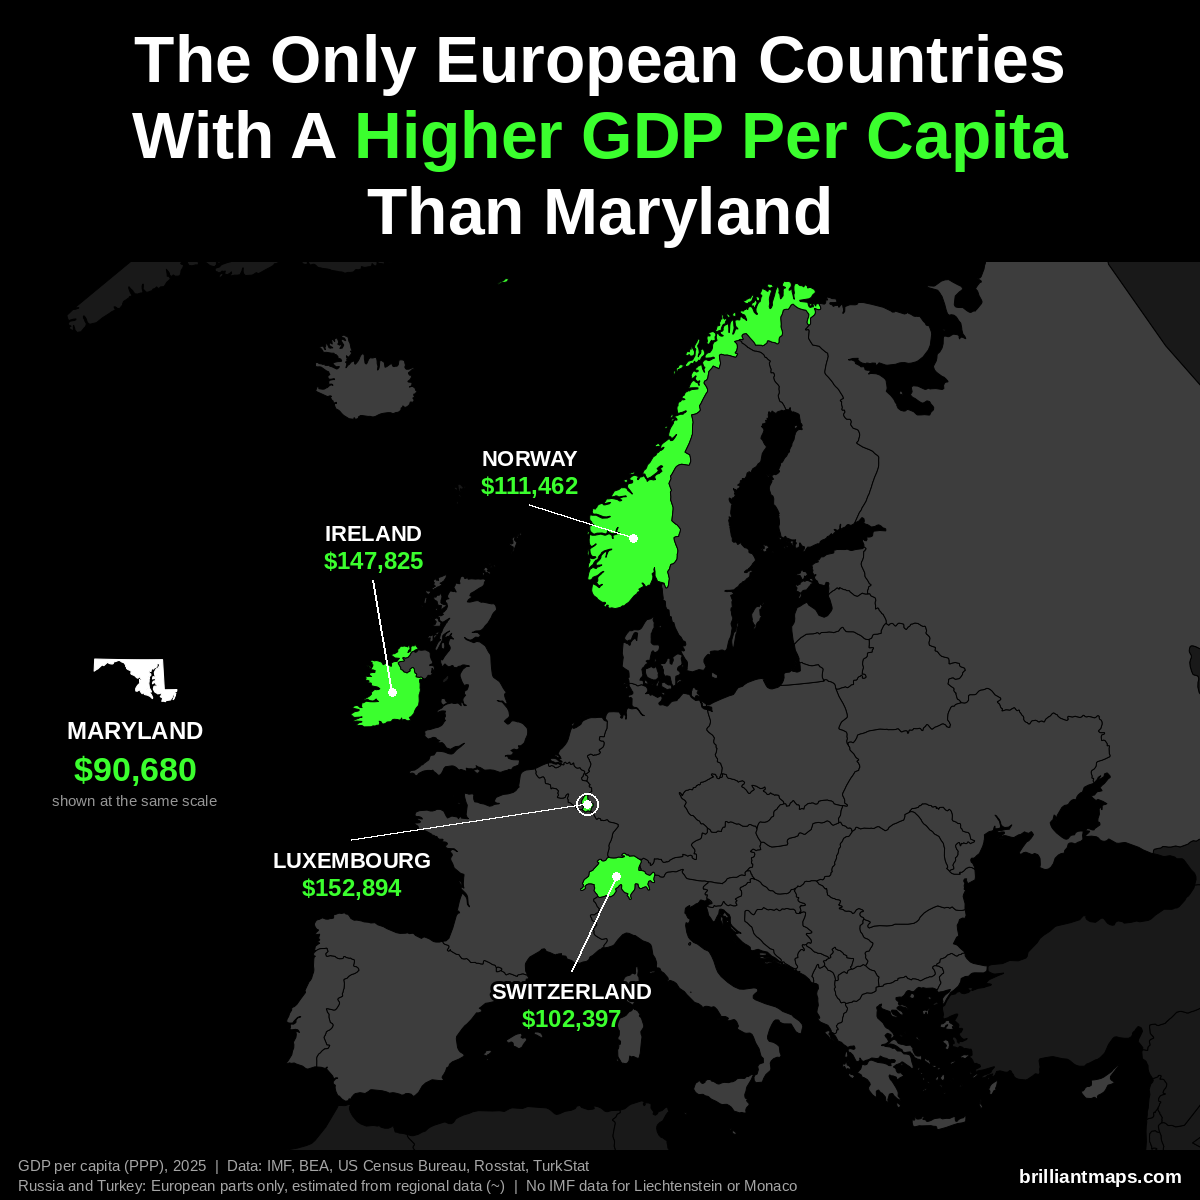
Maryland has a GDP per capita of $90,680 (2025). Only 4 European countries have a higher GDP per capita at purchasing power parity:
- Luxembourg: $152,894
- Ireland: $147,825
- Norway: $111,462
- Switzerland: $102,397
Liechtenstein and Monaco are not covered by the IMF data and are not counted here.
Maryland Vs European Size
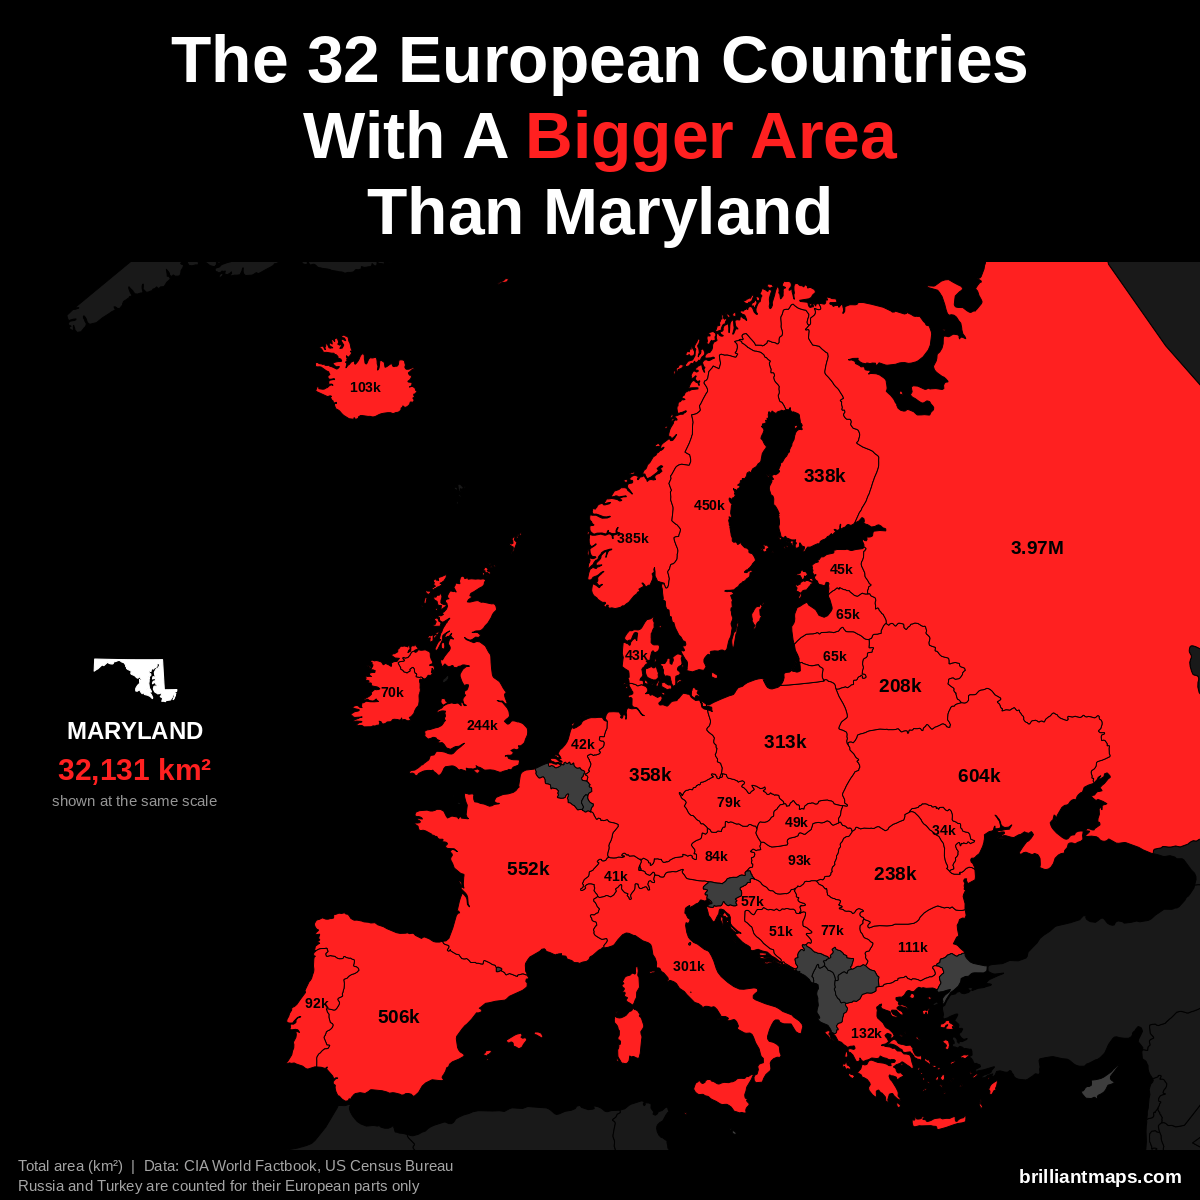
Maryland has a total area of 32,131 km² (12,406 sq mi). 32 European countries have a bigger area:
- Russia (European part): 3,969,100 km² (1,532,477 sq mi)
- Ukraine: 603,550 km² (233,032 sq mi)
- France: 551,695 km² (213,010 sq mi)
- Spain: 505,990 km² (195,364 sq mi)
- Sweden: 450,295 km² (173,860 sq mi)
- Norway: 385,207 km² (148,729 sq mi)
- Germany: 357,588 km² (138,065 sq mi)
- Finland: 338,455 km² (130,678 sq mi)
- Poland: 312,696 km² (120,733 sq mi)
- Italy: 301,340 km² (116,348 sq mi)
- United Kingdom: 243,610 km² (94,058 sq mi)
- Romania: 238,397 km² (92,046 sq mi)
- Belarus: 207,600 km² (80,155 sq mi)
- Greece: 131,957 km² (50,949 sq mi)
- Bulgaria: 110,994 km² (42,855 sq mi)
- Iceland: 103,000 km² (39,768 sq mi)
- Hungary: 93,028 km² (35,918 sq mi)
- Portugal: 92,212 km² (35,603 sq mi)
- Austria: 83,871 km² (32,383 sq mi)
- Czechia: 78,867 km² (30,451 sq mi)
- Serbia: 77,474 km² (29,913 sq mi)
- Ireland: 70,273 km² (27,133 sq mi)
- Lithuania: 65,300 km² (25,212 sq mi)
- Latvia: 64,589 km² (24,938 sq mi)
- Croatia: 56,594 km² (21,851 sq mi)
- Bosnia and Herzegovina: 51,197 km² (19,767 sq mi)
- Slovakia: 49,035 km² (18,933 sq mi)
- Estonia: 45,339 km² (17,505 sq mi)
- Denmark: 43,094 km² (16,639 sq mi)
- Netherlands: 41,850 km² (16,158 sq mi)
- Switzerland: 41,285 km² (15,940 sq mi)
- Moldova: 33,846 km² (13,068 sq mi)
Maryland Vs European Life Expectancy
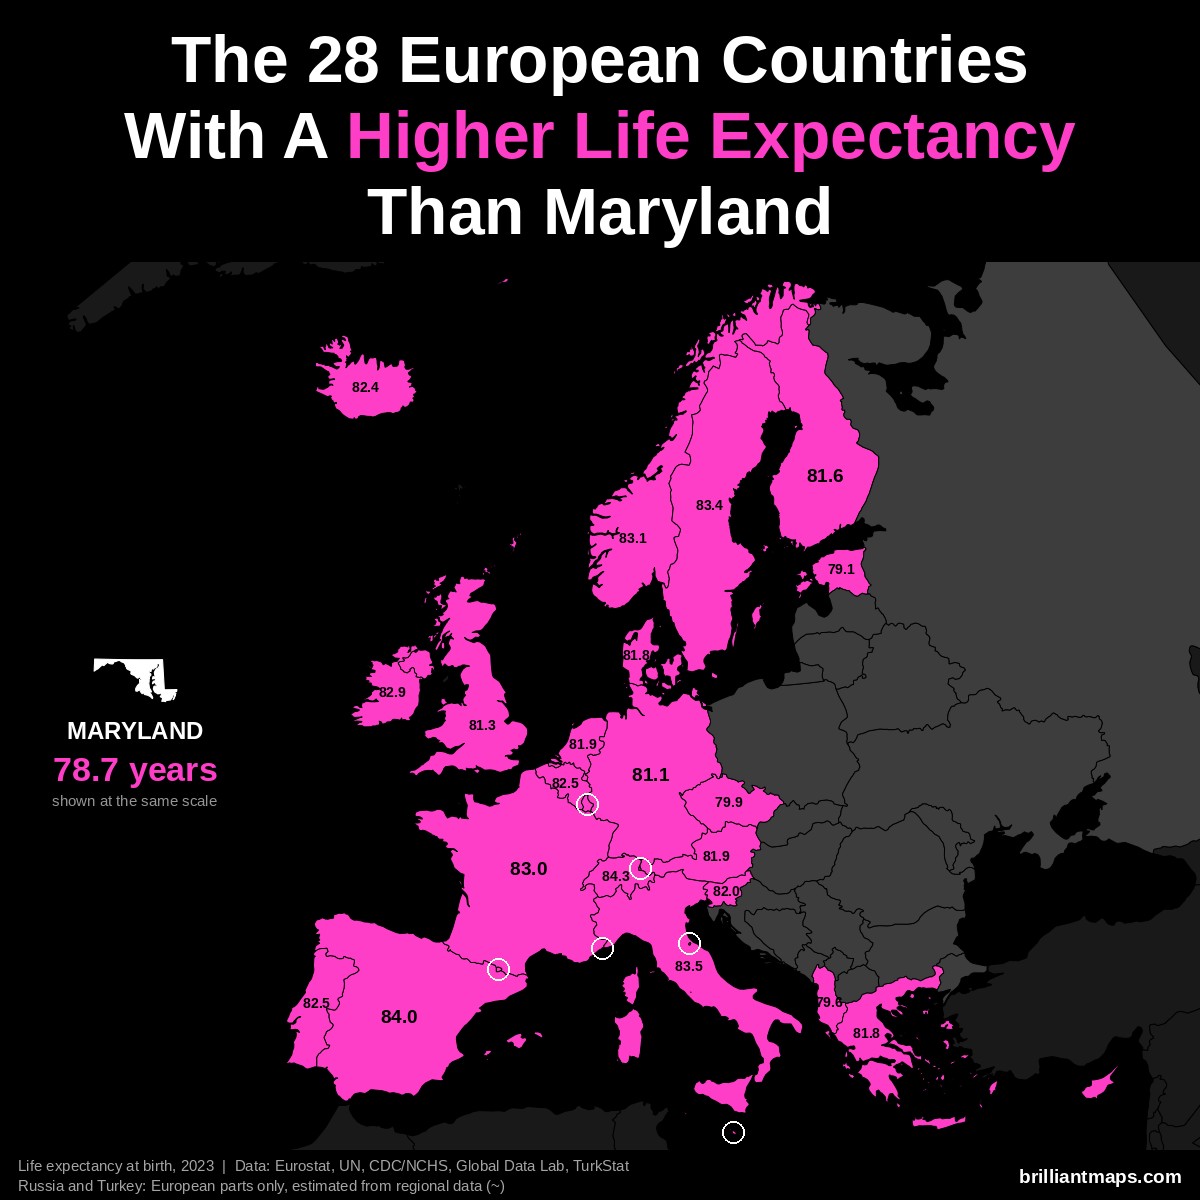
Maryland has a life expectancy at birth of 78.7 years (2023). 28 European countries have a higher life expectancy:
- Monaco: 86.4 years
- San Marino: 85.7 years
- Liechtenstein: 84.6 years
- Switzerland: 84.3 years
- Andorra: 84.0 years
- Spain: 84.0 years
- Italy: 83.5 years
- Luxembourg: 83.4 years
- Malta: 83.4 years
- Sweden: 83.4 years
- Norway: 83.1 years
- France: 83.0 years
- Cyprus: 82.9 years
- Ireland: 82.9 years
- Belgium: 82.5 years
- Portugal: 82.5 years
- Iceland: 82.4 years
- Slovenia: 82.0 years
- Austria: 81.9 years
- Netherlands: 81.9 years
- Denmark: 81.8 years
- Greece: 81.8 years
- Finland: 81.6 years
- United Kingdom: 81.3 years
- Germany: 81.1 years
- Czechia: 79.9 years
- Albania: 79.6 years
- Estonia: 79.1 years
Massachusetts vs Europe
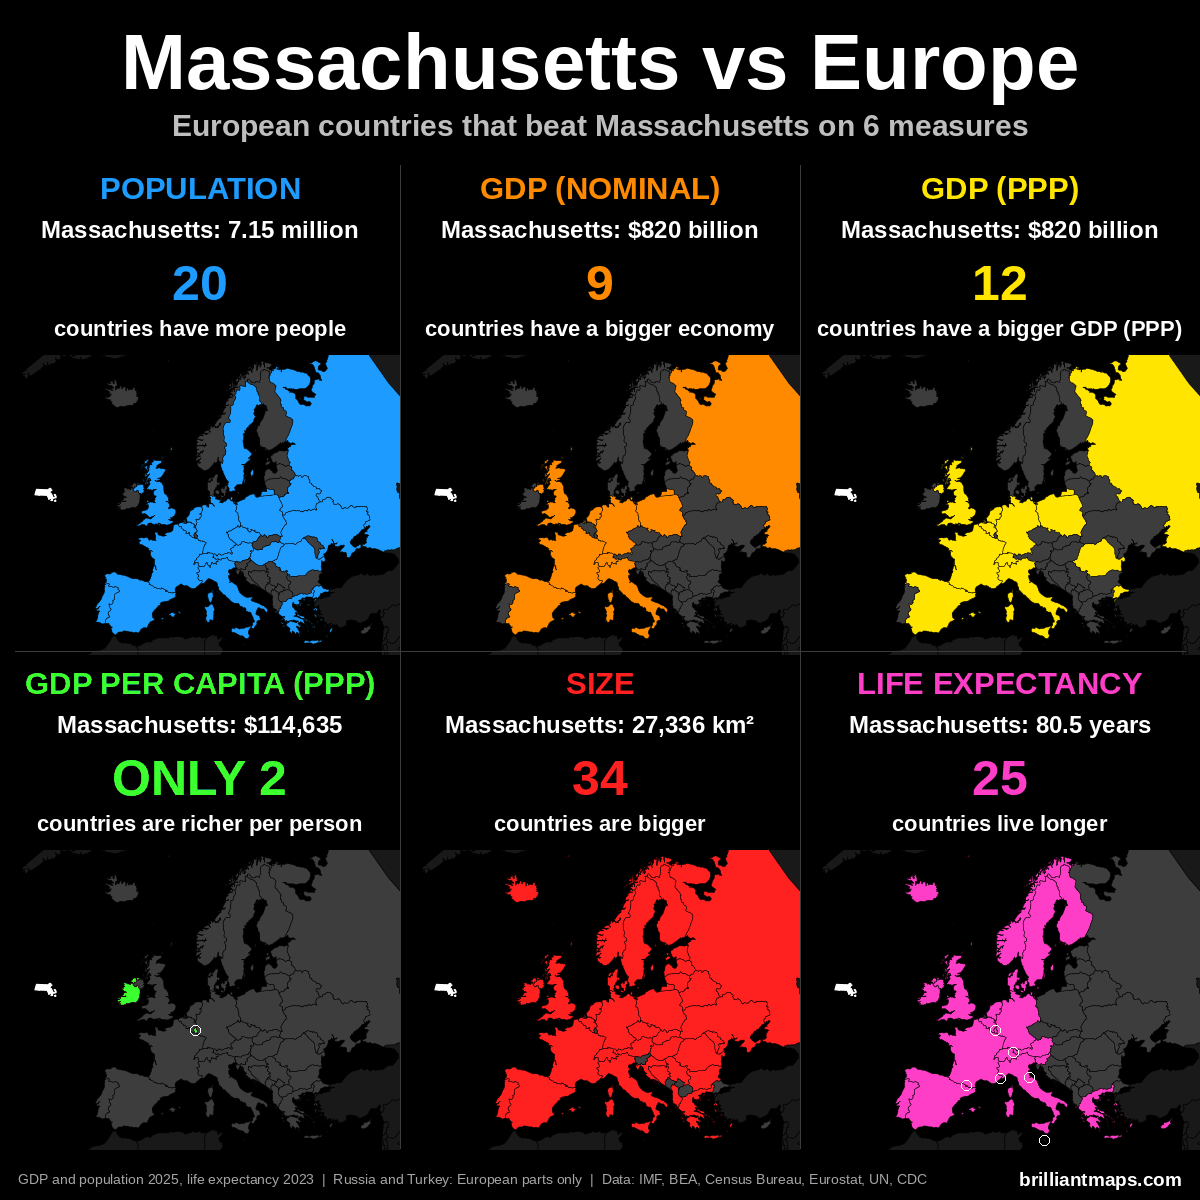
Massachusetts Vs European Population
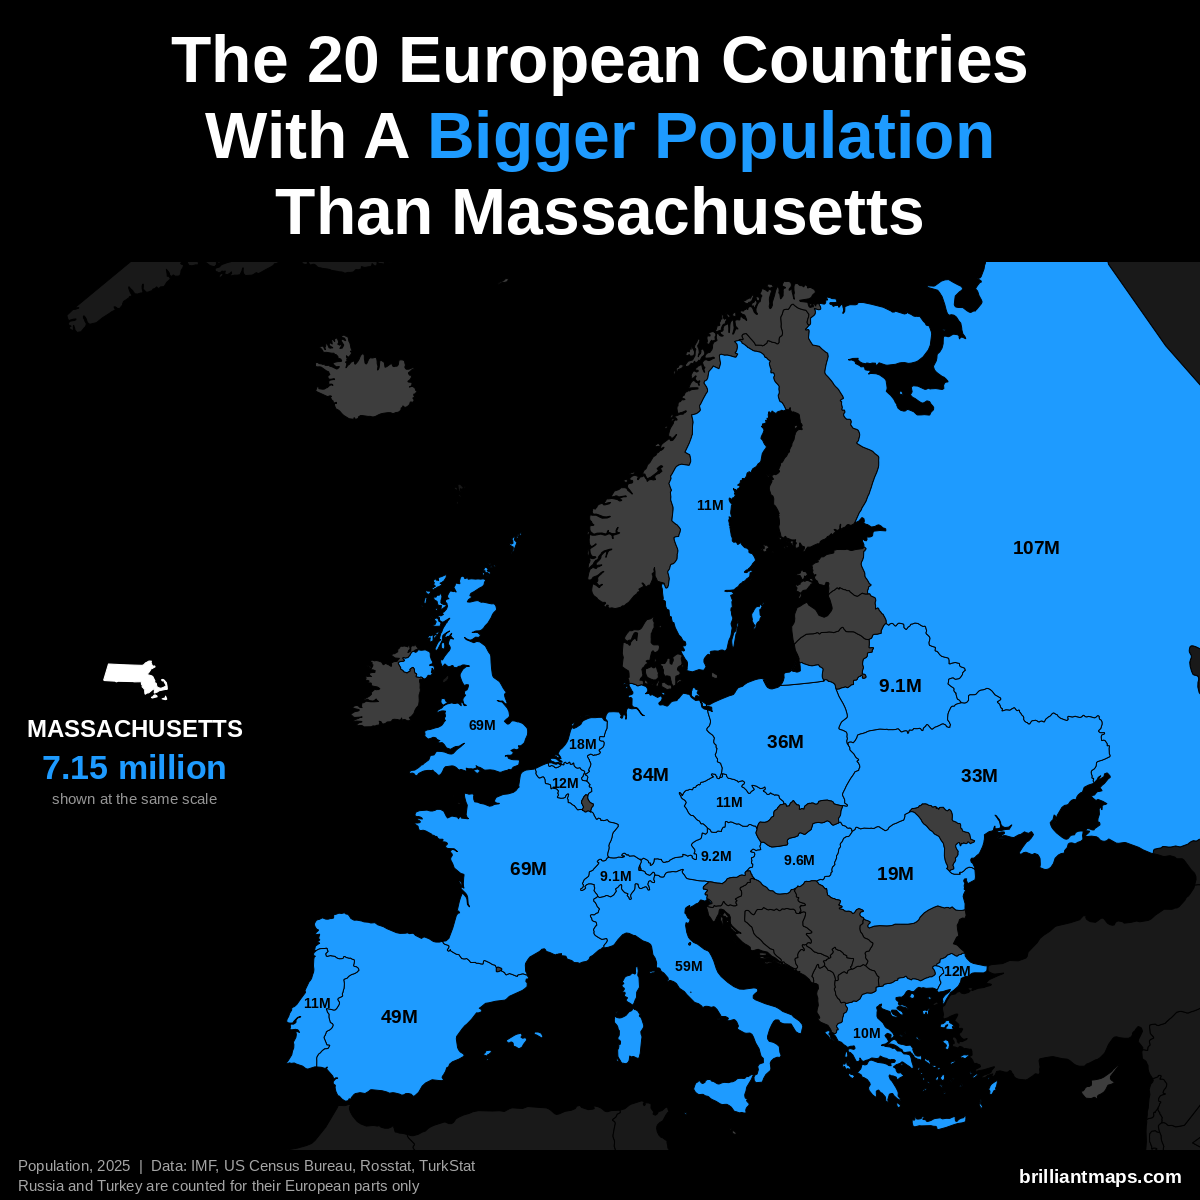
Massachusetts has a population of 7.2 million (2025). 20 European countries have a bigger population:
- Russia (European part): 107.0 million
- Germany: 83.5 million
- United Kingdom: 69.5 million
- France: 68.9 million
- Italy: 58.9 million
- Spain: 49.5 million
- Poland: 36.5 million
- Ukraine: 32.9 million
- Romania: 19.0 million
- Netherlands: 18.0 million
- Turkey (European part): 12.2 million
- Belgium: 11.9 million
- Portugal: 10.8 million
- Czechia: 10.8 million
- Sweden: 10.7 million
- Greece: 10.4 million
- Hungary: 9.6 million
- Austria: 9.2 million
- Belarus: 9.1 million
- Switzerland: 9.1 million
Massachusetts Vs European GDP (Nominal)
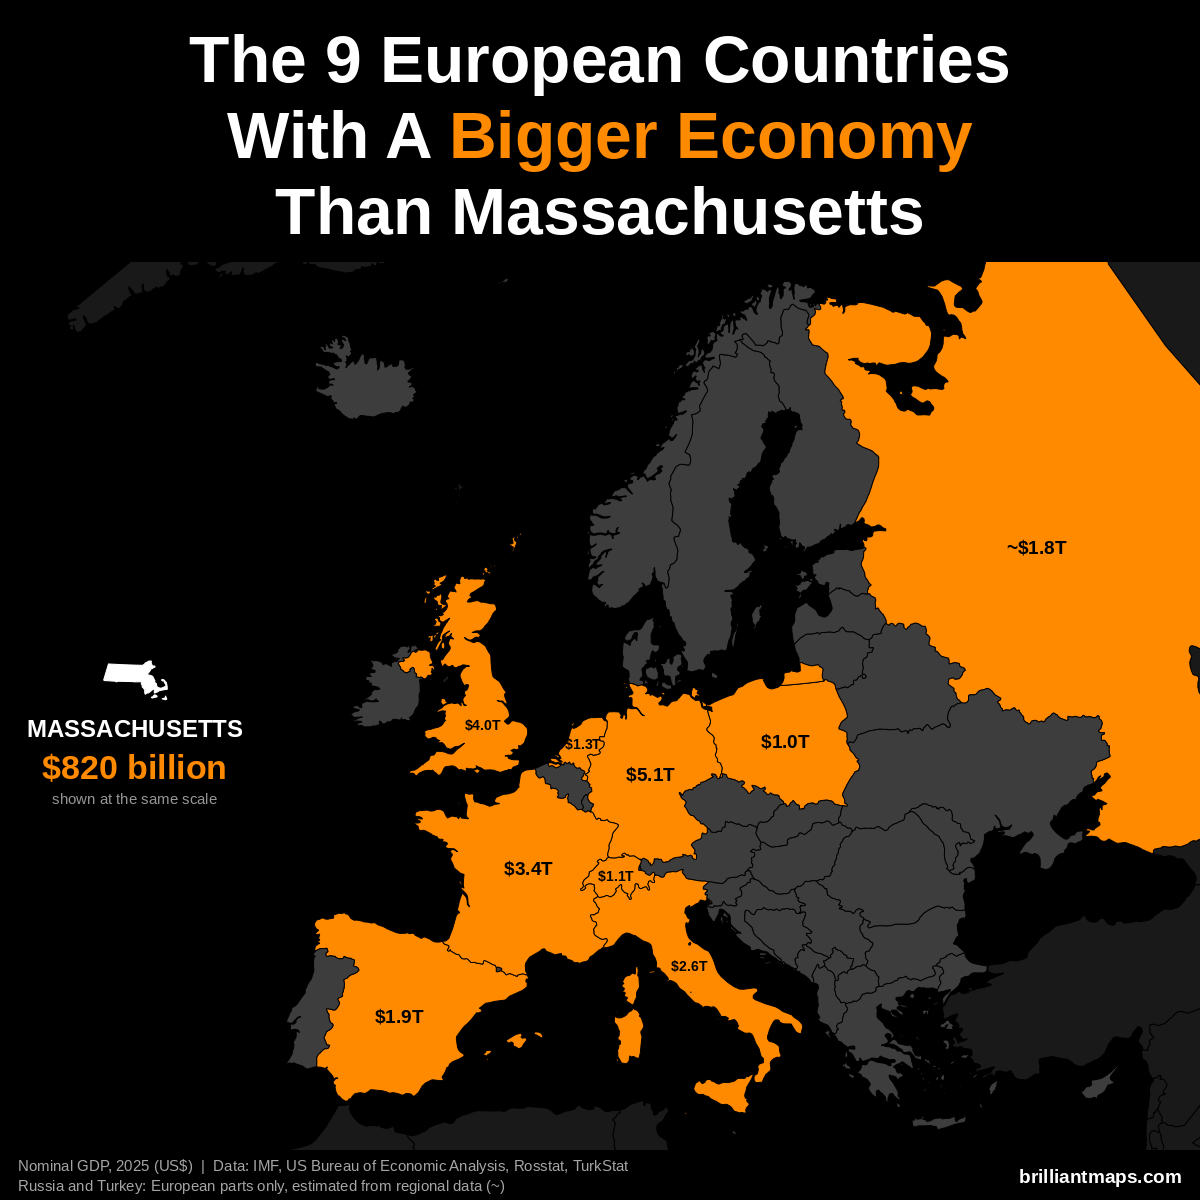
Massachusetts has a nominal GDP of $820 billion (2025). 9 European countries have a bigger economy:
- Germany: $5.12 trillion
- United Kingdom: $4.01 trillion
- France: $3.38 trillion
- Italy: $2.55 trillion
- Spain: $1.91 trillion
- Russia (European part): ~$1.83 trillion
- Netherlands: $1.32 trillion
- Switzerland: $1.06 trillion
- Poland: $1.04 trillion
Massachusetts Vs European GDP (PPP)
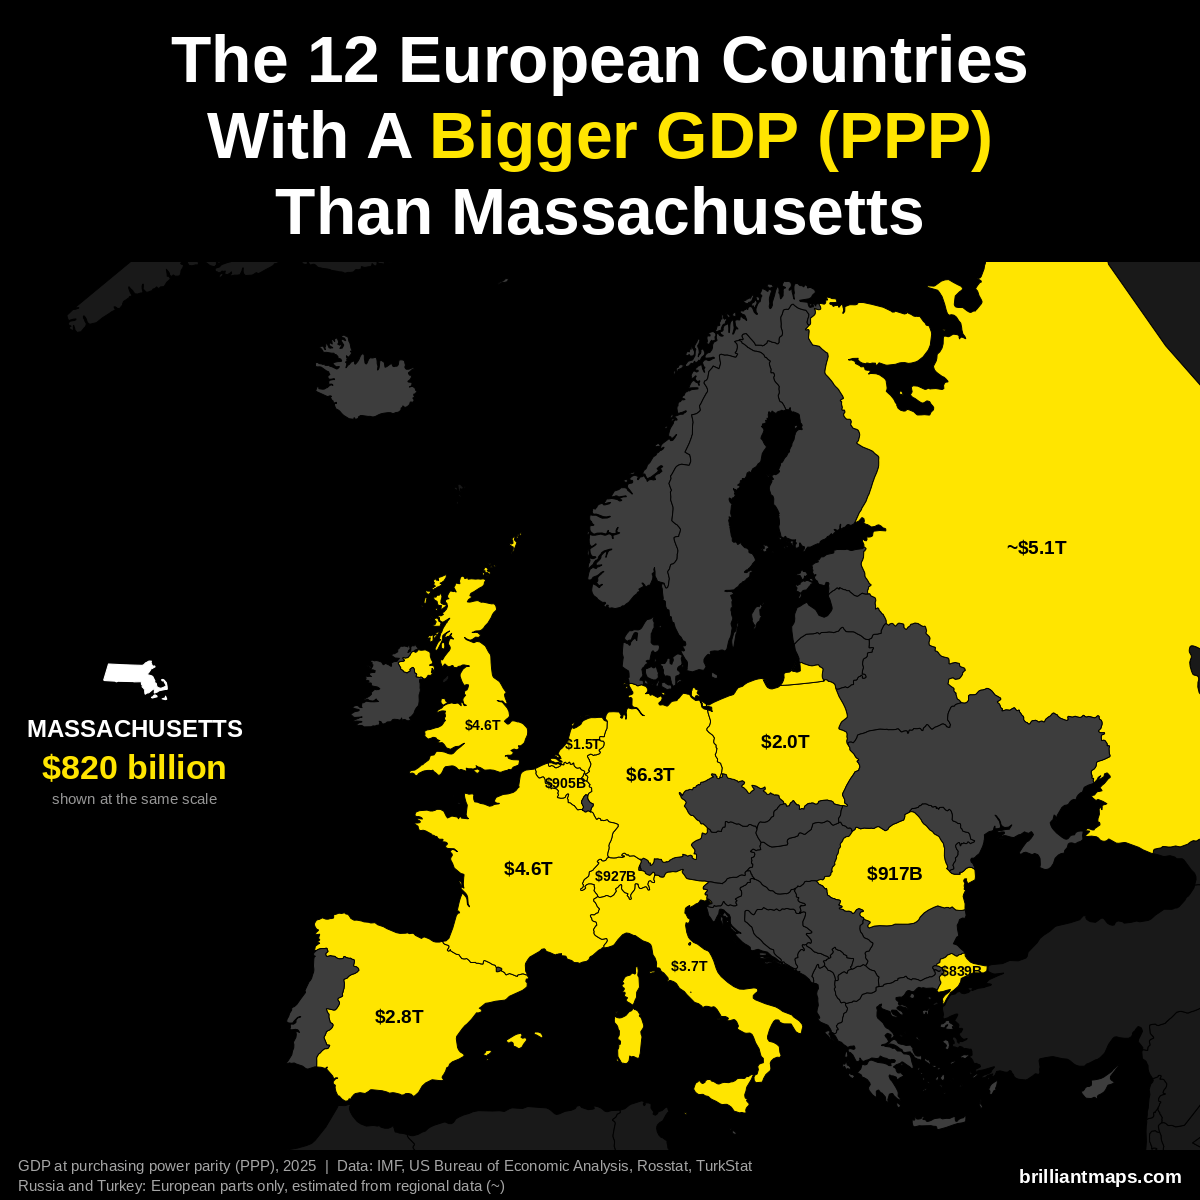
Massachusetts has a GDP of $820 billion (2025). US states are already measured in the dollars PPP is based on, so the figure is the same as nominal GDP. 12 European countries have a bigger GDP at purchasing power parity:
- Germany: $6.26 trillion
- Russia (European part): ~$5.14 trillion
- France: $4.58 trillion
- United Kingdom: $4.57 trillion
- Italy: $3.74 trillion
- Spain: $2.83 trillion
- Poland: $2.04 trillion
- Netherlands: $1.52 trillion
- Switzerland: $927 billion
- Romania: $917 billion
- Belgium: $905 billion
- Turkey (European part): ~$839 billion
Massachusetts Vs European GDP Per Capita (PPP)
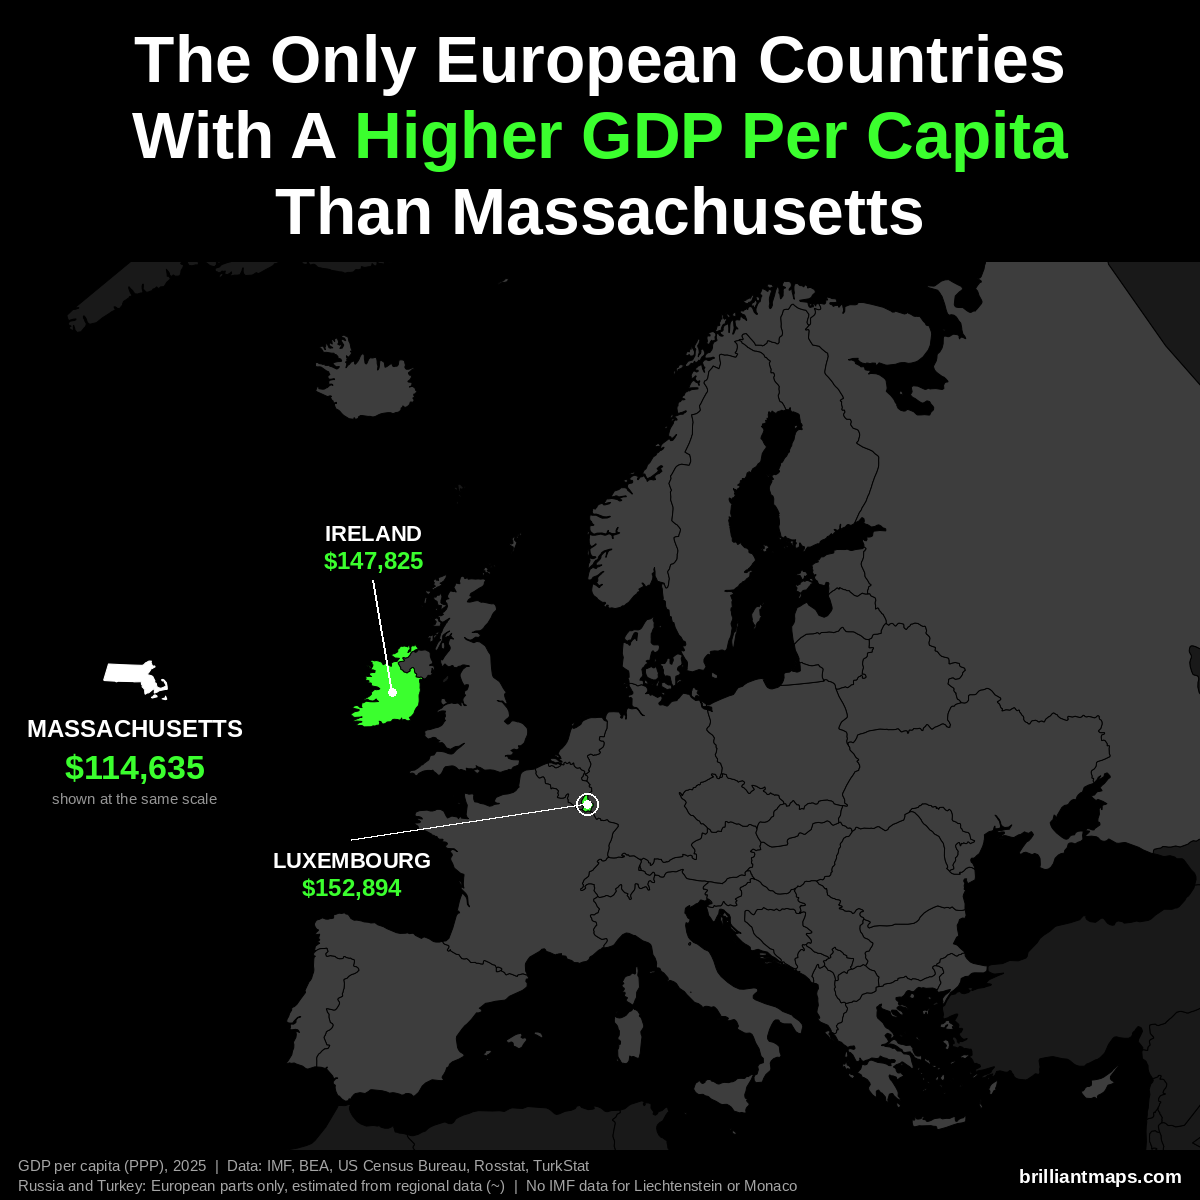
Massachusetts has a GDP per capita of $114,635 (2025). Only 2 European countries have a higher GDP per capita at purchasing power parity:
- Luxembourg: $152,894
- Ireland: $147,825
Liechtenstein and Monaco are not covered by the IMF data and are not counted here.
Massachusetts Vs European Size
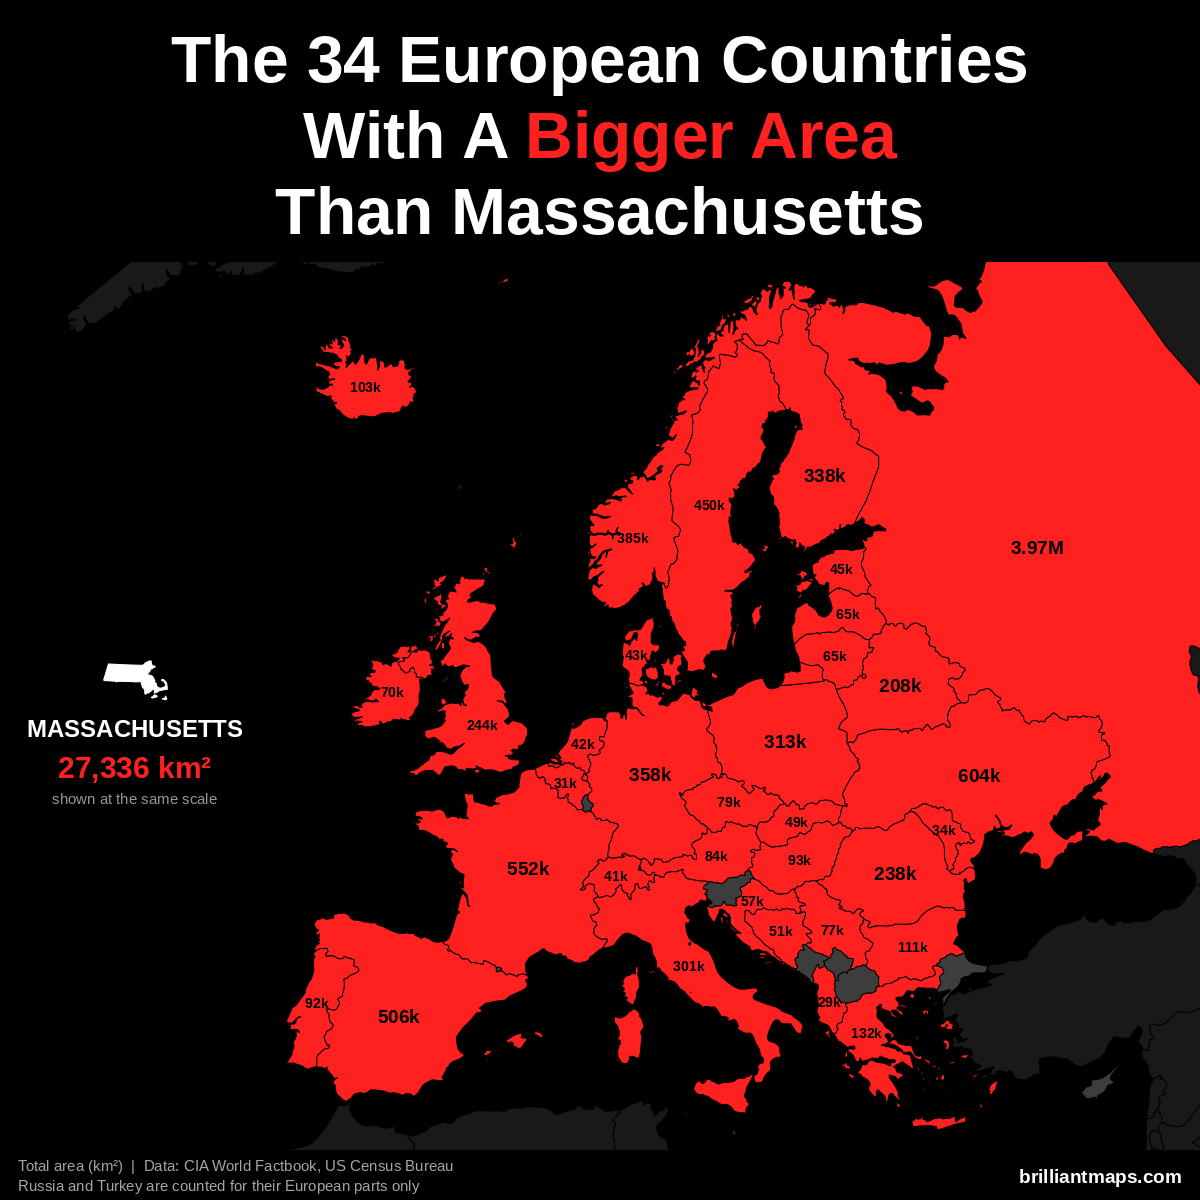
Massachusetts has a total area of 27,336 km² (10,554 sq mi). 34 European countries have a bigger area:
- Russia (European part): 3,969,100 km² (1,532,477 sq mi)
- Ukraine: 603,550 km² (233,032 sq mi)
- France: 551,695 km² (213,010 sq mi)
- Spain: 505,990 km² (195,364 sq mi)
- Sweden: 450,295 km² (173,860 sq mi)
- Norway: 385,207 km² (148,729 sq mi)
- Germany: 357,588 km² (138,065 sq mi)
- Finland: 338,455 km² (130,678 sq mi)
- Poland: 312,696 km² (120,733 sq mi)
- Italy: 301,340 km² (116,348 sq mi)
- United Kingdom: 243,610 km² (94,058 sq mi)
- Romania: 238,397 km² (92,046 sq mi)
- Belarus: 207,600 km² (80,155 sq mi)
- Greece: 131,957 km² (50,949 sq mi)
- Bulgaria: 110,994 km² (42,855 sq mi)
- Iceland: 103,000 km² (39,768 sq mi)
- Hungary: 93,028 km² (35,918 sq mi)
- Portugal: 92,212 km² (35,603 sq mi)
- Austria: 83,871 km² (32,383 sq mi)
- Czechia: 78,867 km² (30,451 sq mi)
- Serbia: 77,474 km² (29,913 sq mi)
- Ireland: 70,273 km² (27,133 sq mi)
- Lithuania: 65,300 km² (25,212 sq mi)
- Latvia: 64,589 km² (24,938 sq mi)
- Croatia: 56,594 km² (21,851 sq mi)
- Bosnia and Herzegovina: 51,197 km² (19,767 sq mi)
- Slovakia: 49,035 km² (18,933 sq mi)
- Estonia: 45,339 km² (17,505 sq mi)
- Denmark: 43,094 km² (16,639 sq mi)
- Netherlands: 41,850 km² (16,158 sq mi)
- Switzerland: 41,285 km² (15,940 sq mi)
- Moldova: 33,846 km² (13,068 sq mi)
- Belgium: 30,528 km² (11,787 sq mi)
- Albania: 28,748 km² (11,100 sq mi)
Massachusetts Vs European Life Expectancy
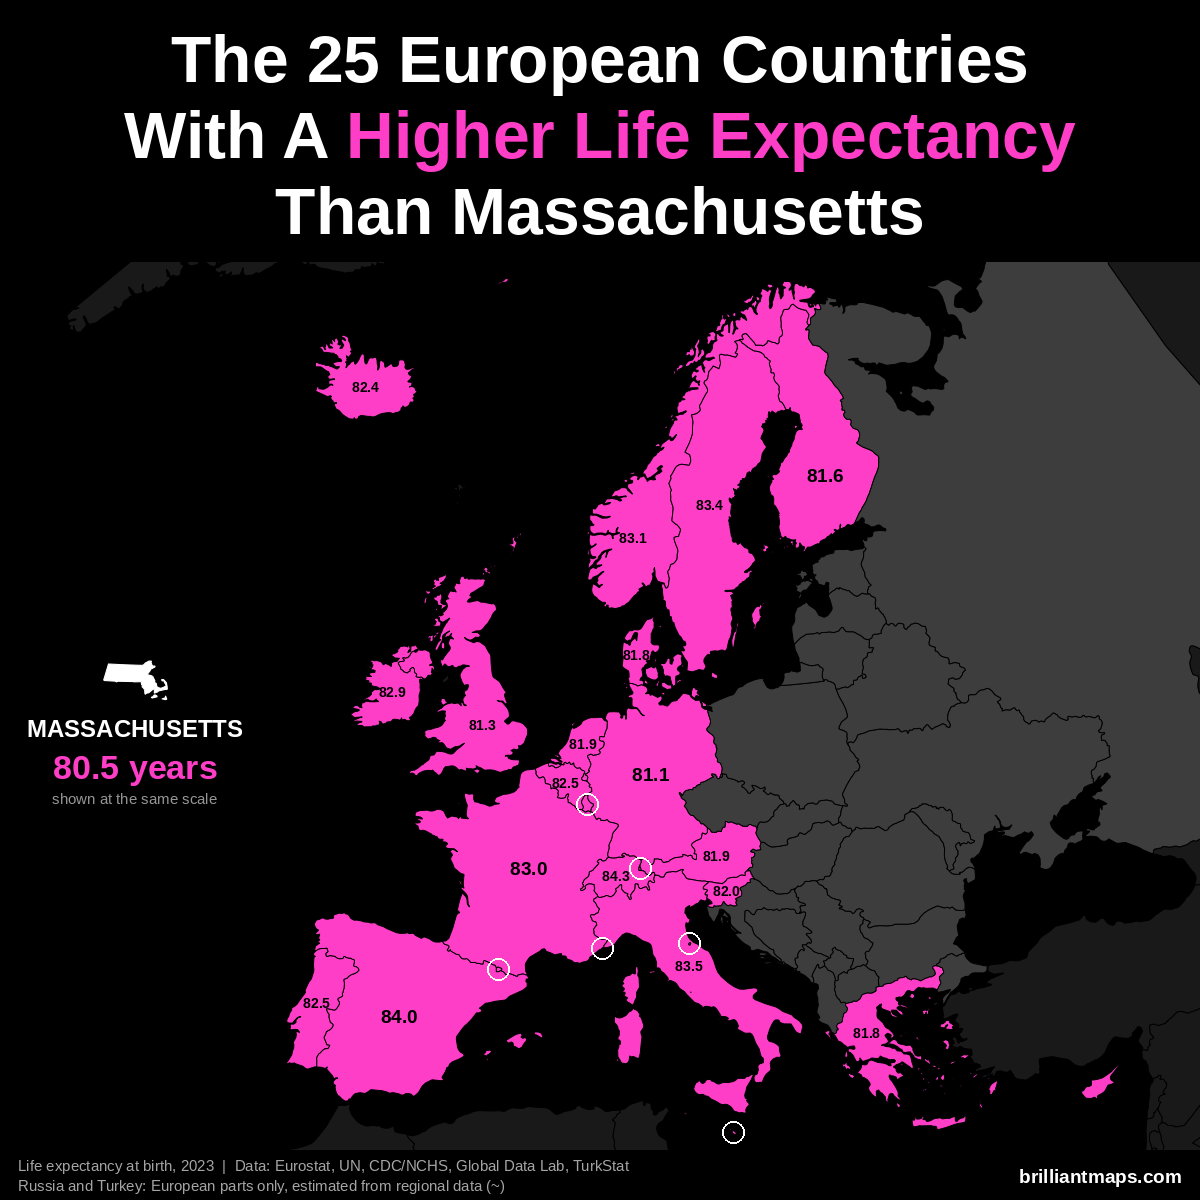
Massachusetts has a life expectancy at birth of 80.5 years (2023). 25 European countries have a higher life expectancy:
- Monaco: 86.4 years
- San Marino: 85.7 years
- Liechtenstein: 84.6 years
- Switzerland: 84.3 years
- Andorra: 84.0 years
- Spain: 84.0 years
- Italy: 83.5 years
- Luxembourg: 83.4 years
- Malta: 83.4 years
- Sweden: 83.4 years
- Norway: 83.1 years
- France: 83.0 years
- Cyprus: 82.9 years
- Ireland: 82.9 years
- Belgium: 82.5 years
- Portugal: 82.5 years
- Iceland: 82.4 years
- Slovenia: 82.0 years
- Austria: 81.9 years
- Netherlands: 81.9 years
- Denmark: 81.8 years
- Greece: 81.8 years
- Finland: 81.6 years
- United Kingdom: 81.3 years
- Germany: 81.1 years
Michigan vs Europe
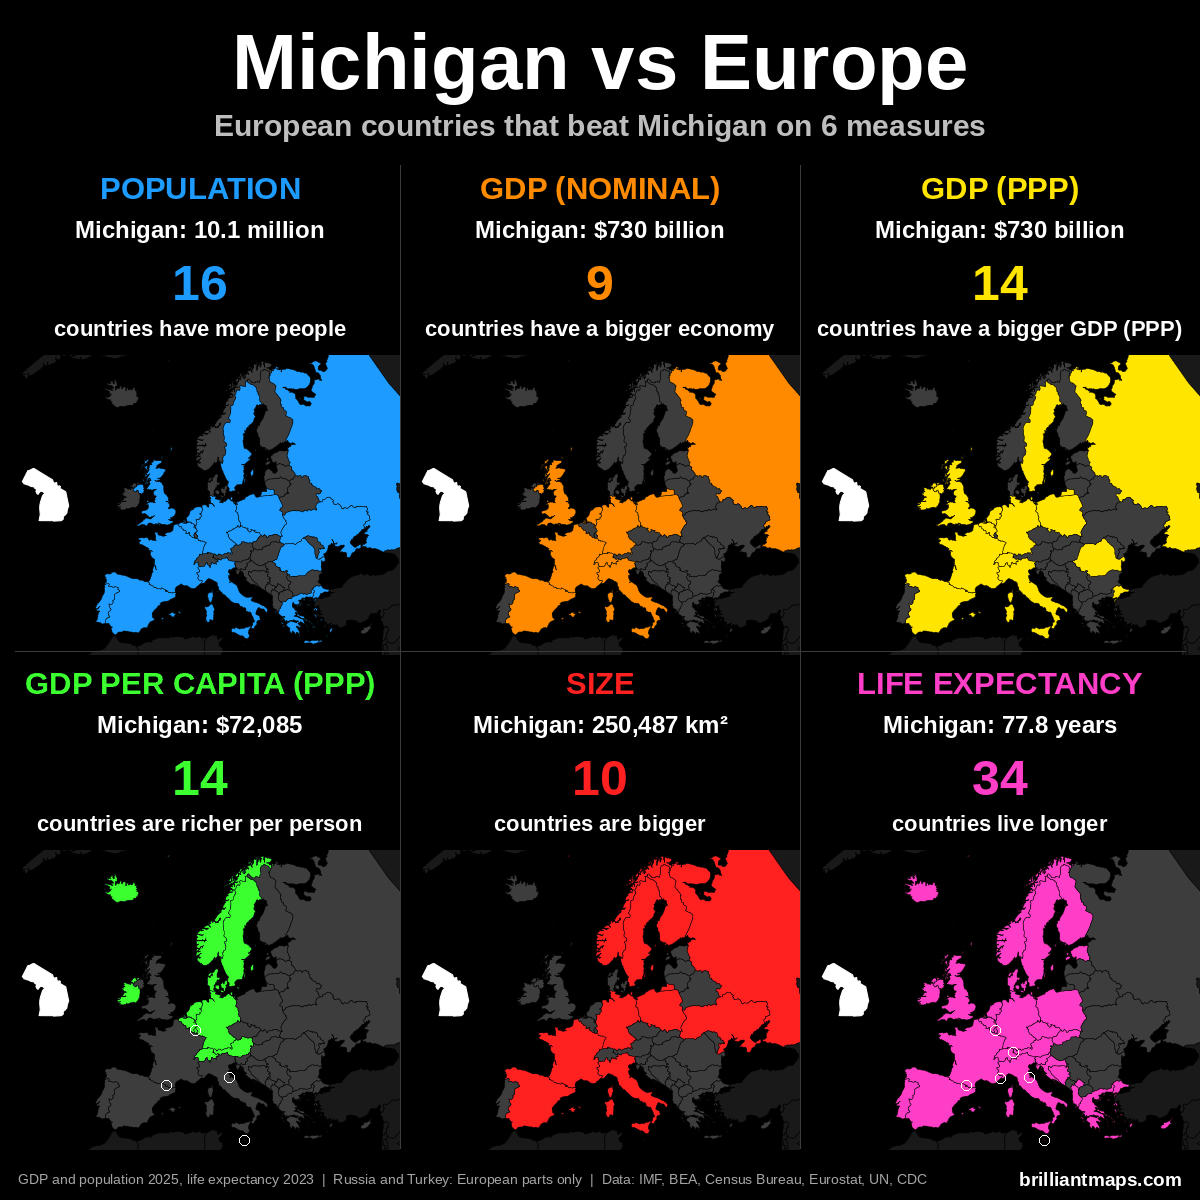
Michigan Vs European Population
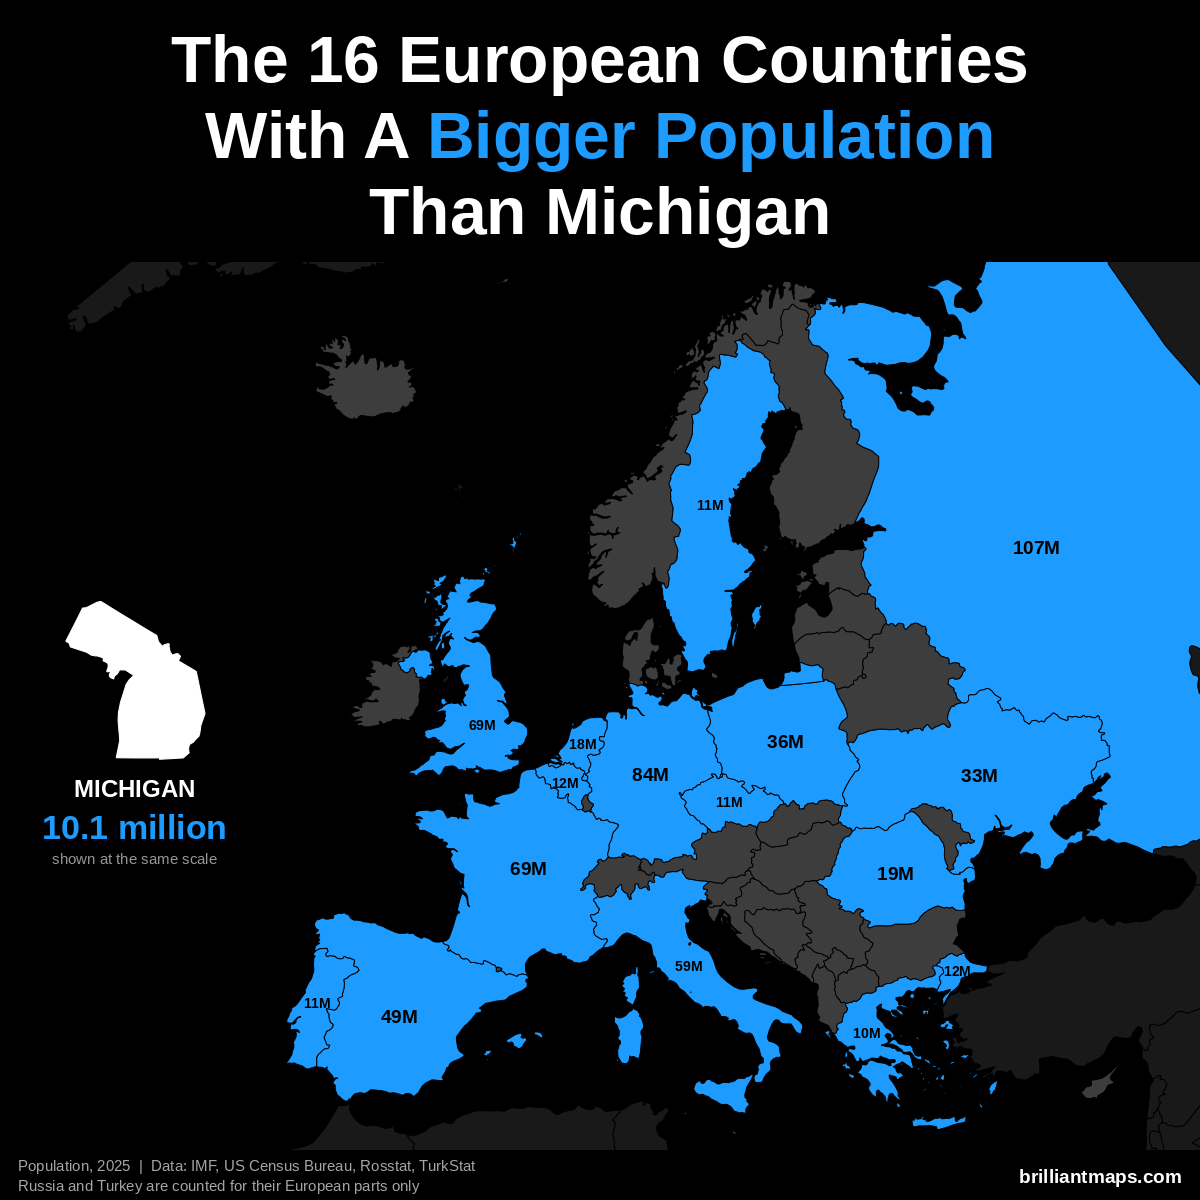
Michigan has a population of 10.1 million (2025). 16 European countries have a bigger population:
- Russia (European part): 107.0 million
- Germany: 83.5 million
- United Kingdom: 69.5 million
- France: 68.9 million
- Italy: 58.9 million
- Spain: 49.5 million
- Poland: 36.5 million
- Ukraine: 32.9 million
- Romania: 19.0 million
- Netherlands: 18.0 million
- Turkey (European part): 12.2 million
- Belgium: 11.9 million
- Portugal: 10.8 million
- Czechia: 10.8 million
- Sweden: 10.7 million
- Greece: 10.4 million
Michigan Vs European GDP (Nominal)
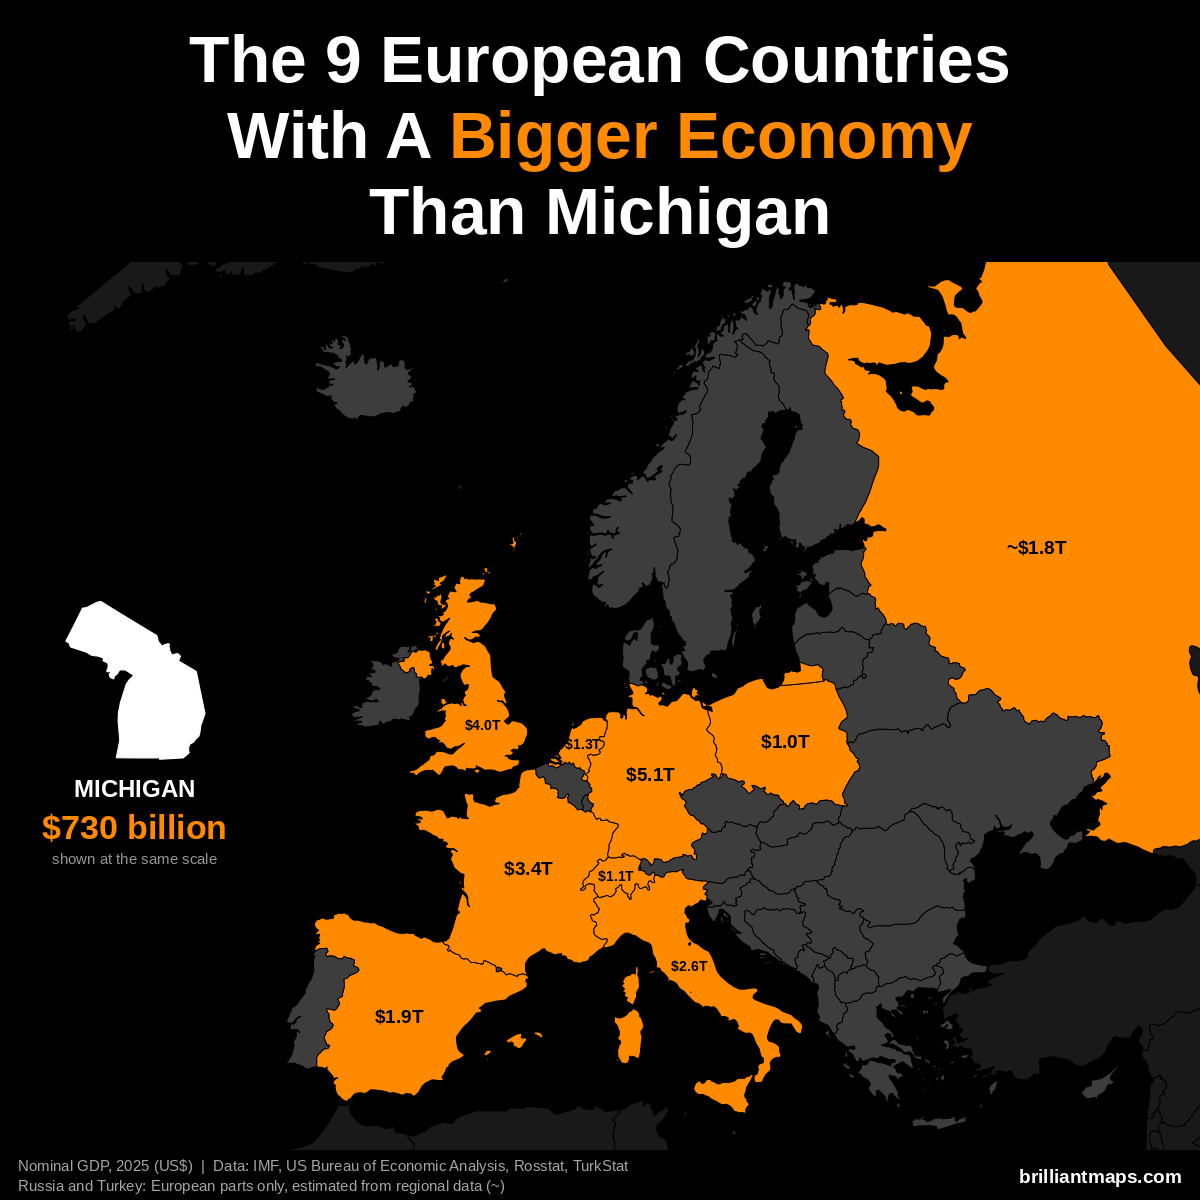
Michigan has a nominal GDP of $730 billion (2025). 9 European countries have a bigger economy:
- Germany: $5.12 trillion
- United Kingdom: $4.01 trillion
- France: $3.38 trillion
- Italy: $2.55 trillion
- Spain: $1.91 trillion
- Russia (European part): ~$1.83 trillion
- Netherlands: $1.32 trillion
- Switzerland: $1.06 trillion
- Poland: $1.04 trillion
Michigan Vs European GDP (PPP)
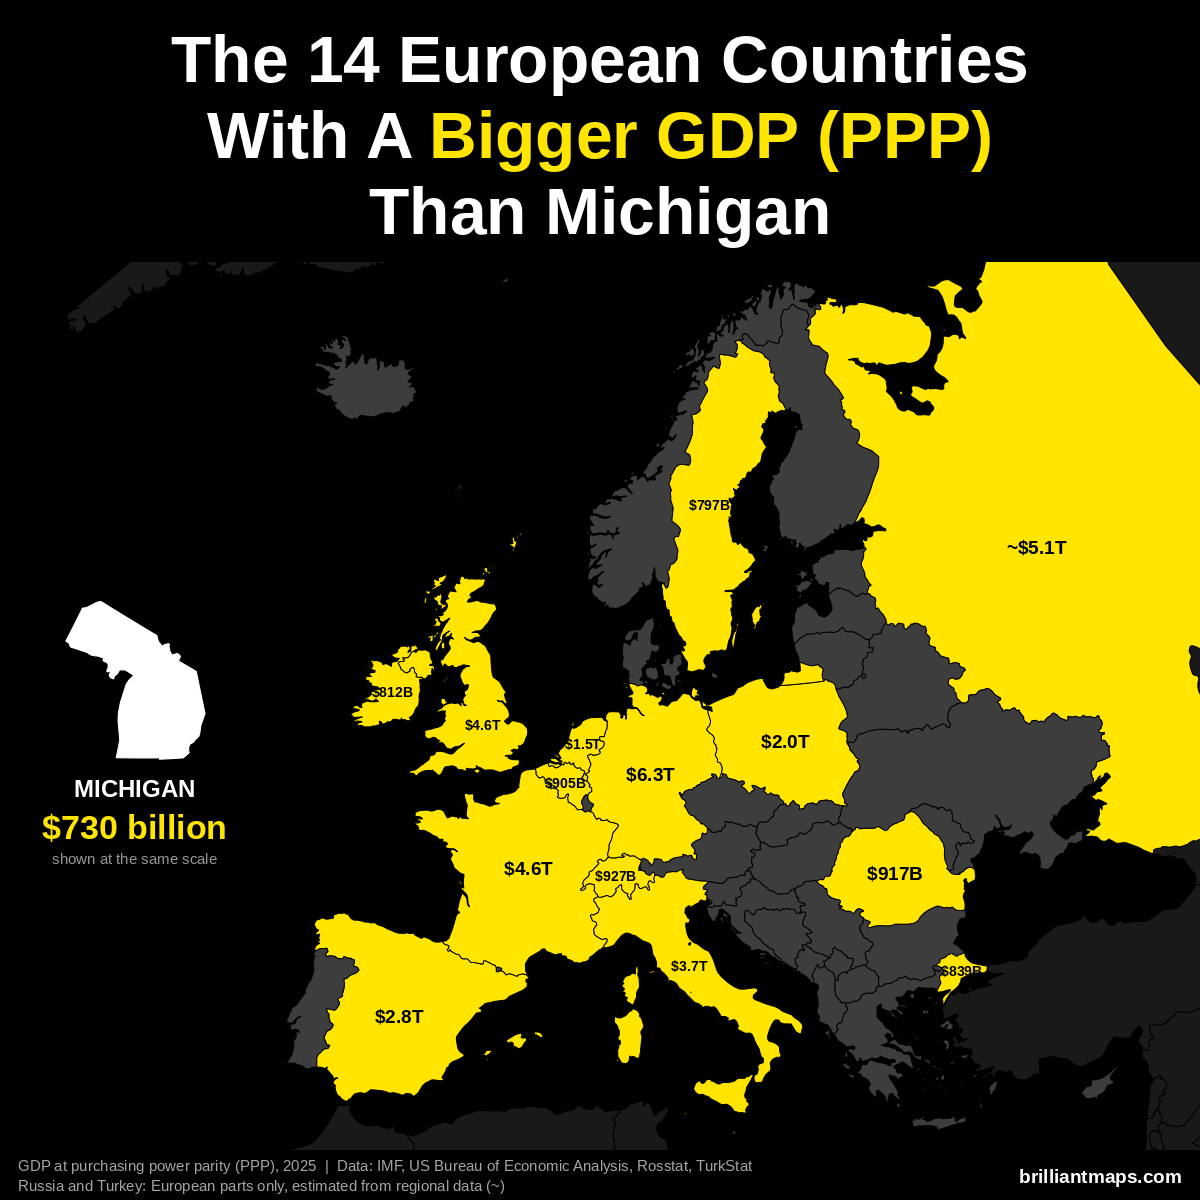
Michigan has a GDP of $730 billion (2025). US states are already measured in the dollars PPP is based on, so the figure is the same as nominal GDP. 14 European countries have a bigger GDP at purchasing power parity:
- Germany: $6.26 trillion
- Russia (European part): ~$5.14 trillion
- France: $4.58 trillion
- United Kingdom: $4.57 trillion
- Italy: $3.74 trillion
- Spain: $2.83 trillion
- Poland: $2.04 trillion
- Netherlands: $1.52 trillion
- Switzerland: $927 billion
- Romania: $917 billion
- Belgium: $905 billion
- Turkey (European part): ~$839 billion
- Ireland: $812 billion
- Sweden: $797 billion
Michigan Vs European GDP Per Capita (PPP)
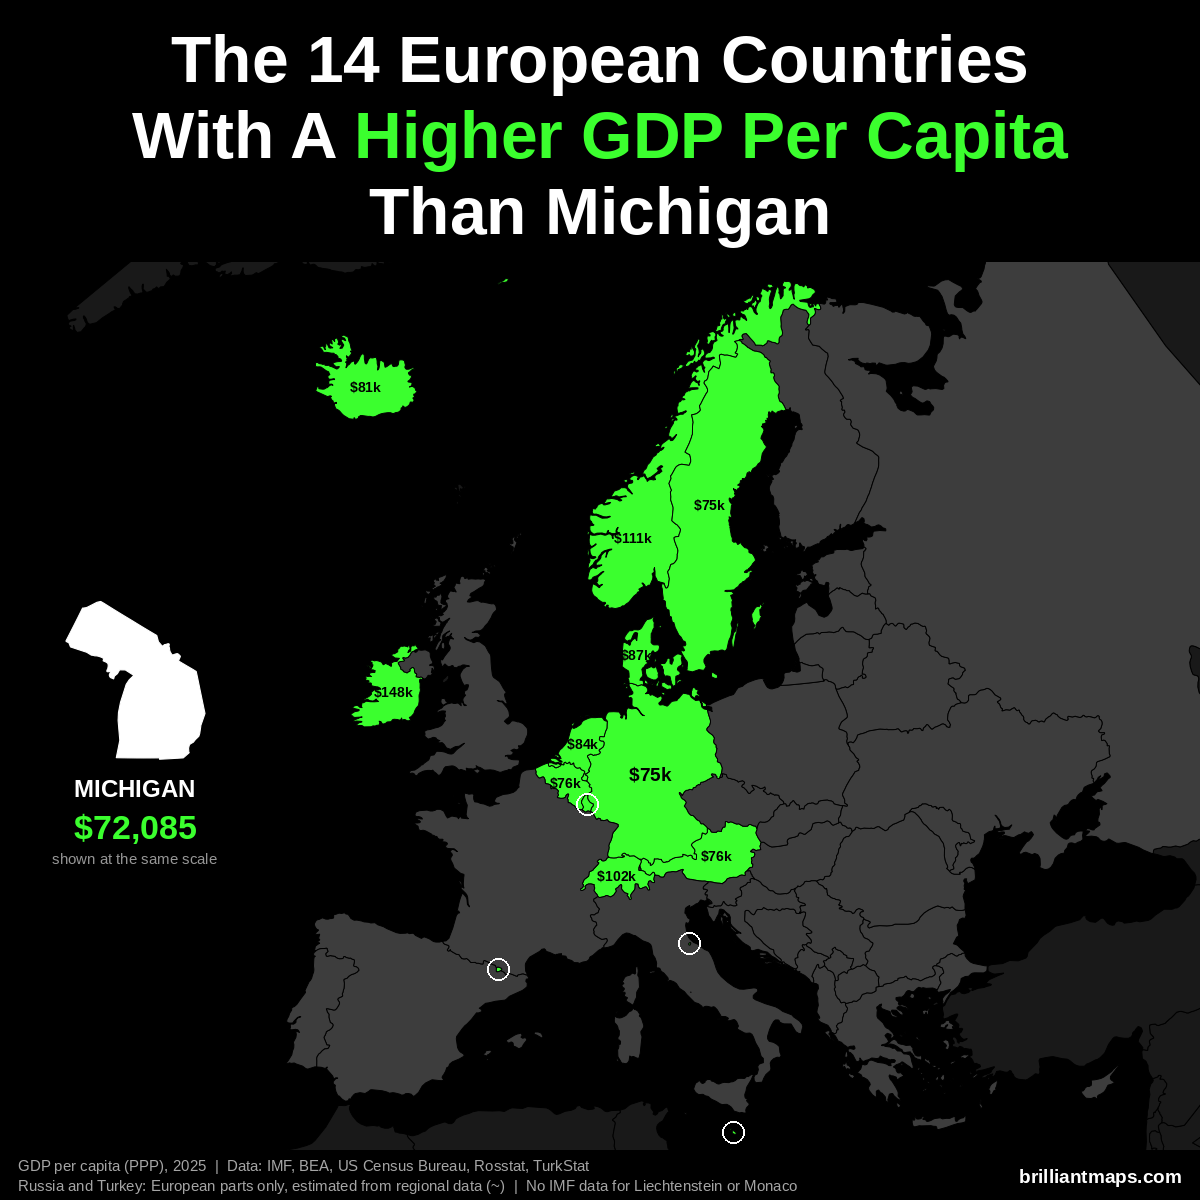
Michigan has a GDP per capita of $72,085 (2025). 14 European countries have a higher GDP per capita at purchasing power parity:
- Luxembourg: $152,894
- Ireland: $147,825
- Norway: $111,462
- Switzerland: $102,397
- Denmark: $87,303
- Netherlands: $84,445
- San Marino: $83,838
- Iceland: $80,915
- Belgium: $76,136
- Austria: $75,965
- Malta: $75,687
- Germany: $74,901
- Sweden: $74,651
- Andorra: $74,059
Liechtenstein and Monaco are not covered by the IMF data and are not counted here.
Michigan Vs European Size
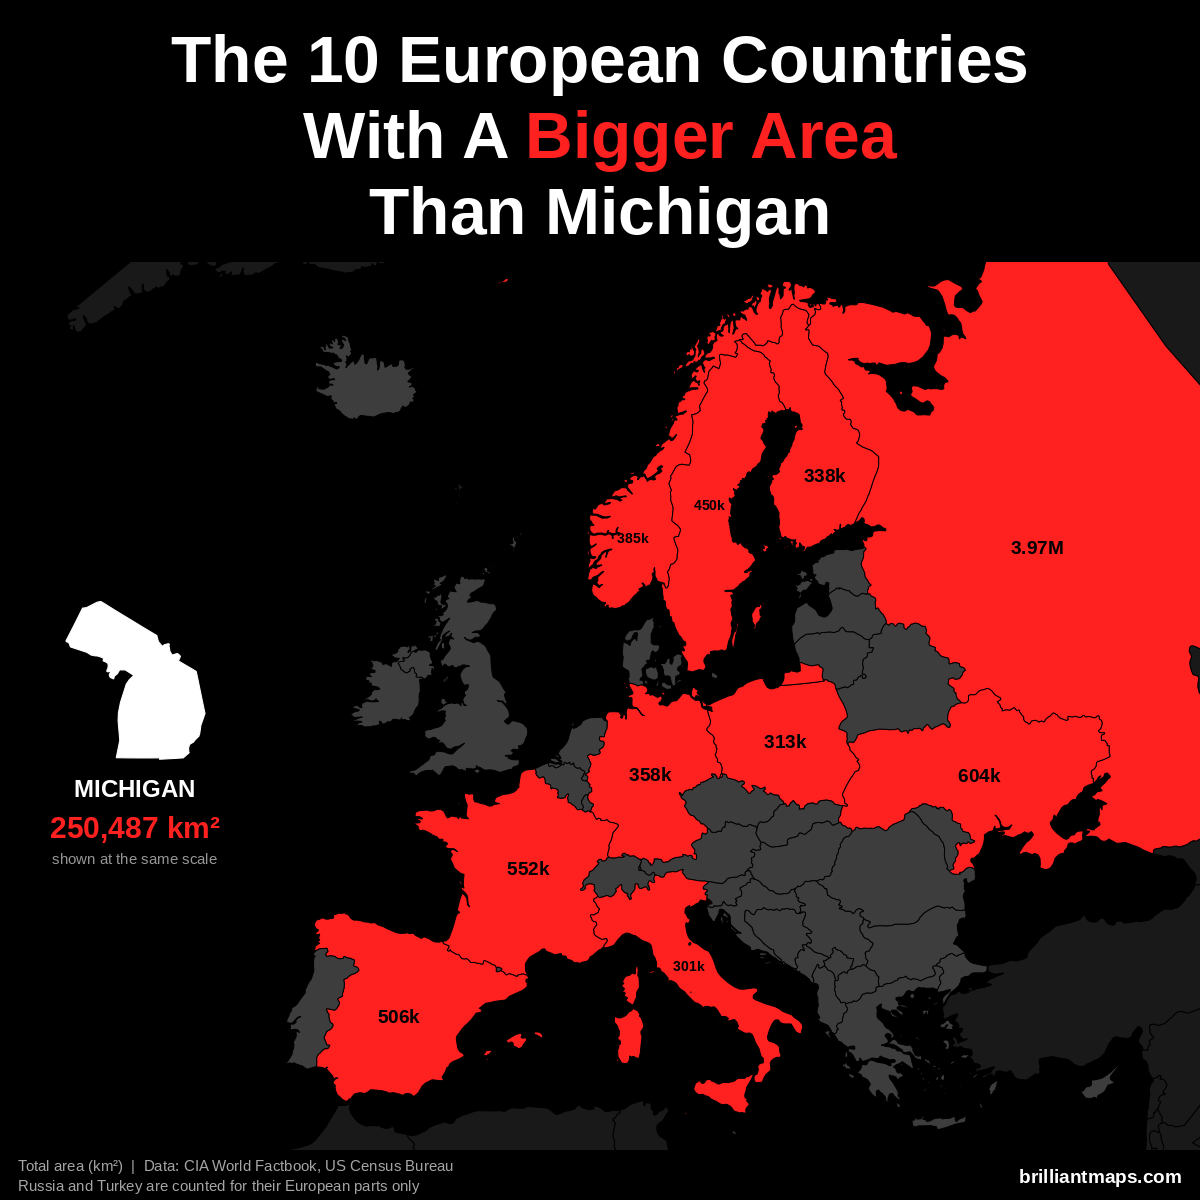
Michigan has a total area of 250,487 km² (96,714 sq mi). 10 European countries have a bigger area:
- Russia (European part): 3,969,100 km² (1,532,477 sq mi)
- Ukraine: 603,550 km² (233,032 sq mi)
- France: 551,695 km² (213,010 sq mi)
- Spain: 505,990 km² (195,364 sq mi)
- Sweden: 450,295 km² (173,860 sq mi)
- Norway: 385,207 km² (148,729 sq mi)
- Germany: 357,588 km² (138,065 sq mi)
- Finland: 338,455 km² (130,678 sq mi)
- Poland: 312,696 km² (120,733 sq mi)
- Italy: 301,340 km² (116,348 sq mi)
Michigan Vs European Life Expectancy
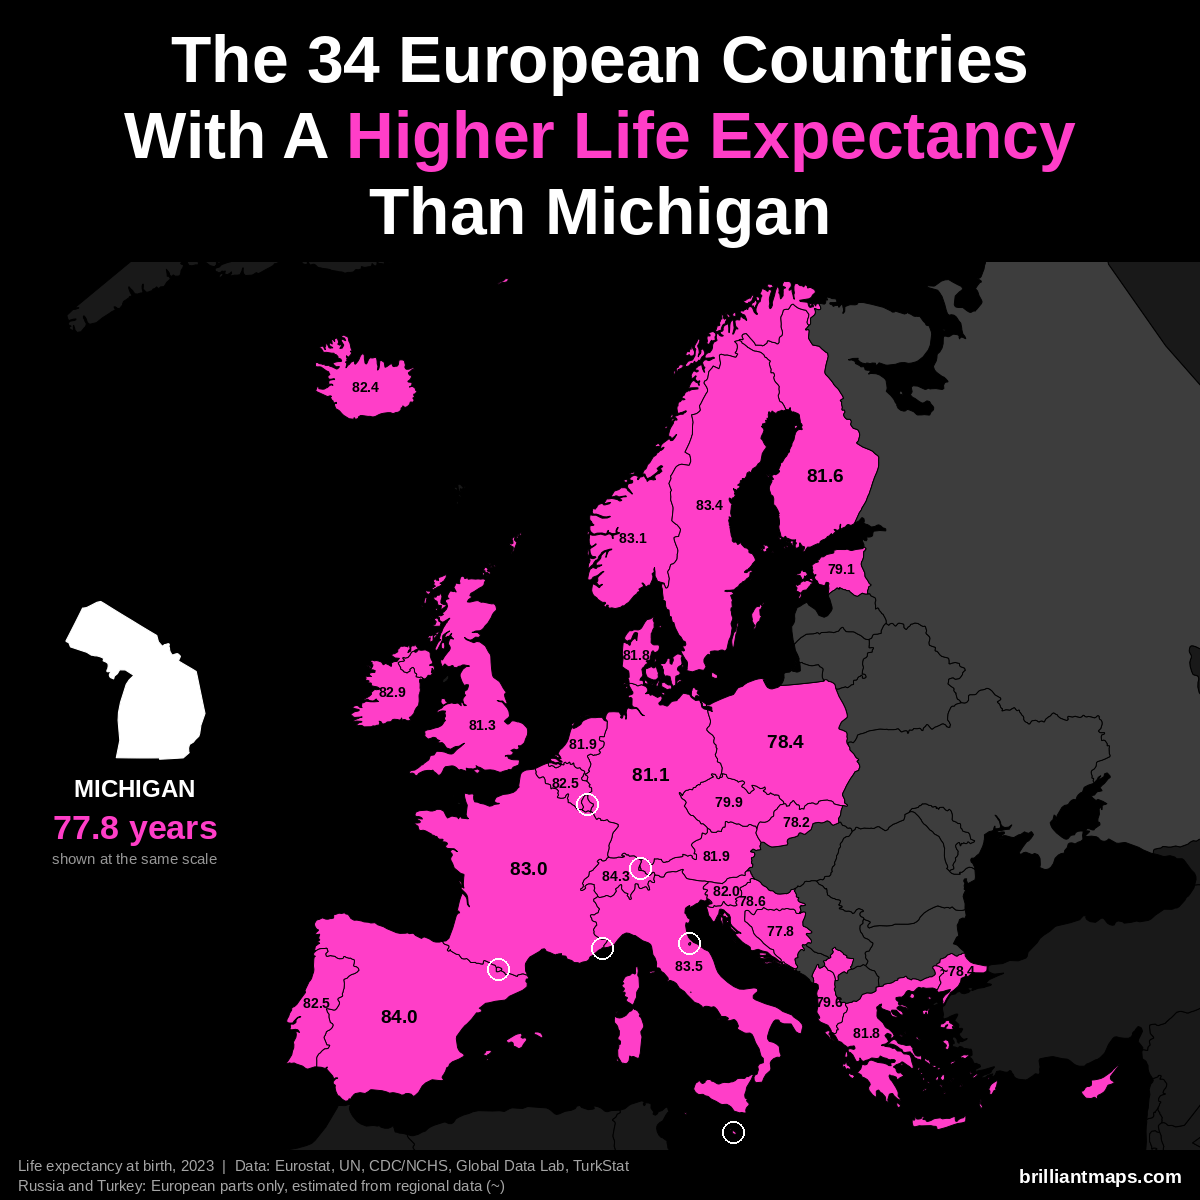
Michigan has a life expectancy at birth of 77.8 years (2023). 34 European countries have a higher life expectancy:
- Monaco: 86.4 years
- San Marino: 85.7 years
- Liechtenstein: 84.6 years
- Switzerland: 84.3 years
- Andorra: 84.0 years
- Spain: 84.0 years
- Italy: 83.5 years
- Luxembourg: 83.4 years
- Malta: 83.4 years
- Sweden: 83.4 years
- Norway: 83.1 years
- France: 83.0 years
- Cyprus: 82.9 years
- Ireland: 82.9 years
- Belgium: 82.5 years
- Portugal: 82.5 years
- Iceland: 82.4 years
- Slovenia: 82.0 years
- Austria: 81.9 years
- Netherlands: 81.9 years
- Denmark: 81.8 years
- Greece: 81.8 years
- Finland: 81.6 years
- United Kingdom: 81.3 years
- Germany: 81.1 years
- Czechia: 79.9 years
- Albania: 79.6 years
- Estonia: 79.1 years
- Croatia: 78.6 years
- Poland: 78.4 years
- Turkey (European part): ~78.4 years
- Slovakia: 78.2 years
- Kosovo: 78.0 years
- Bosnia and Herzegovina: 77.8 years
Minnesota vs Europe
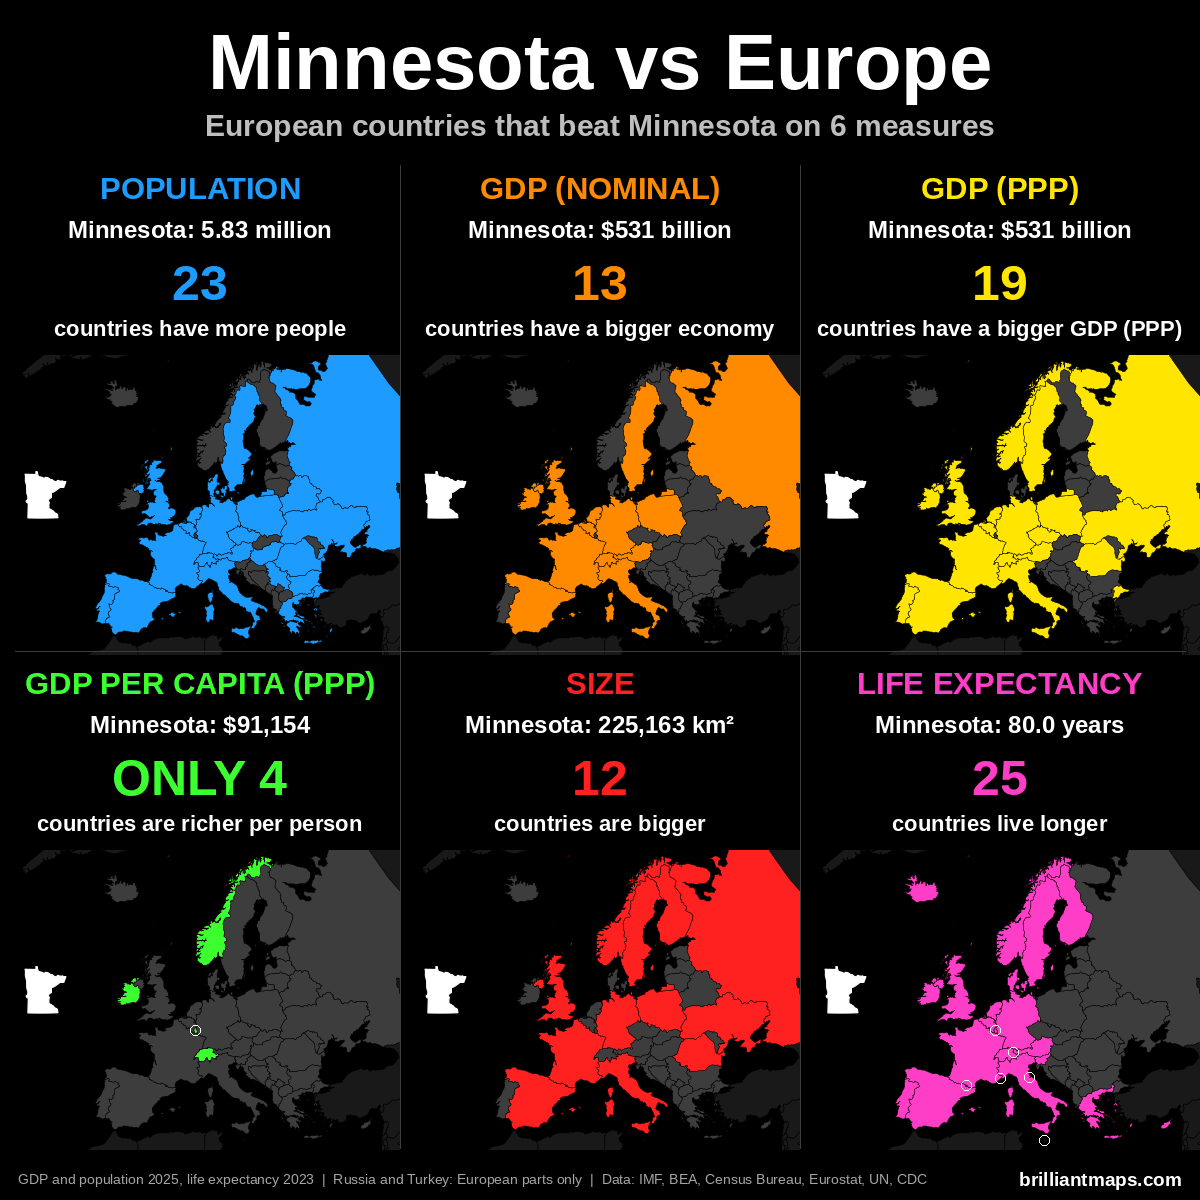
Minnesota Vs European Population
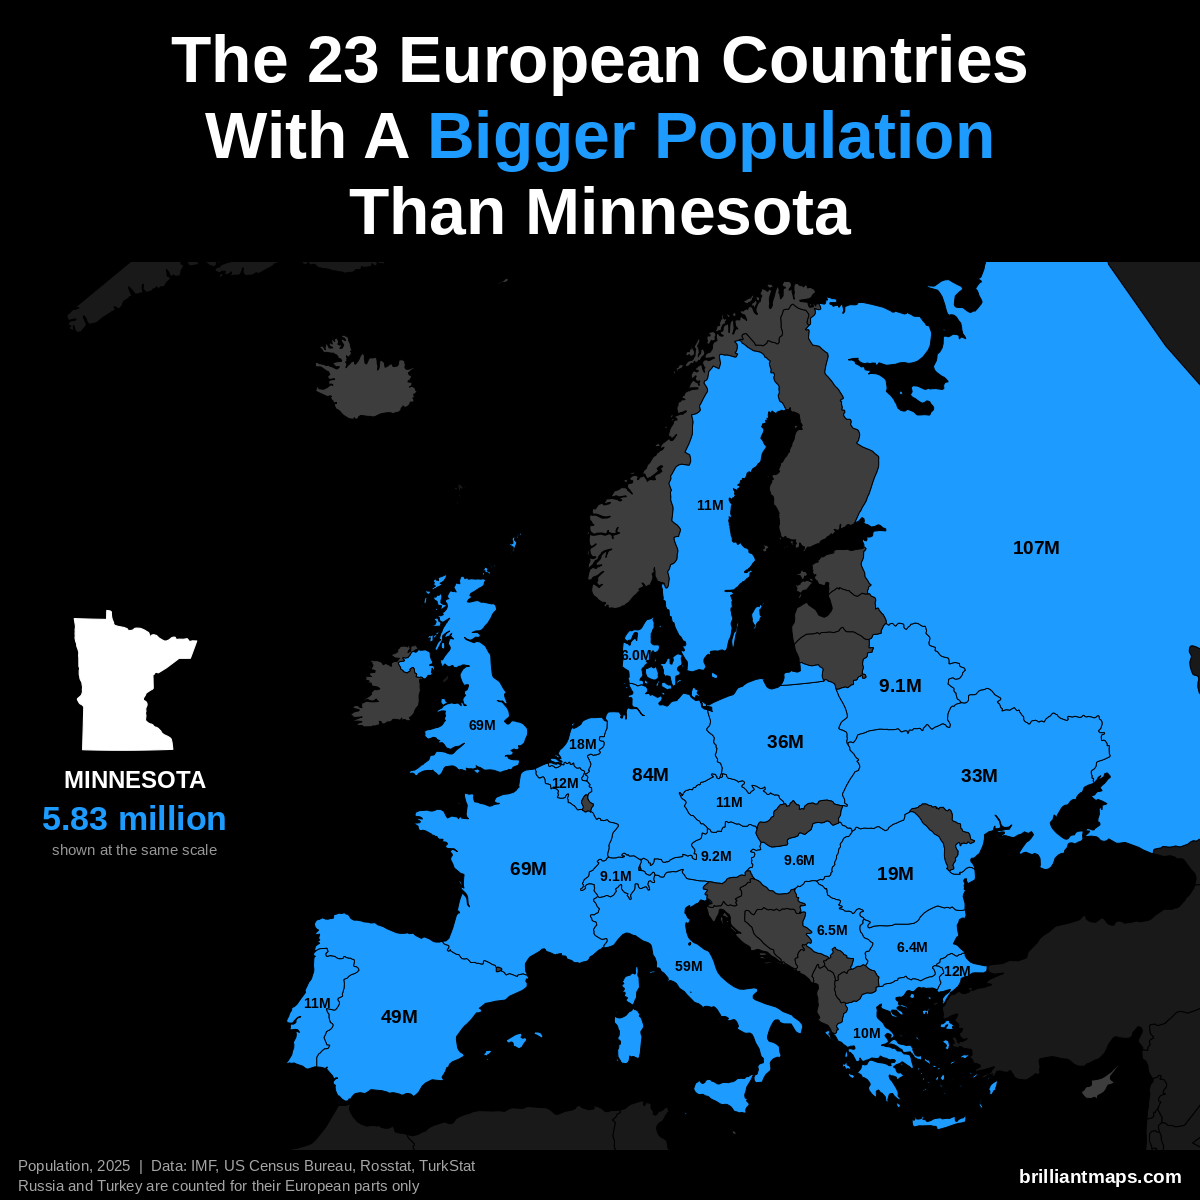
Minnesota has a population of 5.8 million (2025). 23 European countries have a bigger population:
- Russia (European part): 107.0 million
- Germany: 83.5 million
- United Kingdom: 69.5 million
- France: 68.9 million
- Italy: 58.9 million
- Spain: 49.5 million
- Poland: 36.5 million
- Ukraine: 32.9 million
- Romania: 19.0 million
- Netherlands: 18.0 million
- Turkey (European part): 12.2 million
- Belgium: 11.9 million
- Portugal: 10.8 million
- Czechia: 10.8 million
- Sweden: 10.7 million
- Greece: 10.4 million
- Hungary: 9.6 million
- Austria: 9.2 million
- Belarus: 9.1 million
- Switzerland: 9.1 million
- Serbia: 6.5 million
- Bulgaria: 6.4 million
- Denmark: 6.0 million
Minnesota Vs European GDP (Nominal)
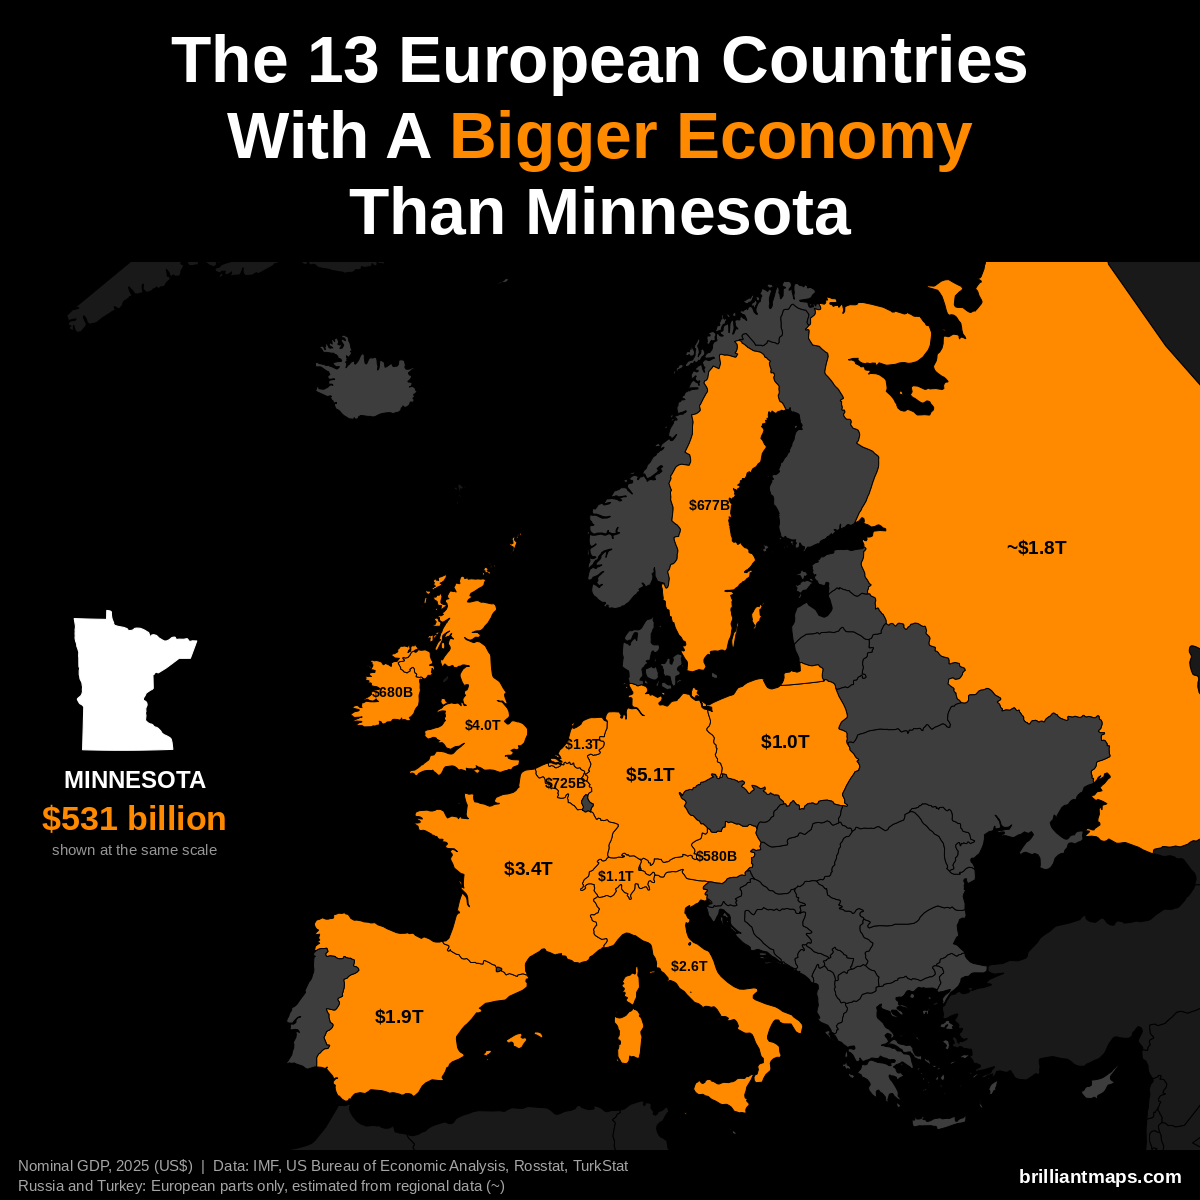
Minnesota has a nominal GDP of $531 billion (2025). 13 European countries have a bigger economy:
- Germany: $5.12 trillion
- United Kingdom: $4.01 trillion
- France: $3.38 trillion
- Italy: $2.55 trillion
- Spain: $1.91 trillion
- Russia (European part): ~$1.83 trillion
- Netherlands: $1.32 trillion
- Switzerland: $1.06 trillion
- Poland: $1.04 trillion
- Belgium: $725 billion
- Ireland: $680 billion
- Sweden: $677 billion
- Austria: $580 billion
Minnesota Vs European GDP (PPP)
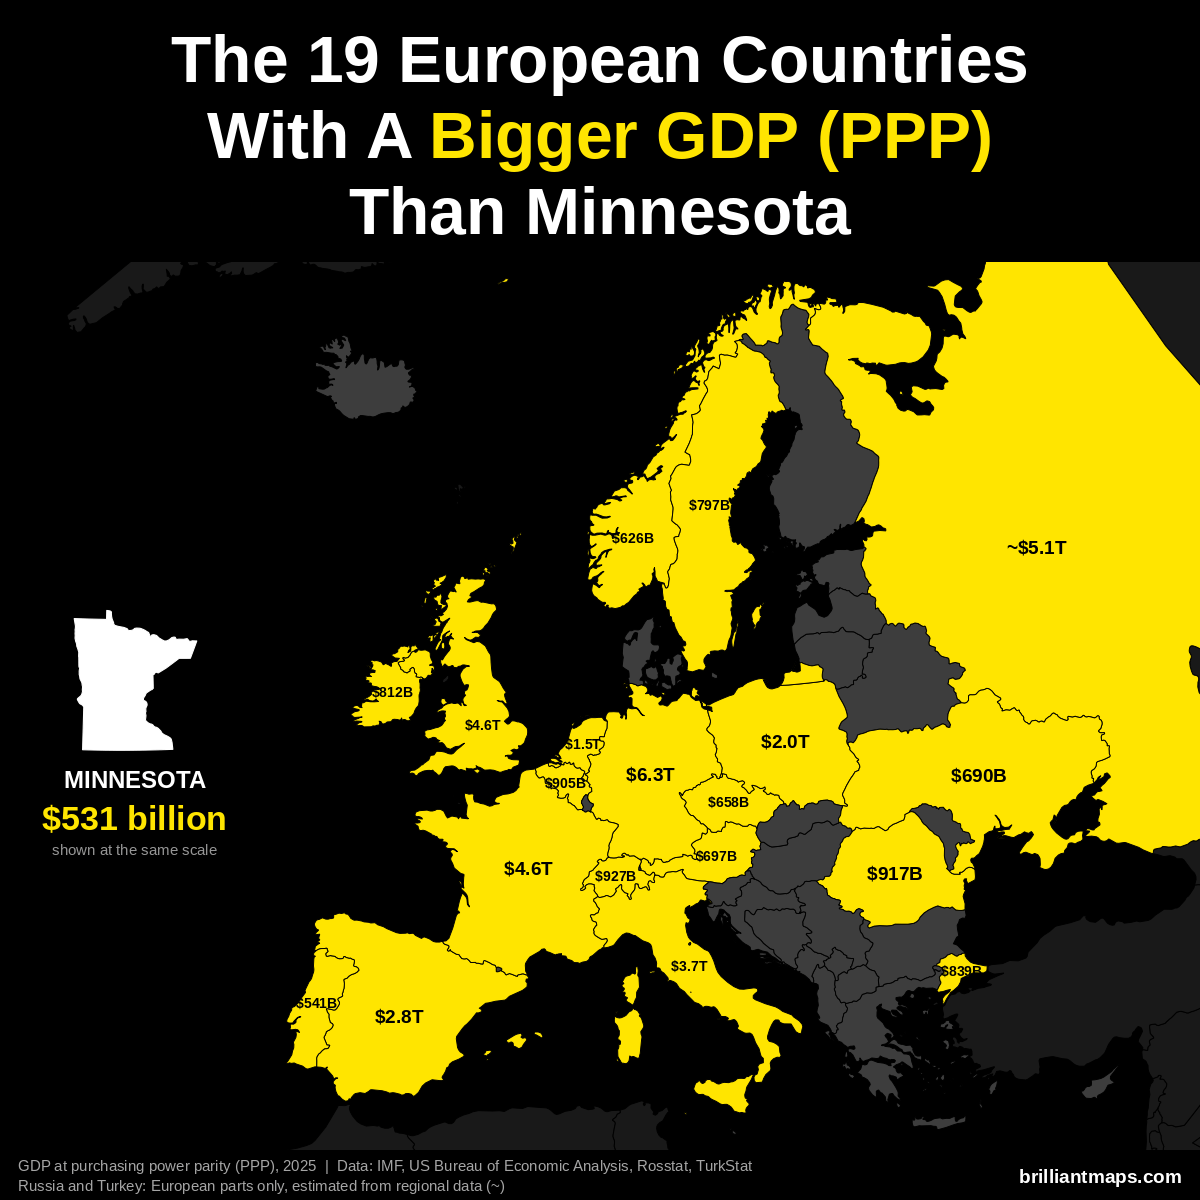
Minnesota has a GDP of $531 billion (2025). US states are already measured in the dollars PPP is based on, so the figure is the same as nominal GDP. 19 European countries have a bigger GDP at purchasing power parity:
- Germany: $6.26 trillion
- Russia (European part): ~$5.14 trillion
- France: $4.58 trillion
- United Kingdom: $4.57 trillion
- Italy: $3.74 trillion
- Spain: $2.83 trillion
- Poland: $2.04 trillion
- Netherlands: $1.52 trillion
- Switzerland: $927 billion
- Romania: $917 billion
- Belgium: $905 billion
- Turkey (European part): ~$839 billion
- Ireland: $812 billion
- Sweden: $797 billion
- Austria: $697 billion
- Ukraine: $690 billion
- Czechia: $658 billion
- Norway: $626 billion
- Portugal: $541 billion
Minnesota Vs European GDP Per Capita (PPP)
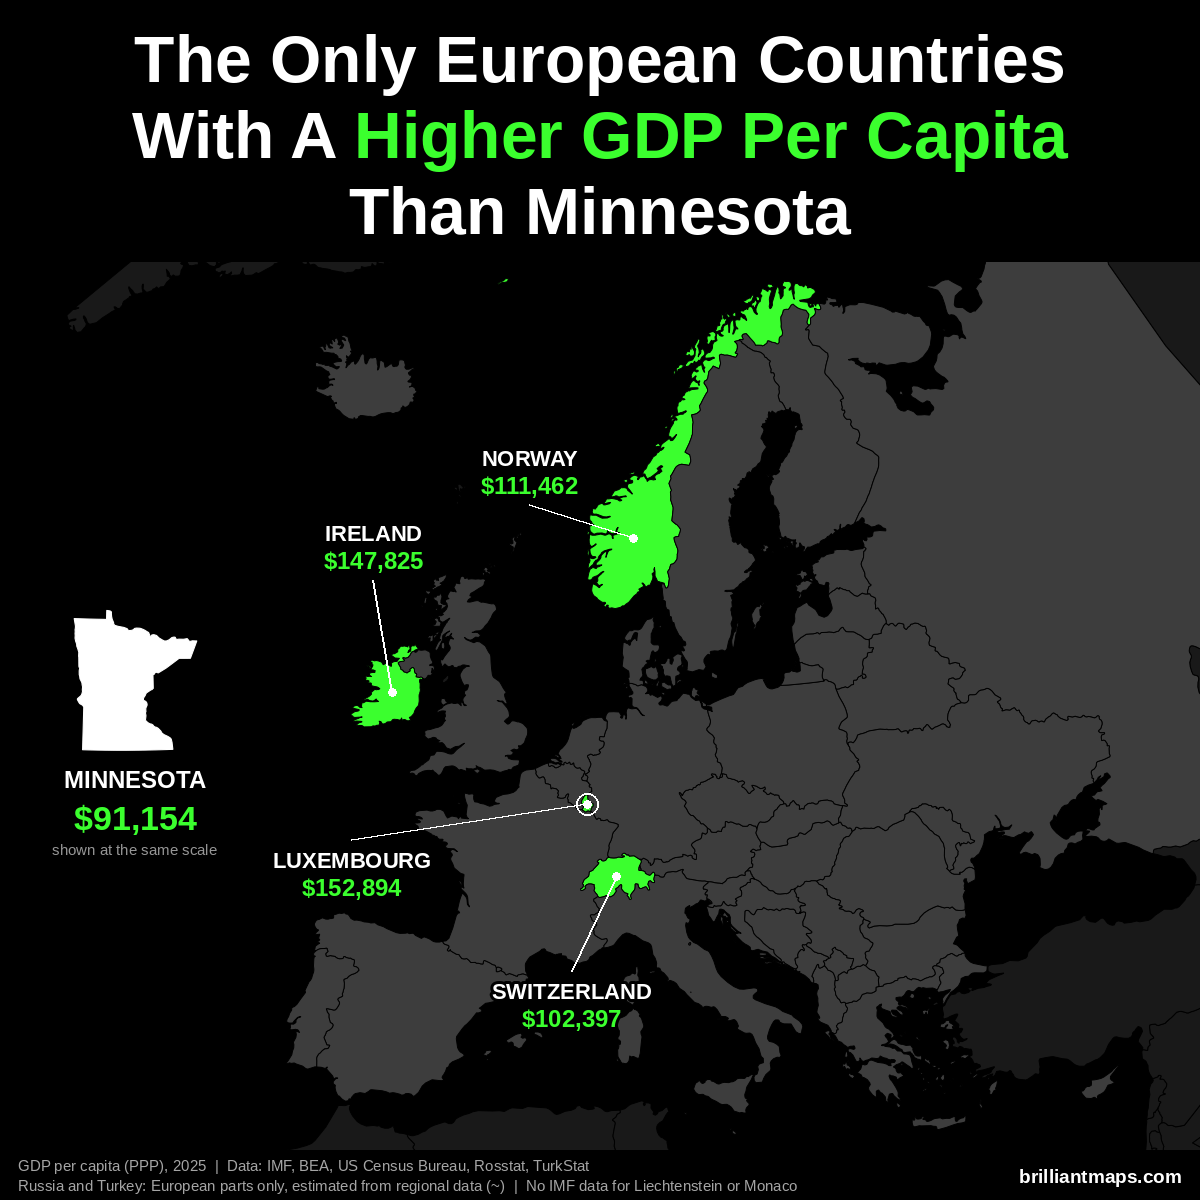
Minnesota has a GDP per capita of $91,154 (2025). Only 4 European countries have a higher GDP per capita at purchasing power parity:
- Luxembourg: $152,894
- Ireland: $147,825
- Norway: $111,462
- Switzerland: $102,397
Liechtenstein and Monaco are not covered by the IMF data and are not counted here.
Minnesota Vs European Size
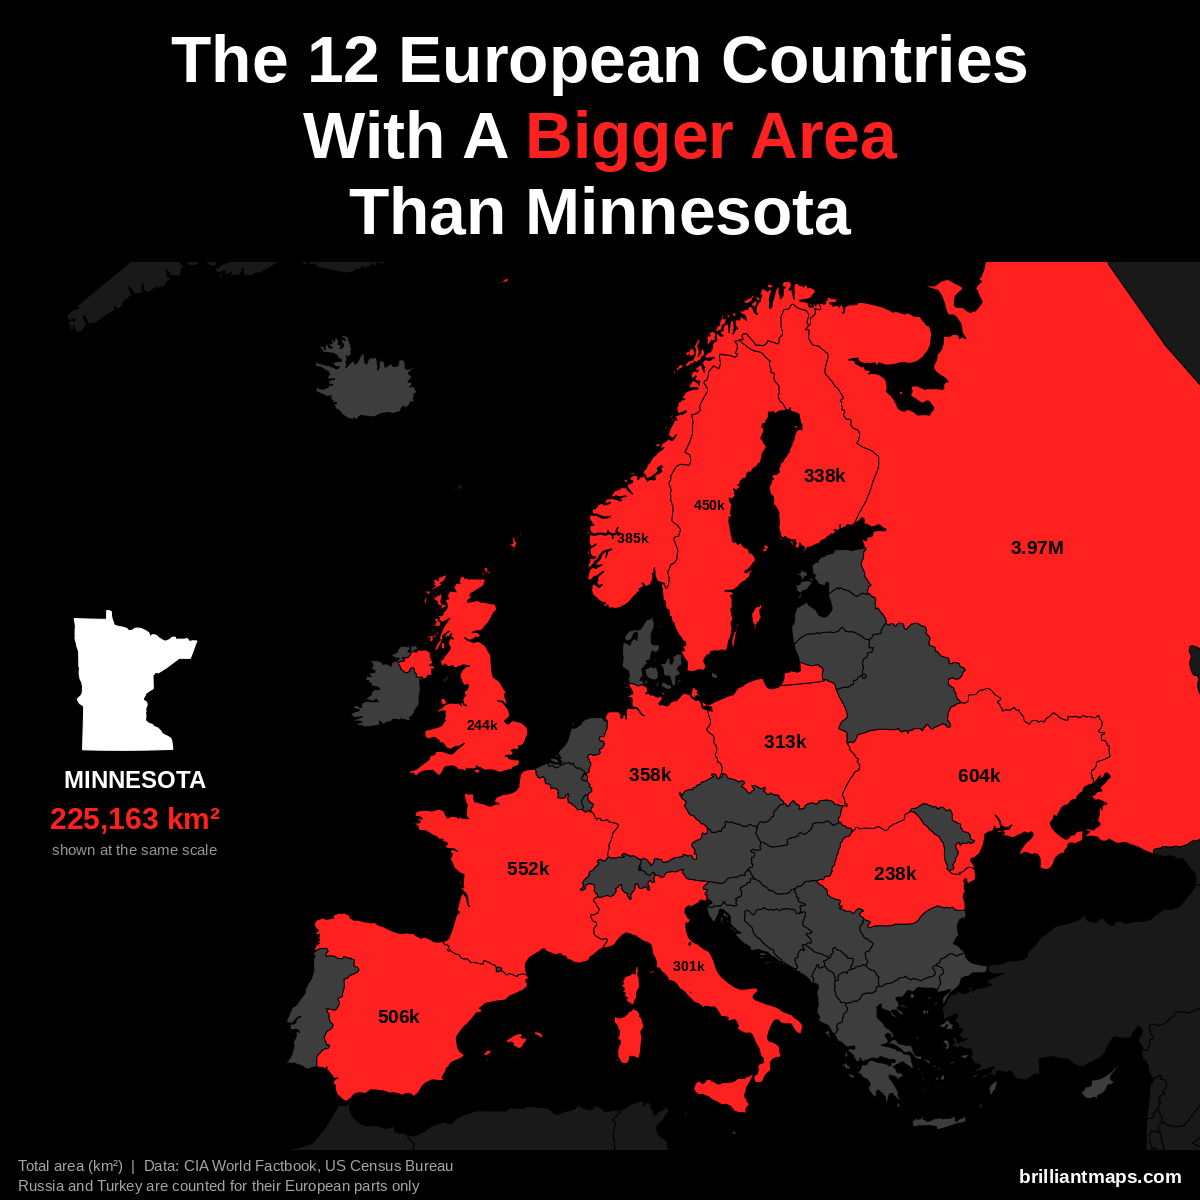
Minnesota has a total area of 225,163 km² (86,936 sq mi). 12 European countries have a bigger area:
- Russia (European part): 3,969,100 km² (1,532,477 sq mi)
- Ukraine: 603,550 km² (233,032 sq mi)
- France: 551,695 km² (213,010 sq mi)
- Spain: 505,990 km² (195,364 sq mi)
- Sweden: 450,295 km² (173,860 sq mi)
- Norway: 385,207 km² (148,729 sq mi)
- Germany: 357,588 km² (138,065 sq mi)
- Finland: 338,455 km² (130,678 sq mi)
- Poland: 312,696 km² (120,733 sq mi)
- Italy: 301,340 km² (116,348 sq mi)
- United Kingdom: 243,610 km² (94,058 sq mi)
- Romania: 238,397 km² (92,046 sq mi)
Minnesota Vs European Life Expectancy
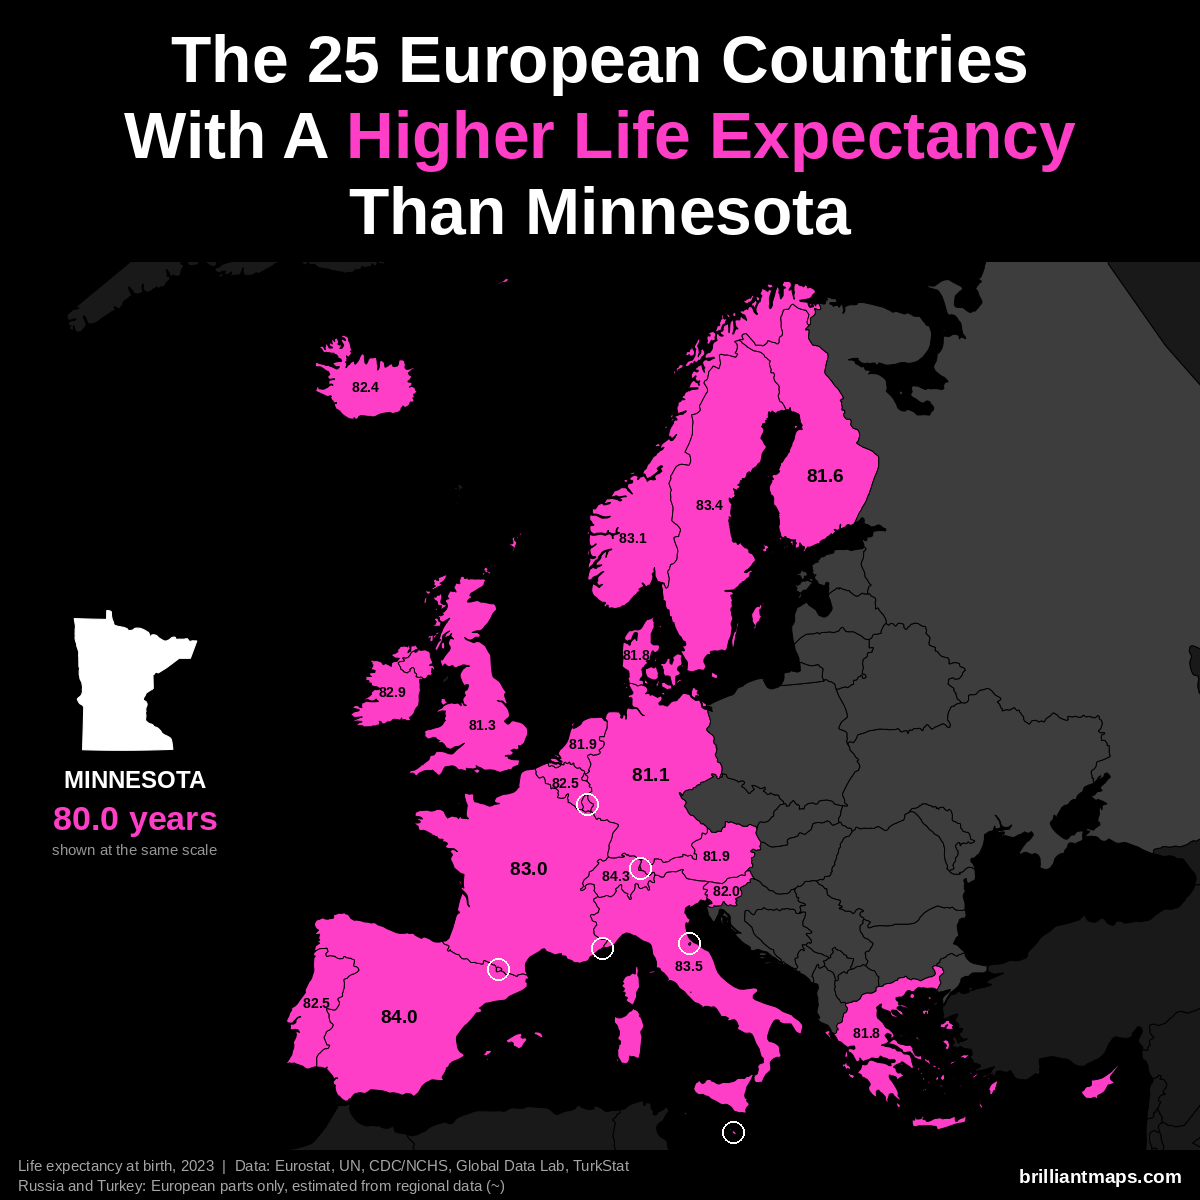
Minnesota has a life expectancy at birth of 80.0 years (2023). 25 European countries have a higher life expectancy:
- Monaco: 86.4 years
- San Marino: 85.7 years
- Liechtenstein: 84.6 years
- Switzerland: 84.3 years
- Andorra: 84.0 years
- Spain: 84.0 years
- Italy: 83.5 years
- Luxembourg: 83.4 years
- Malta: 83.4 years
- Sweden: 83.4 years
- Norway: 83.1 years
- France: 83.0 years
- Cyprus: 82.9 years
- Ireland: 82.9 years
- Belgium: 82.5 years
- Portugal: 82.5 years
- Iceland: 82.4 years
- Slovenia: 82.0 years
- Austria: 81.9 years
- Netherlands: 81.9 years
- Denmark: 81.8 years
- Greece: 81.8 years
- Finland: 81.6 years
- United Kingdom: 81.3 years
- Germany: 81.1 years
Mississippi vs Europe
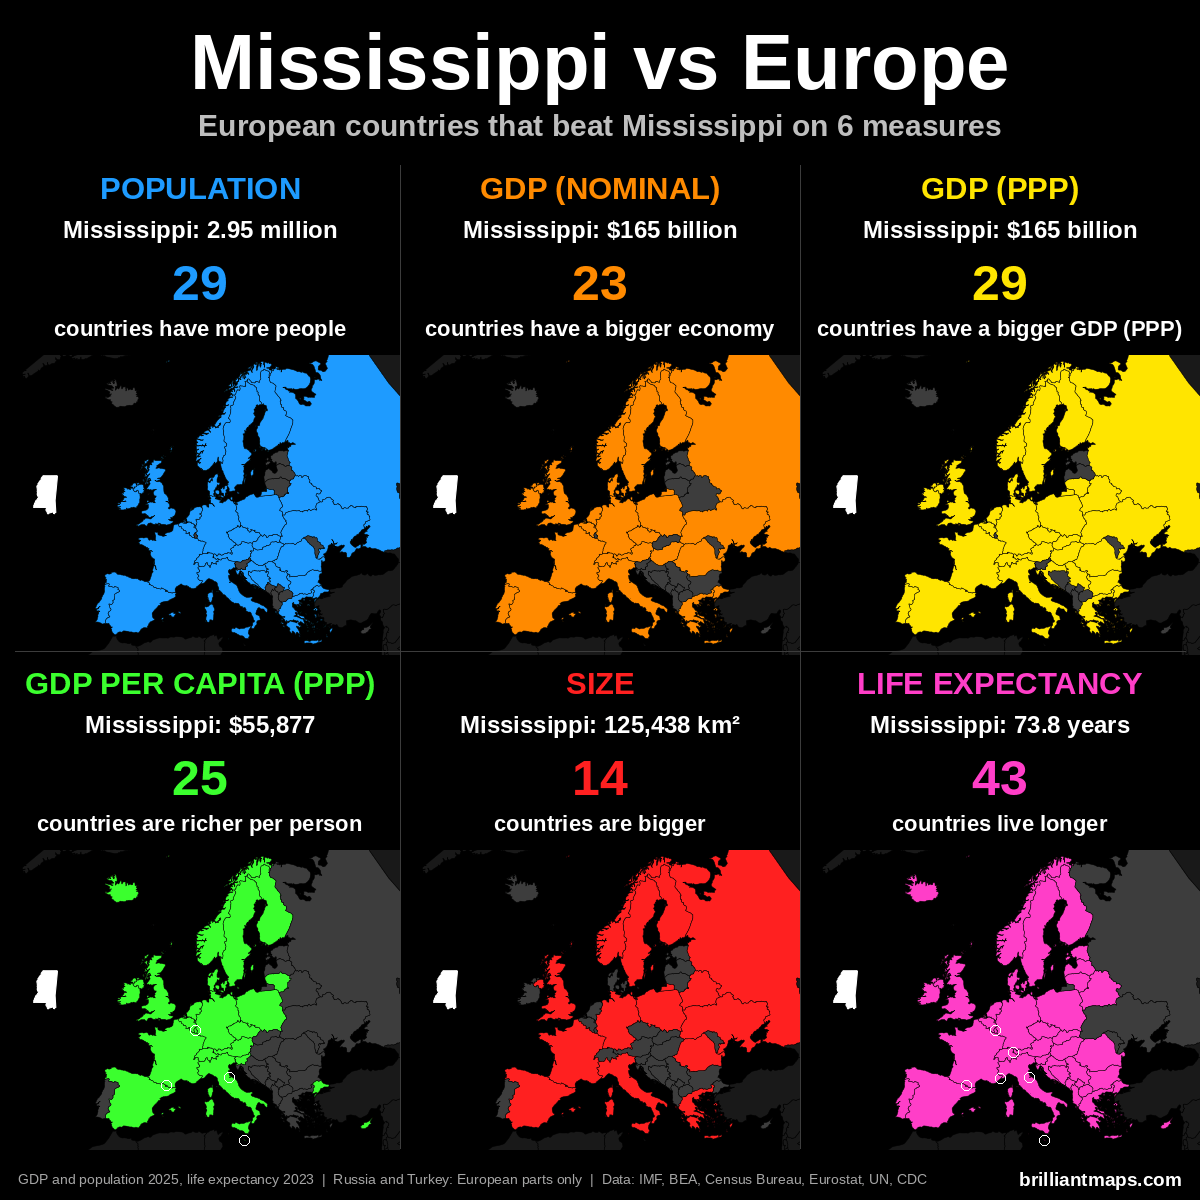
Mississippi Vs European Population
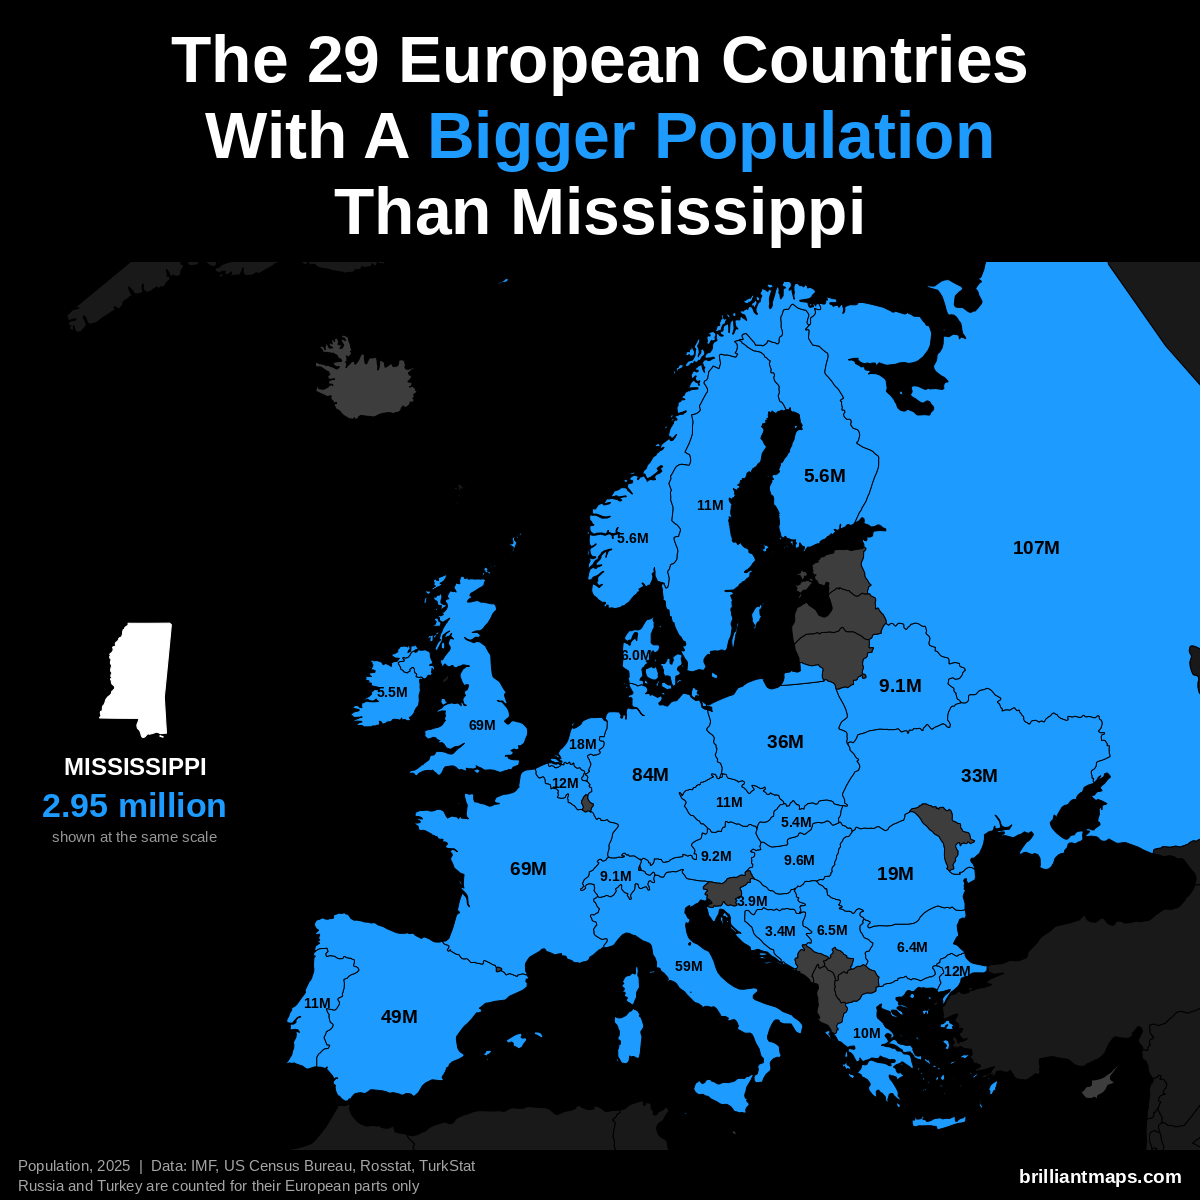
Mississippi has a population of 3.0 million (2025). 29 European countries have a bigger population:
- Russia (European part): 107.0 million
- Germany: 83.5 million
- United Kingdom: 69.5 million
- France: 68.9 million
- Italy: 58.9 million
- Spain: 49.5 million
- Poland: 36.5 million
- Ukraine: 32.9 million
- Romania: 19.0 million
- Netherlands: 18.0 million
- Turkey (European part): 12.2 million
- Belgium: 11.9 million
- Portugal: 10.8 million
- Czechia: 10.8 million
- Sweden: 10.7 million
- Greece: 10.4 million
- Hungary: 9.6 million
- Austria: 9.2 million
- Belarus: 9.1 million
- Switzerland: 9.1 million
- Serbia: 6.5 million
- Bulgaria: 6.4 million
- Denmark: 6.0 million
- Norway: 5.6 million
- Finland: 5.6 million
- Ireland: 5.5 million
- Slovakia: 5.4 million
- Croatia: 3.9 million
- Bosnia and Herzegovina: 3.4 million
Mississippi Vs European GDP (Nominal)
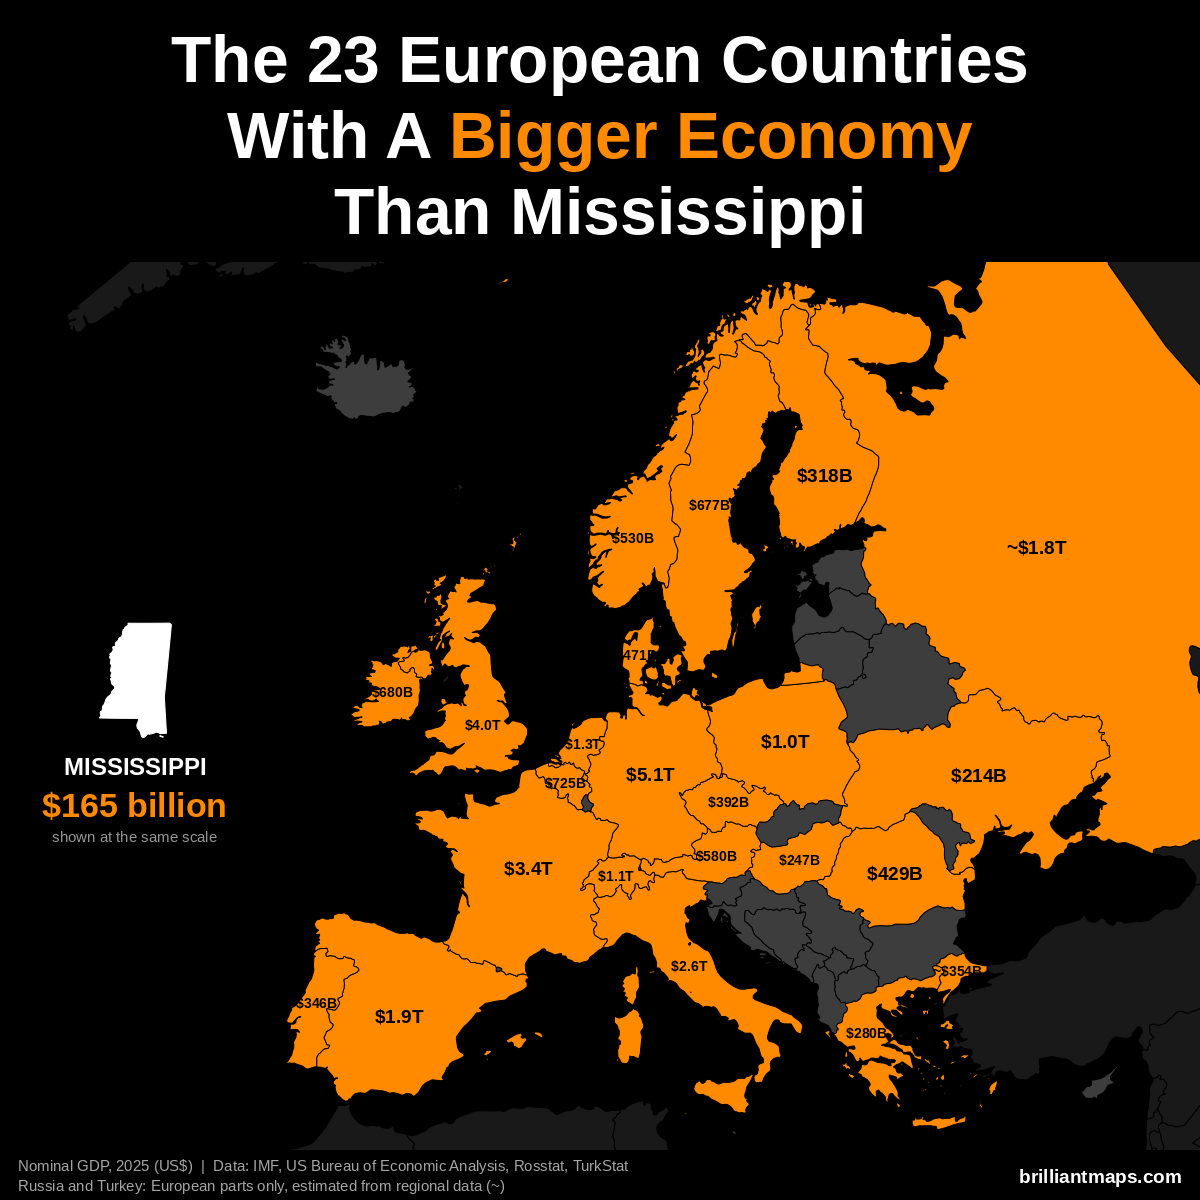
Mississippi has a nominal GDP of $165 billion (2025). 23 European countries have a bigger economy:
- Germany: $5.12 trillion
- United Kingdom: $4.01 trillion
- France: $3.38 trillion
- Italy: $2.55 trillion
- Spain: $1.91 trillion
- Russia (European part): ~$1.83 trillion
- Netherlands: $1.32 trillion
- Switzerland: $1.06 trillion
- Poland: $1.04 trillion
- Belgium: $725 billion
- Ireland: $680 billion
- Sweden: $677 billion
- Austria: $580 billion
- Norway: $530 billion
- Denmark: $471 billion
- Romania: $429 billion
- Czechia: $392 billion
- Turkey (European part): ~$354 billion
- Portugal: $346 billion
- Finland: $318 billion
- Greece: $280 billion
- Hungary: $247 billion
- Ukraine: $214 billion
Mississippi Vs European GDP (PPP)
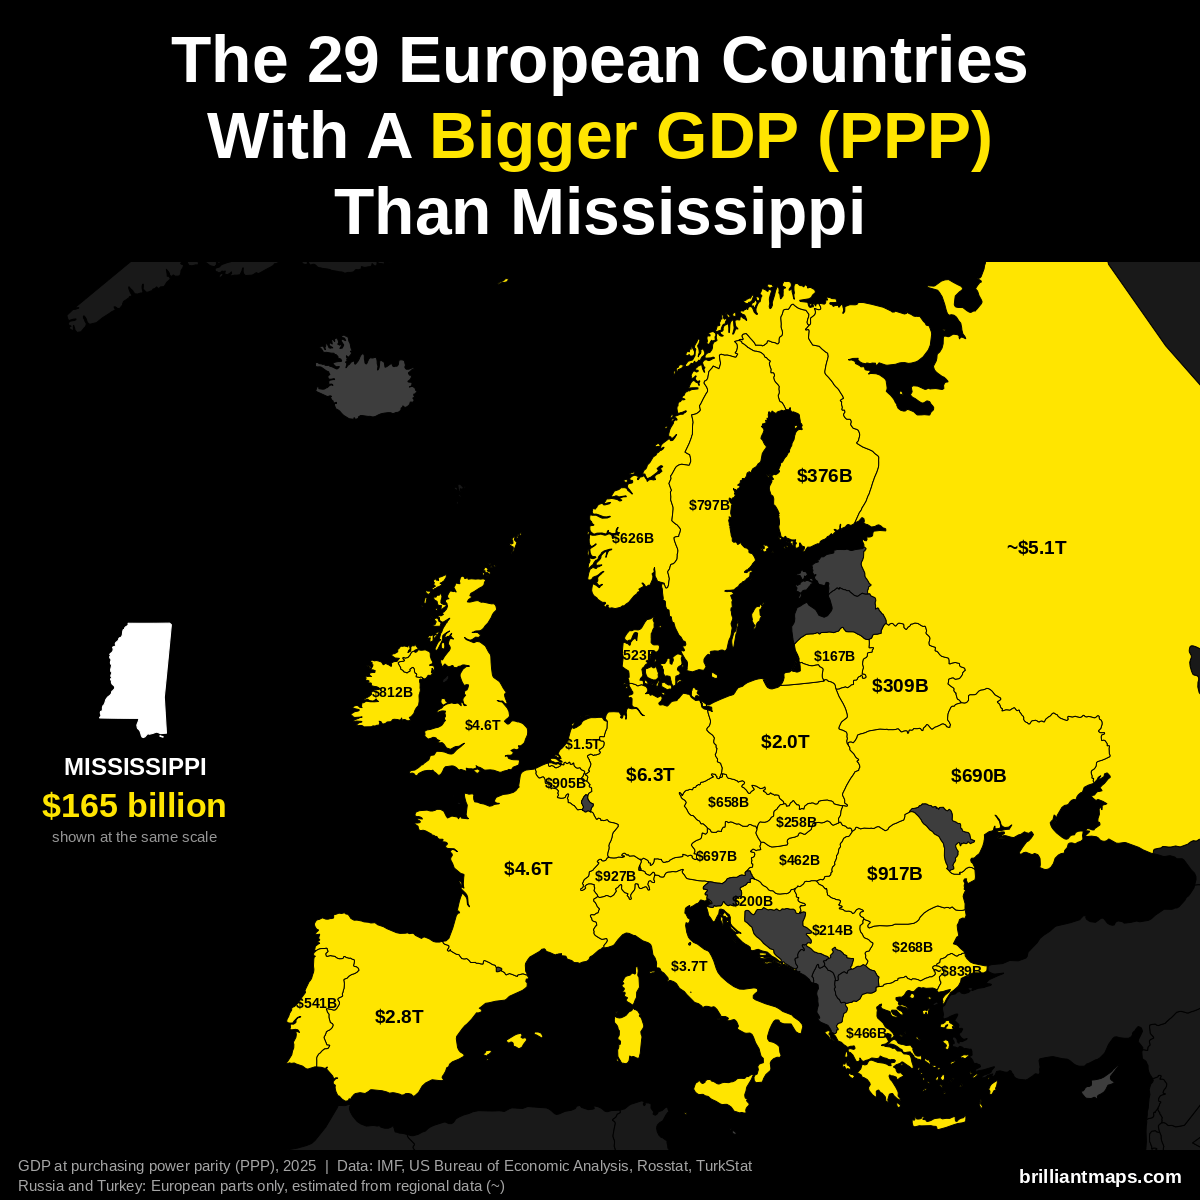
Mississippi has a GDP of $165 billion (2025). US states are already measured in the dollars PPP is based on, so the figure is the same as nominal GDP. 29 European countries have a bigger GDP at purchasing power parity:
- Germany: $6.26 trillion
- Russia (European part): ~$5.14 trillion
- France: $4.58 trillion
- United Kingdom: $4.57 trillion
- Italy: $3.74 trillion
- Spain: $2.83 trillion
- Poland: $2.04 trillion
- Netherlands: $1.52 trillion
- Switzerland: $927 billion
- Romania: $917 billion
- Belgium: $905 billion
- Turkey (European part): ~$839 billion
- Ireland: $812 billion
- Sweden: $797 billion
- Austria: $697 billion
- Ukraine: $690 billion
- Czechia: $658 billion
- Norway: $626 billion
- Portugal: $541 billion
- Denmark: $523 billion
- Greece: $466 billion
- Hungary: $462 billion
- Finland: $376 billion
- Belarus: $309 billion
- Bulgaria: $268 billion
- Slovakia: $258 billion
- Serbia: $214 billion
- Croatia: $200 billion
- Lithuania: $167 billion
Mississippi Vs European GDP Per Capita (PPP)
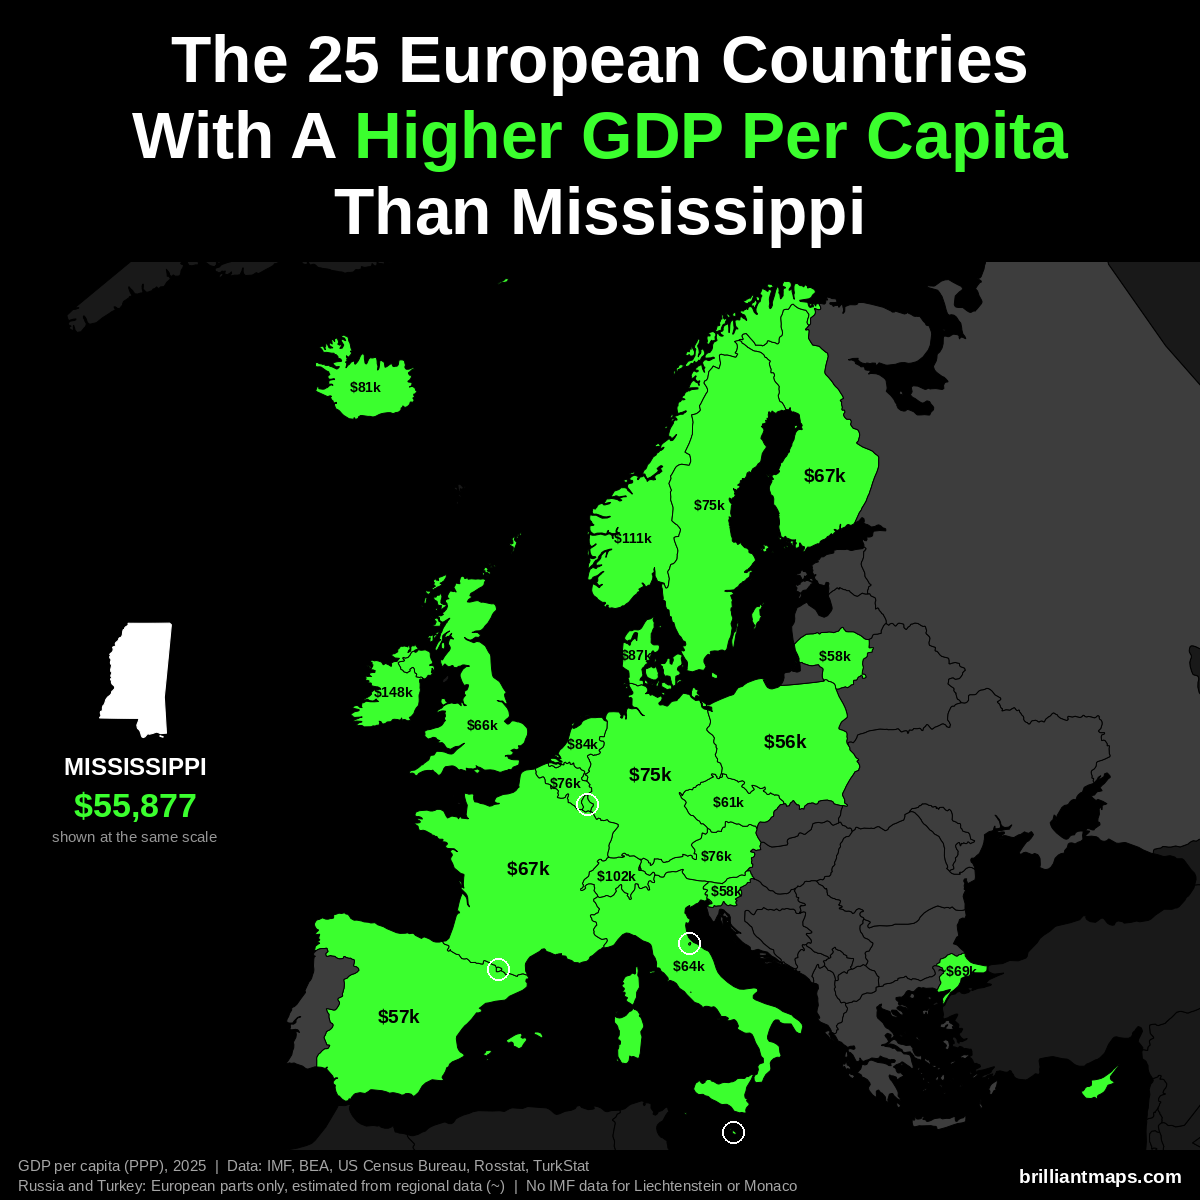
Mississippi has a GDP per capita of $55,877 (2025). 25 European countries have a higher GDP per capita at purchasing power parity:
- Luxembourg: $152,894
- Ireland: $147,825
- Norway: $111,462
- Switzerland: $102,397
- Denmark: $87,303
- Netherlands: $84,445
- San Marino: $83,838
- Iceland: $80,915
- Belgium: $76,136
- Austria: $75,965
- Malta: $75,687
- Germany: $74,901
- Sweden: $74,651
- Andorra: $74,059
- Turkey (European part): ~$68,800
- Finland: $67,097
- France: $66,559
- United Kingdom: $65,758
- Cyprus: $65,038
- Italy: $63,508
- Czechia: $60,899
- Slovenia: $58,465
- Lithuania: $57,826
- Spain: $57,282
- Poland: $55,940
Liechtenstein and Monaco are not covered by the IMF data and are not counted here.
Mississippi Vs European Size
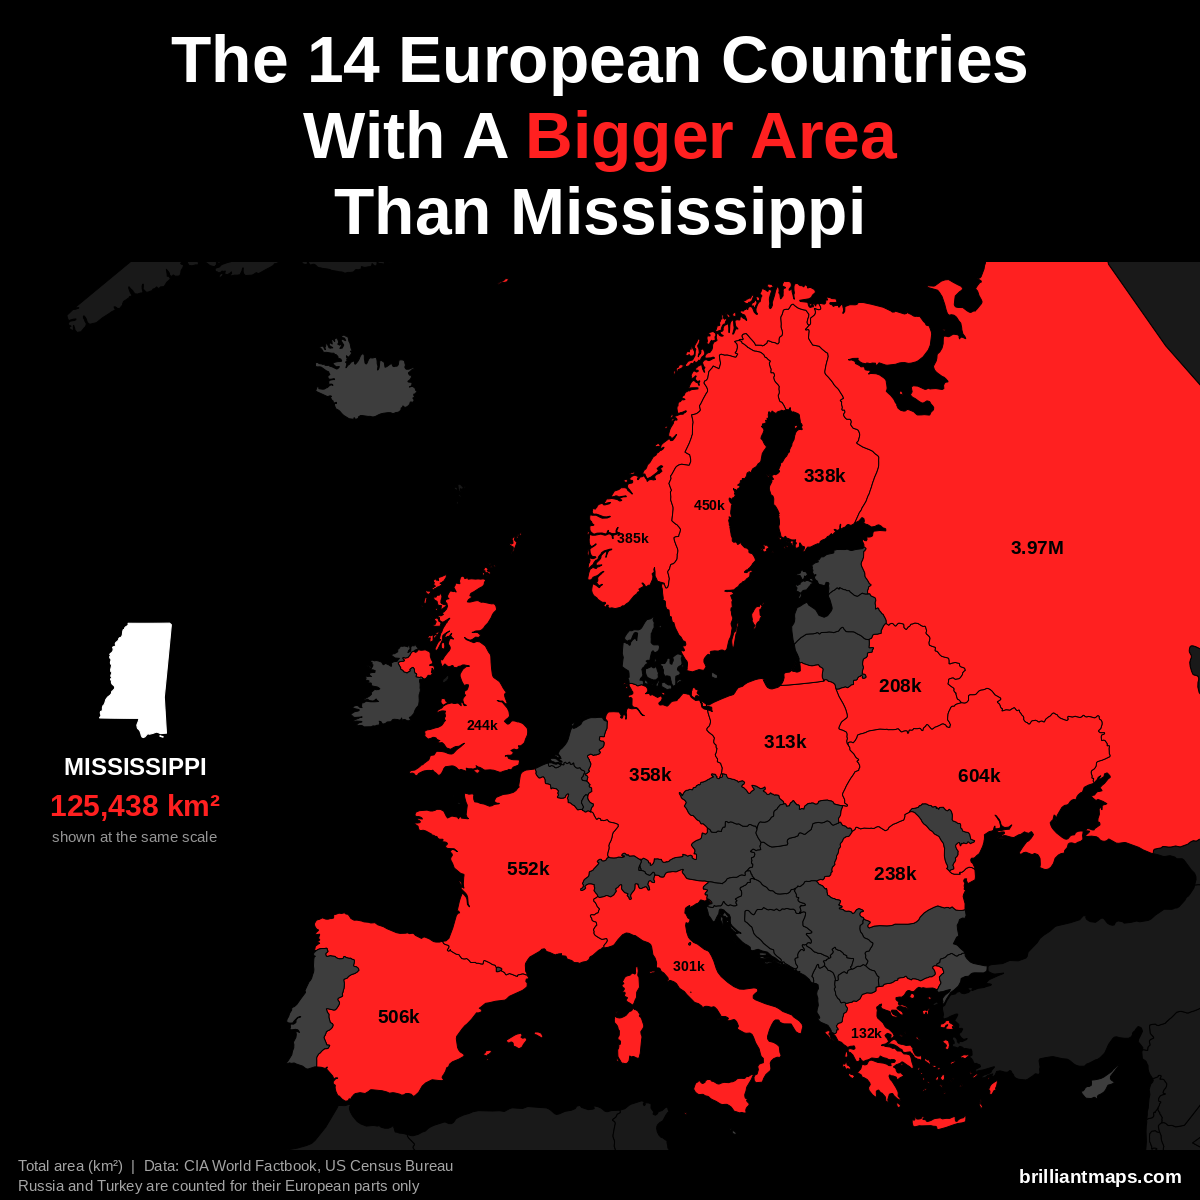
Mississippi has a total area of 125,438 km² (48,432 sq mi). 14 European countries have a bigger area:
- Russia (European part): 3,969,100 km² (1,532,477 sq mi)
- Ukraine: 603,550 km² (233,032 sq mi)
- France: 551,695 km² (213,010 sq mi)
- Spain: 505,990 km² (195,364 sq mi)
- Sweden: 450,295 km² (173,860 sq mi)
- Norway: 385,207 km² (148,729 sq mi)
- Germany: 357,588 km² (138,065 sq mi)
- Finland: 338,455 km² (130,678 sq mi)
- Poland: 312,696 km² (120,733 sq mi)
- Italy: 301,340 km² (116,348 sq mi)
- United Kingdom: 243,610 km² (94,058 sq mi)
- Romania: 238,397 km² (92,046 sq mi)
- Belarus: 207,600 km² (80,155 sq mi)
- Greece: 131,957 km² (50,949 sq mi)
Mississippi Vs European Life Expectancy
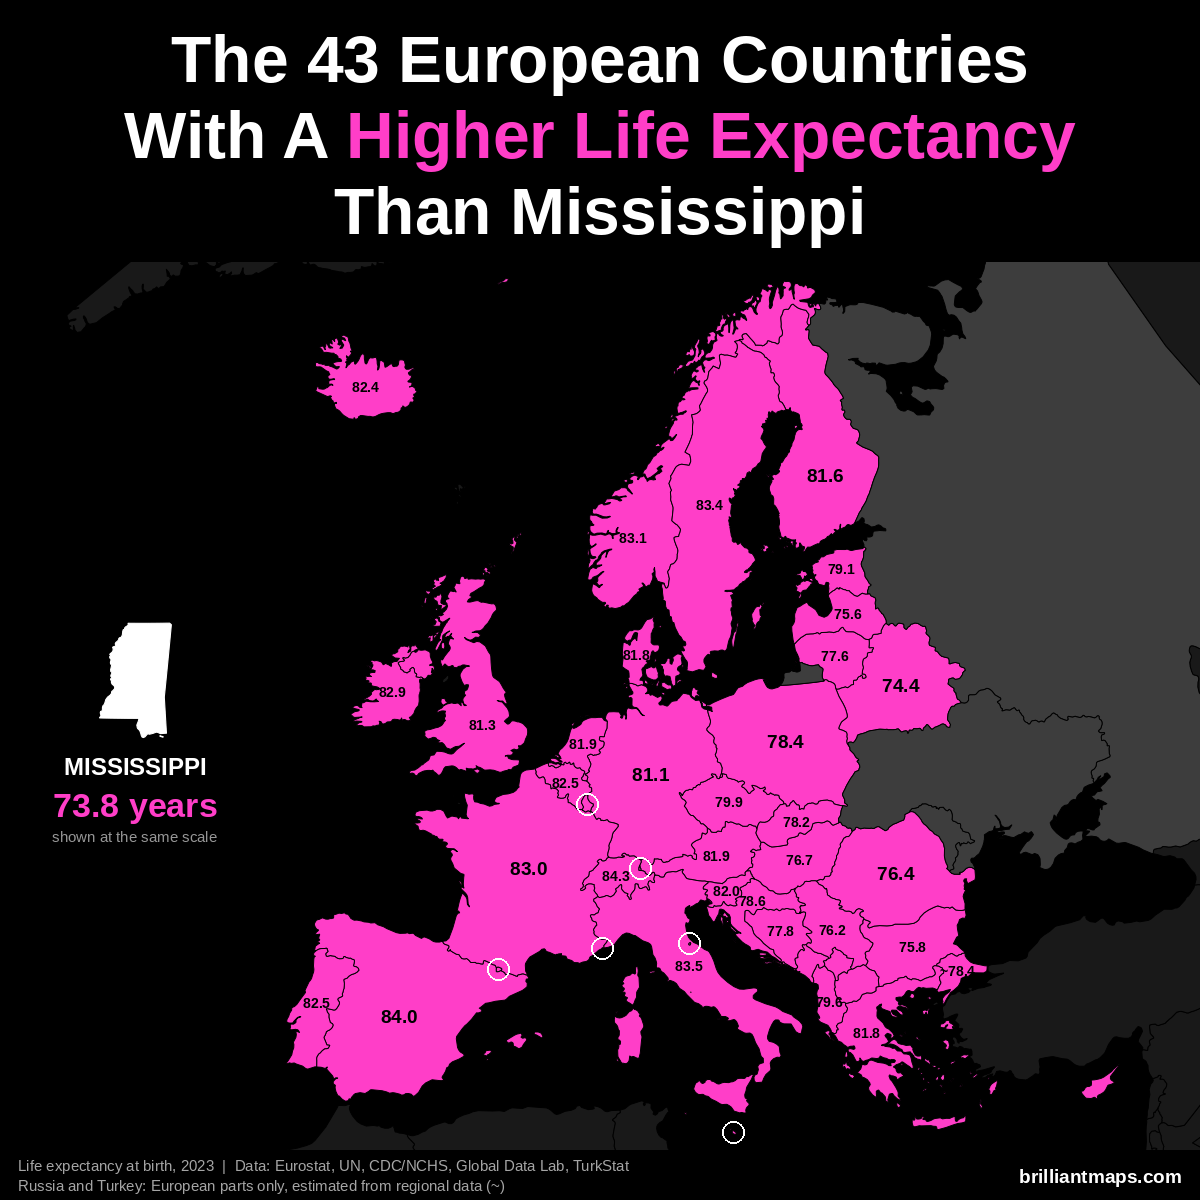
Mississippi has a life expectancy at birth of 73.8 years (2023). 43 European countries have a higher life expectancy:
- Monaco: 86.4 years
- San Marino: 85.7 years
- Liechtenstein: 84.6 years
- Switzerland: 84.3 years
- Andorra: 84.0 years
- Spain: 84.0 years
- Italy: 83.5 years
- Luxembourg: 83.4 years
- Malta: 83.4 years
- Sweden: 83.4 years
- Norway: 83.1 years
- France: 83.0 years
- Cyprus: 82.9 years
- Ireland: 82.9 years
- Belgium: 82.5 years
- Portugal: 82.5 years
- Iceland: 82.4 years
- Slovenia: 82.0 years
- Austria: 81.9 years
- Netherlands: 81.9 years
- Denmark: 81.8 years
- Greece: 81.8 years
- Finland: 81.6 years
- United Kingdom: 81.3 years
- Germany: 81.1 years
- Czechia: 79.9 years
- Albania: 79.6 years
- Estonia: 79.1 years
- Croatia: 78.6 years
- Poland: 78.4 years
- Turkey (European part): ~78.4 years
- Slovakia: 78.2 years
- Kosovo: 78.0 years
- Bosnia and Herzegovina: 77.8 years
- Lithuania: 77.6 years
- Montenegro: 77.6 years
- North Macedonia: 77.4 years
- Hungary: 76.7 years
- Romania: 76.4 years
- Serbia: 76.2 years
- Bulgaria: 75.8 years
- Latvia: 75.6 years
- Belarus: 74.4 years
Missouri vs Europe
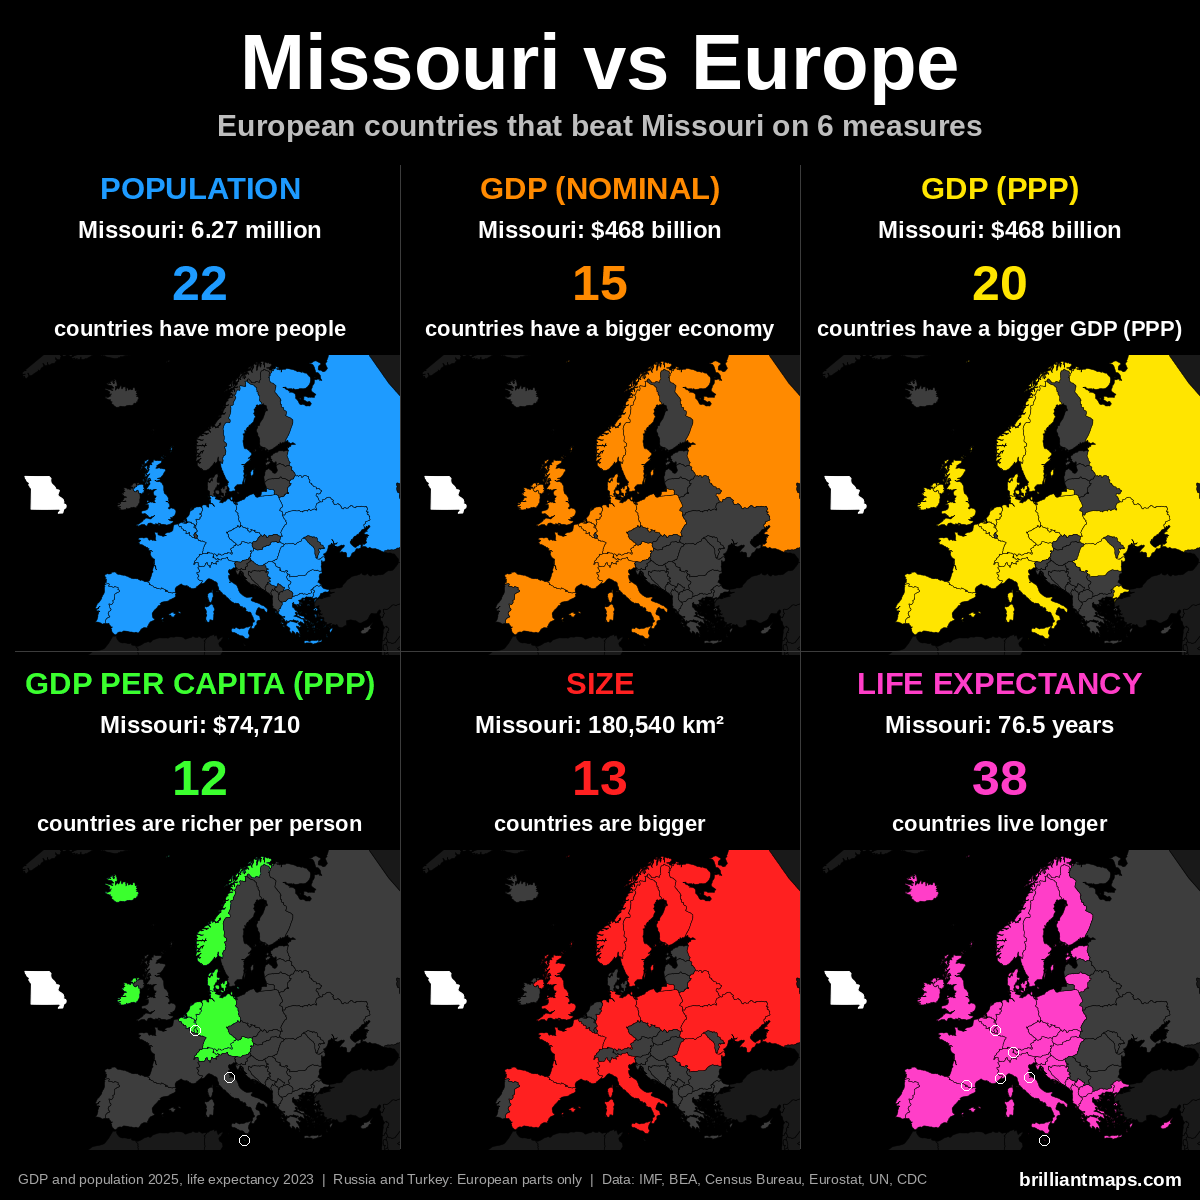
Missouri Vs European Population
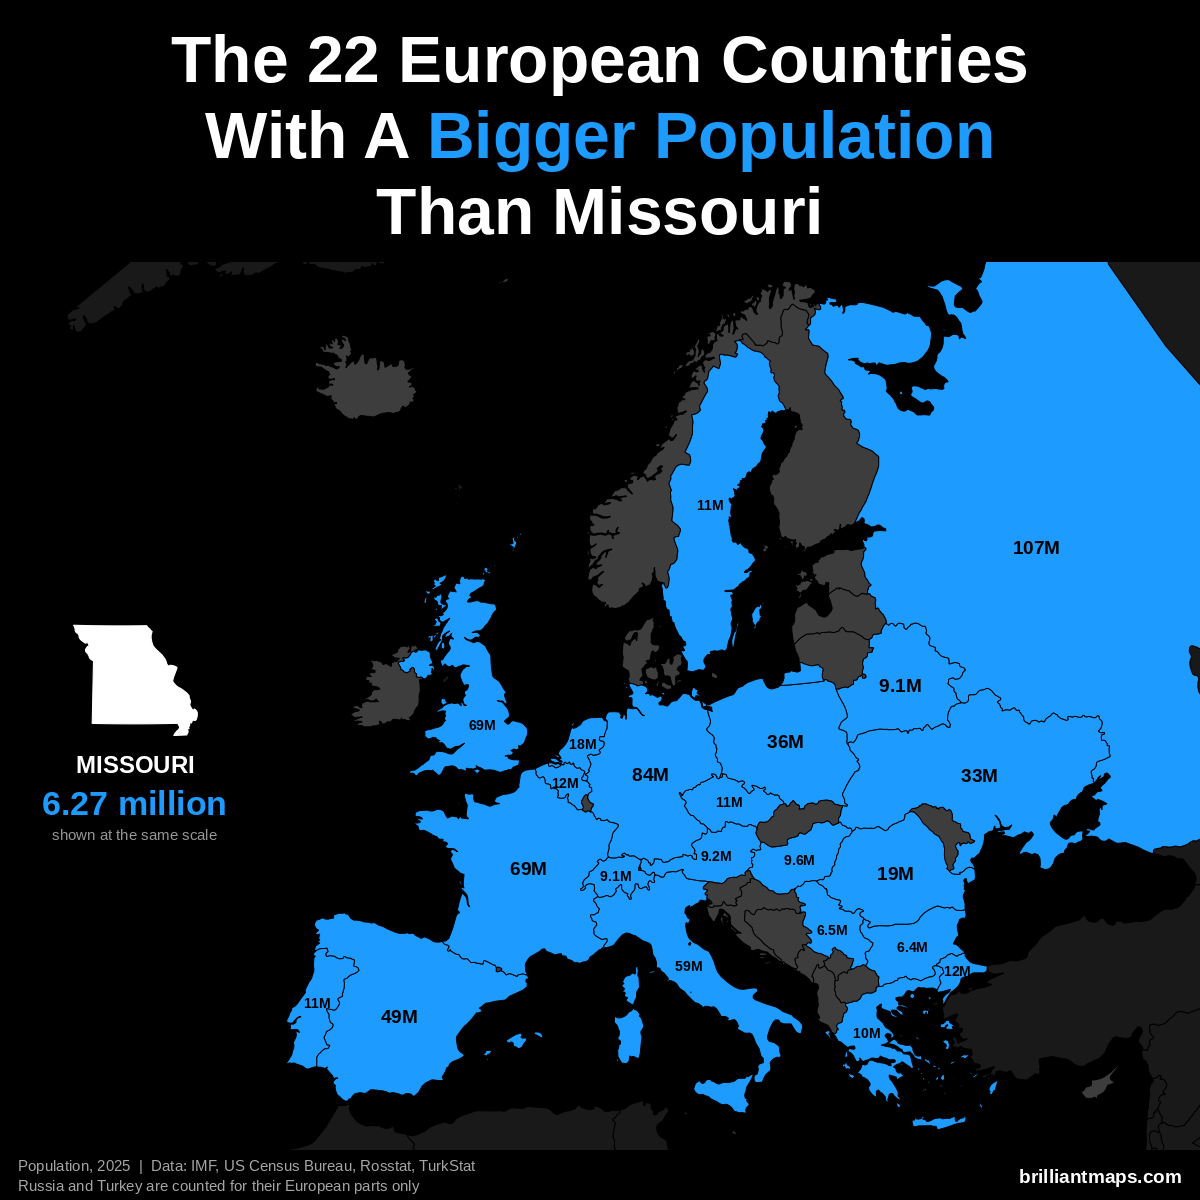
Missouri has a population of 6.3 million (2025). 22 European countries have a bigger population:
- Russia (European part): 107.0 million
- Germany: 83.5 million
- United Kingdom: 69.5 million
- France: 68.9 million
- Italy: 58.9 million
- Spain: 49.5 million
- Poland: 36.5 million
- Ukraine: 32.9 million
- Romania: 19.0 million
- Netherlands: 18.0 million
- Turkey (European part): 12.2 million
- Belgium: 11.9 million
- Portugal: 10.8 million
- Czechia: 10.8 million
- Sweden: 10.7 million
- Greece: 10.4 million
- Hungary: 9.6 million
- Austria: 9.2 million
- Belarus: 9.1 million
- Switzerland: 9.1 million
- Serbia: 6.5 million
- Bulgaria: 6.4 million
Missouri Vs European GDP (Nominal)
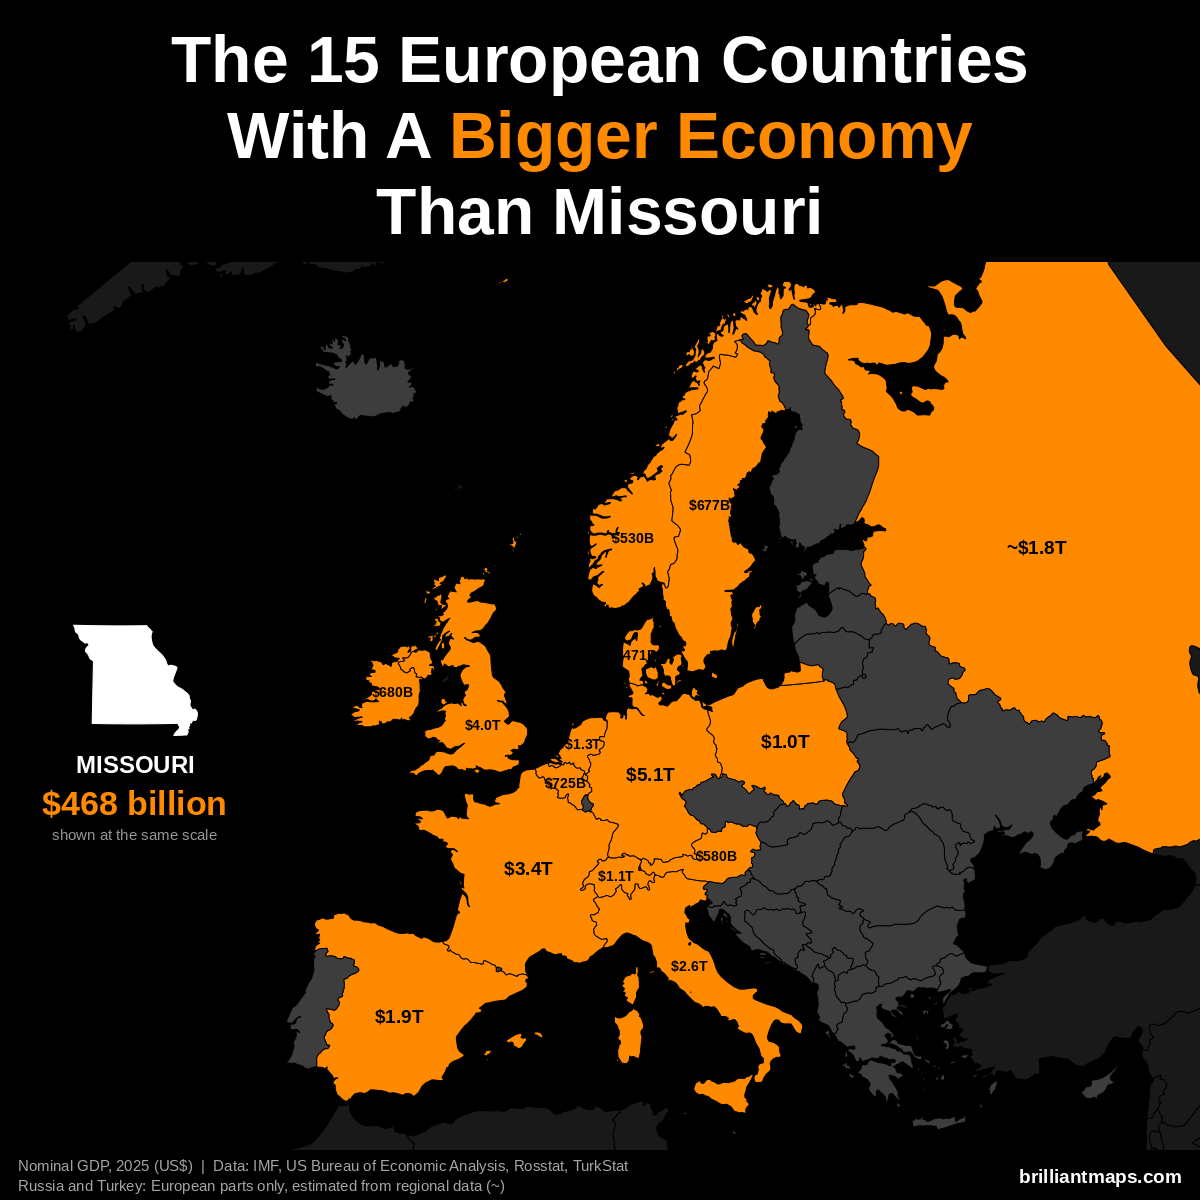
Missouri has a nominal GDP of $468 billion (2025). 15 European countries have a bigger economy:
- Germany: $5.12 trillion
- United Kingdom: $4.01 trillion
- France: $3.38 trillion
- Italy: $2.55 trillion
- Spain: $1.91 trillion
- Russia (European part): ~$1.83 trillion
- Netherlands: $1.32 trillion
- Switzerland: $1.06 trillion
- Poland: $1.04 trillion
- Belgium: $725 billion
- Ireland: $680 billion
- Sweden: $677 billion
- Austria: $580 billion
- Norway: $530 billion
- Denmark: $471 billion
Missouri Vs European GDP (PPP)
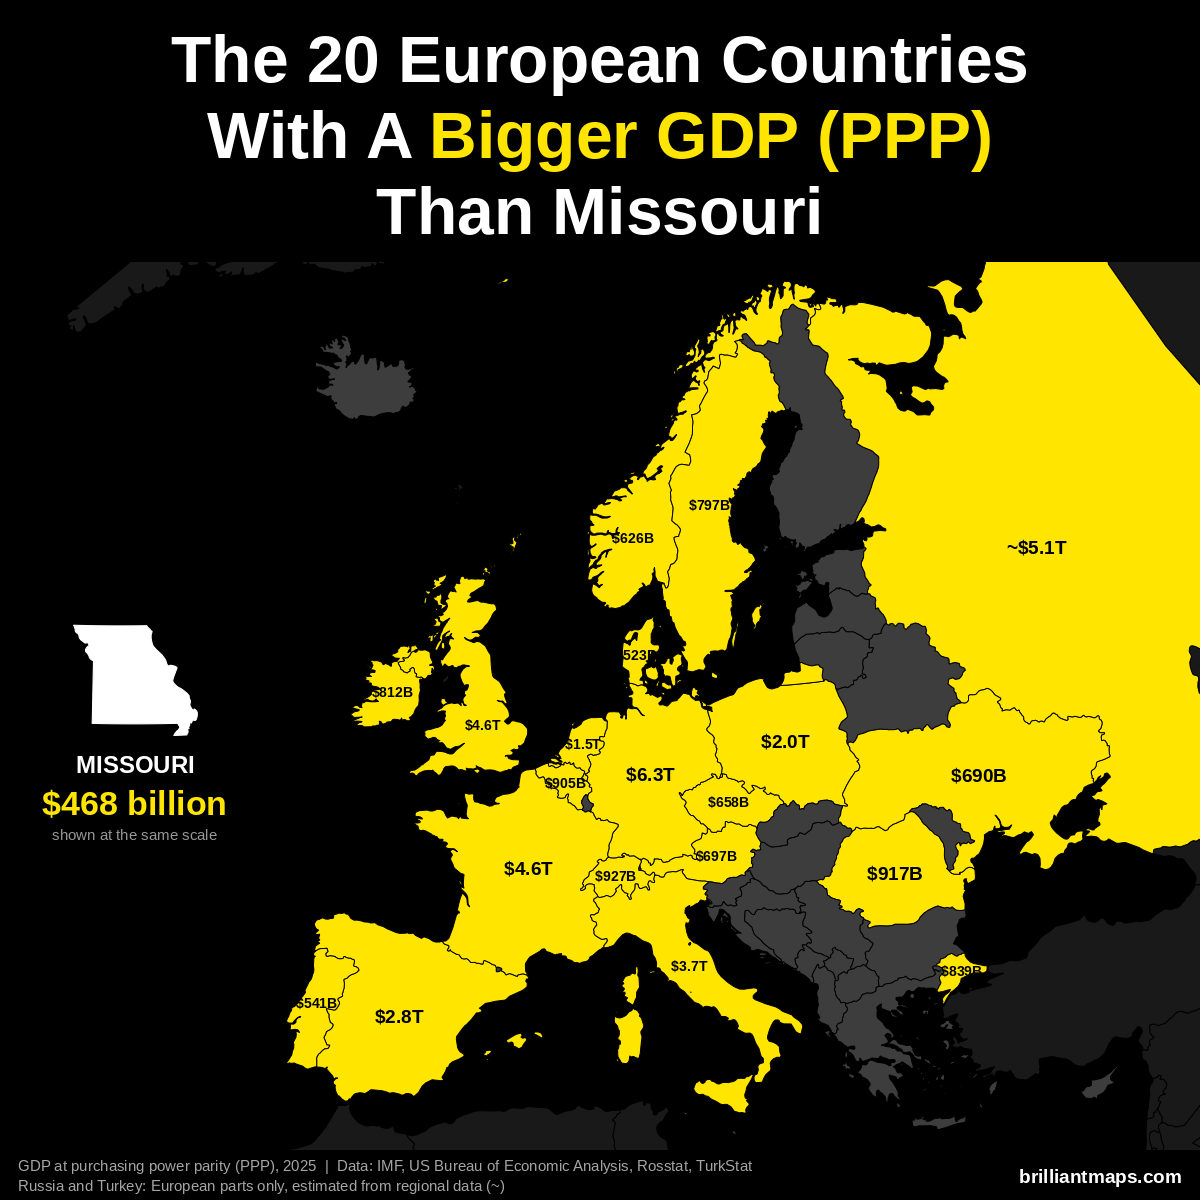
Missouri has a GDP of $468 billion (2025). US states are already measured in the dollars PPP is based on, so the figure is the same as nominal GDP. 20 European countries have a bigger GDP at purchasing power parity:
- Germany: $6.26 trillion
- Russia (European part): ~$5.14 trillion
- France: $4.58 trillion
- United Kingdom: $4.57 trillion
- Italy: $3.74 trillion
- Spain: $2.83 trillion
- Poland: $2.04 trillion
- Netherlands: $1.52 trillion
- Switzerland: $927 billion
- Romania: $917 billion
- Belgium: $905 billion
- Turkey (European part): ~$839 billion
- Ireland: $812 billion
- Sweden: $797 billion
- Austria: $697 billion
- Ukraine: $690 billion
- Czechia: $658 billion
- Norway: $626 billion
- Portugal: $541 billion
- Denmark: $523 billion
Missouri Vs European GDP Per Capita (PPP)
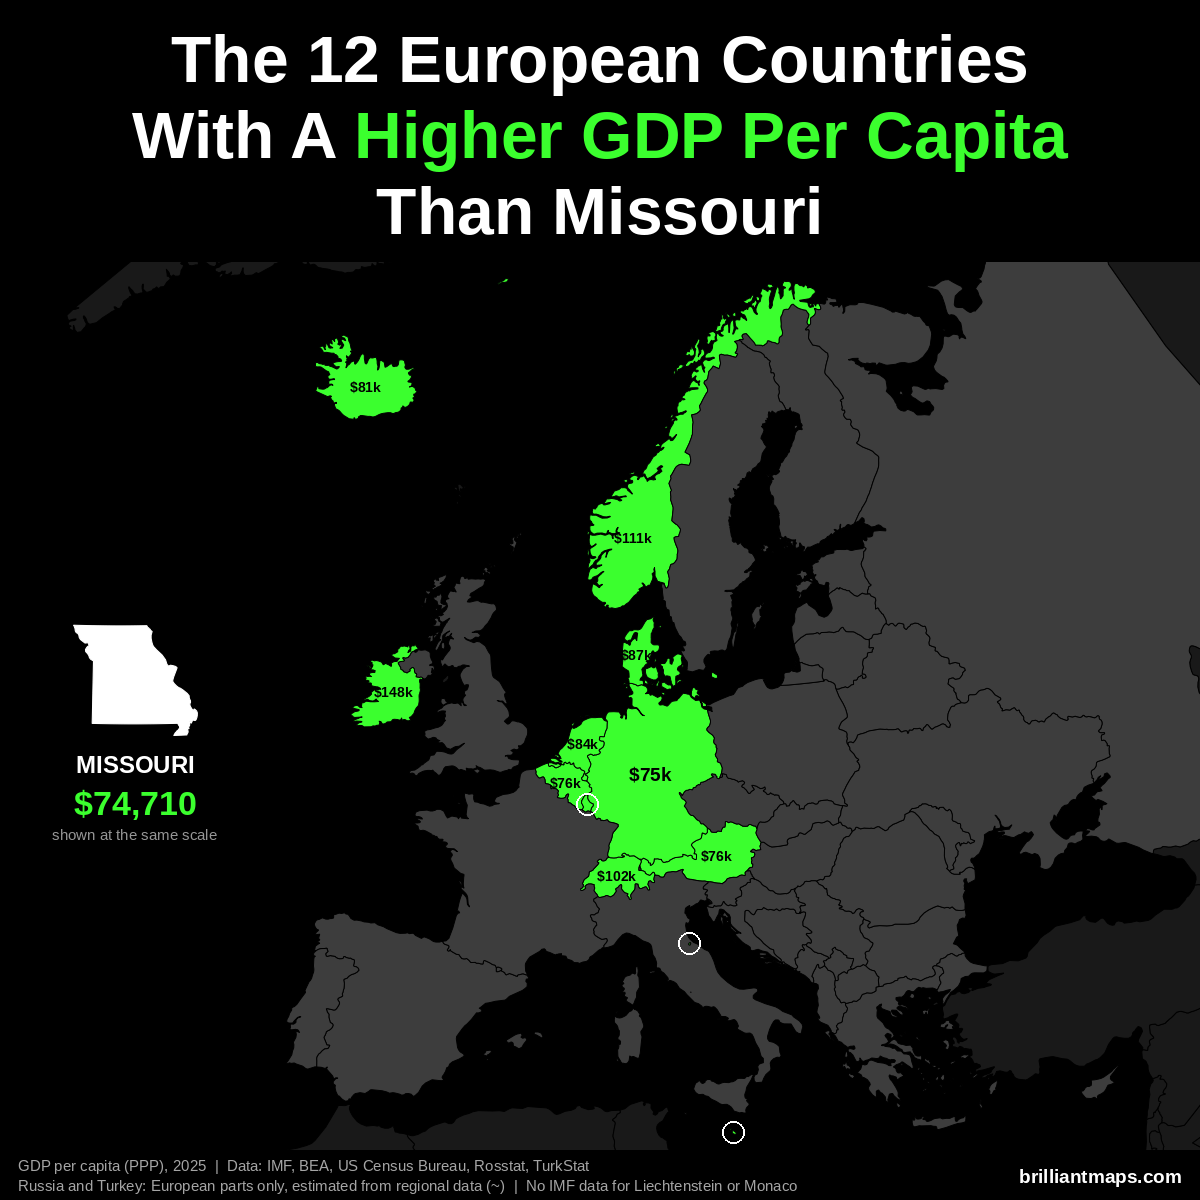
Missouri has a GDP per capita of $74,710 (2025). 12 European countries have a higher GDP per capita at purchasing power parity:
- Luxembourg: $152,894
- Ireland: $147,825
- Norway: $111,462
- Switzerland: $102,397
- Denmark: $87,303
- Netherlands: $84,445
- San Marino: $83,838
- Iceland: $80,915
- Belgium: $76,136
- Austria: $75,965
- Malta: $75,687
- Germany: $74,901
Liechtenstein and Monaco are not covered by the IMF data and are not counted here.
Missouri Vs European Size
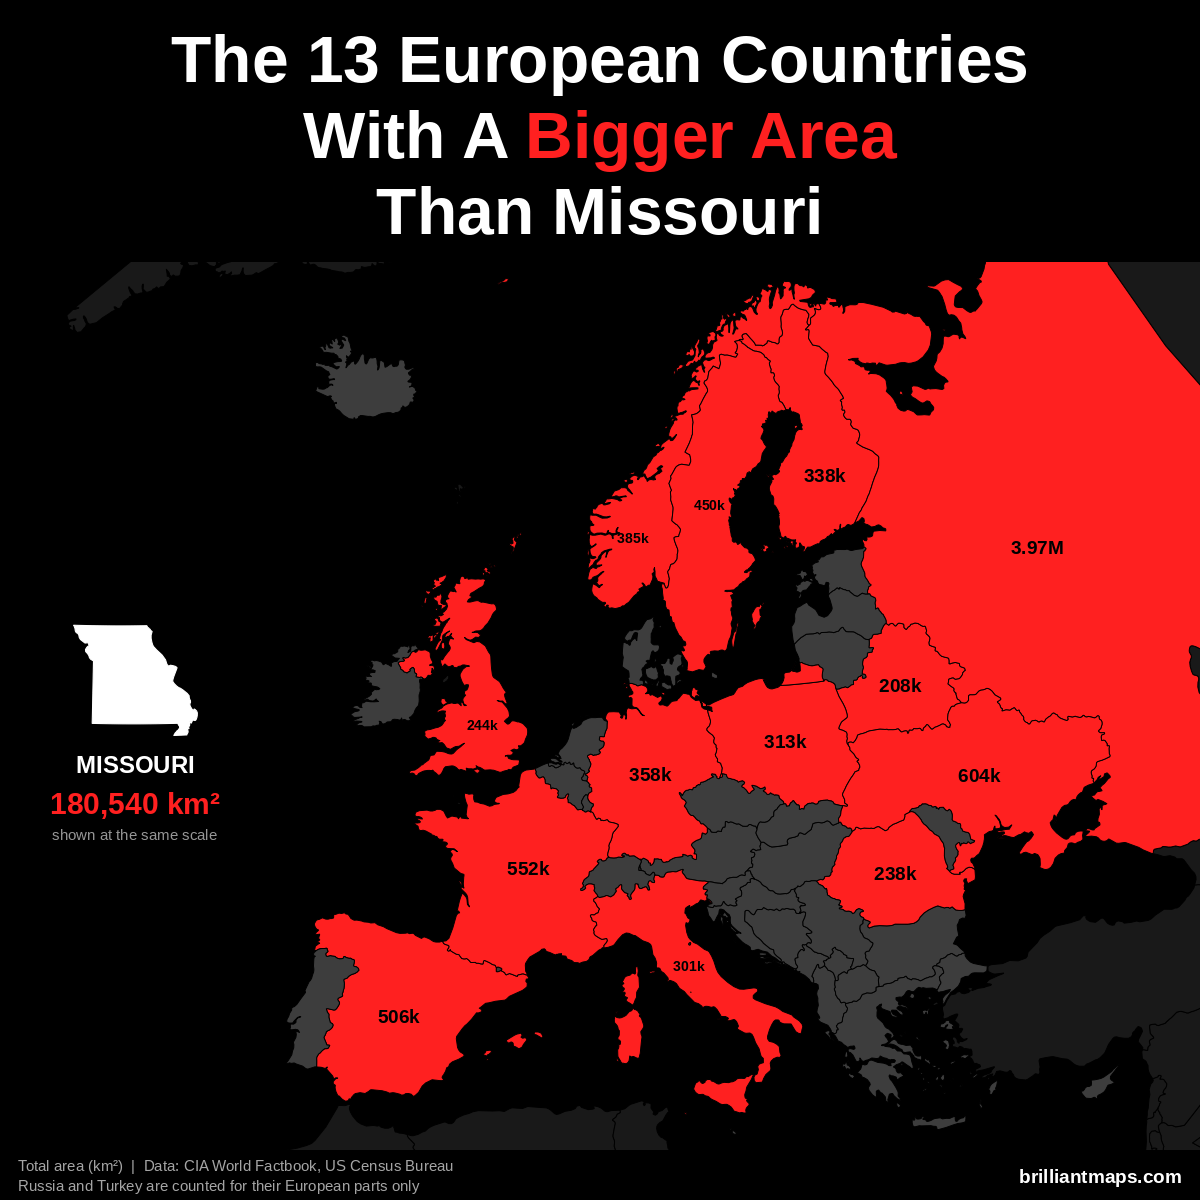
Missouri has a total area of 180,540 km² (69,707 sq mi). 13 European countries have a bigger area:
- Russia (European part): 3,969,100 km² (1,532,477 sq mi)
- Ukraine: 603,550 km² (233,032 sq mi)
- France: 551,695 km² (213,010 sq mi)
- Spain: 505,990 km² (195,364 sq mi)
- Sweden: 450,295 km² (173,860 sq mi)
- Norway: 385,207 km² (148,729 sq mi)
- Germany: 357,588 km² (138,065 sq mi)
- Finland: 338,455 km² (130,678 sq mi)
- Poland: 312,696 km² (120,733 sq mi)
- Italy: 301,340 km² (116,348 sq mi)
- United Kingdom: 243,610 km² (94,058 sq mi)
- Romania: 238,397 km² (92,046 sq mi)
- Belarus: 207,600 km² (80,155 sq mi)
Missouri Vs European Life Expectancy
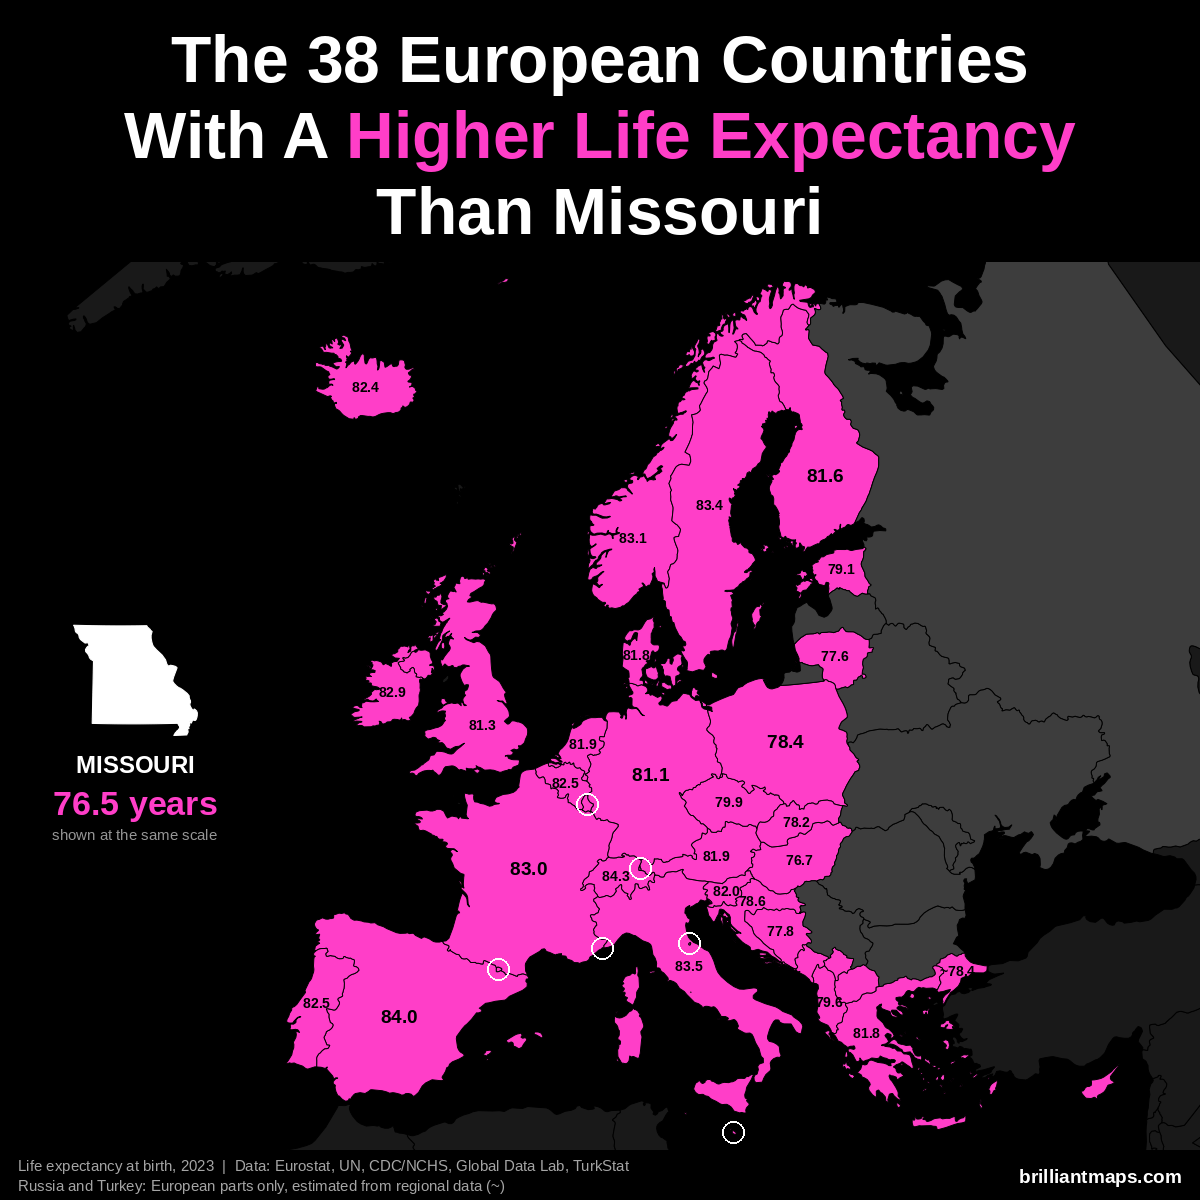
Missouri has a life expectancy at birth of 76.5 years (2023). 38 European countries have a higher life expectancy:
- Monaco: 86.4 years
- San Marino: 85.7 years
- Liechtenstein: 84.6 years
- Switzerland: 84.3 years
- Andorra: 84.0 years
- Spain: 84.0 years
- Italy: 83.5 years
- Luxembourg: 83.4 years
- Malta: 83.4 years
- Sweden: 83.4 years
- Norway: 83.1 years
- France: 83.0 years
- Cyprus: 82.9 years
- Ireland: 82.9 years
- Belgium: 82.5 years
- Portugal: 82.5 years
- Iceland: 82.4 years
- Slovenia: 82.0 years
- Austria: 81.9 years
- Netherlands: 81.9 years
- Denmark: 81.8 years
- Greece: 81.8 years
- Finland: 81.6 years
- United Kingdom: 81.3 years
- Germany: 81.1 years
- Czechia: 79.9 years
- Albania: 79.6 years
- Estonia: 79.1 years
- Croatia: 78.6 years
- Poland: 78.4 years
- Turkey (European part): ~78.4 years
- Slovakia: 78.2 years
- Kosovo: 78.0 years
- Bosnia and Herzegovina: 77.8 years
- Lithuania: 77.6 years
- Montenegro: 77.6 years
- North Macedonia: 77.4 years
- Hungary: 76.7 years
Montana vs Europe
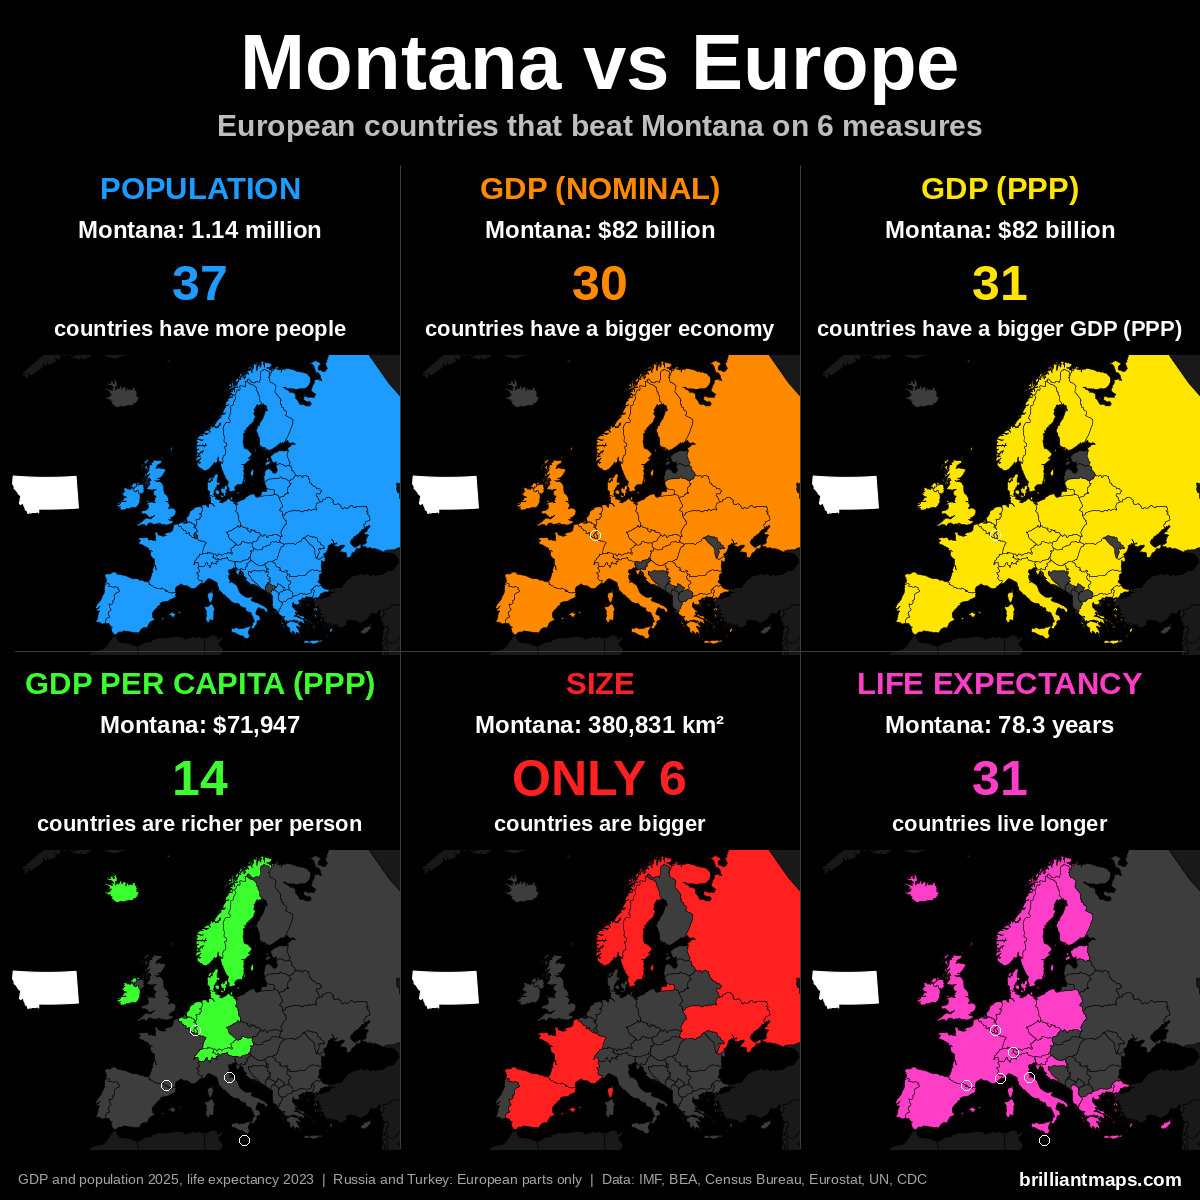
Montana Vs European Population
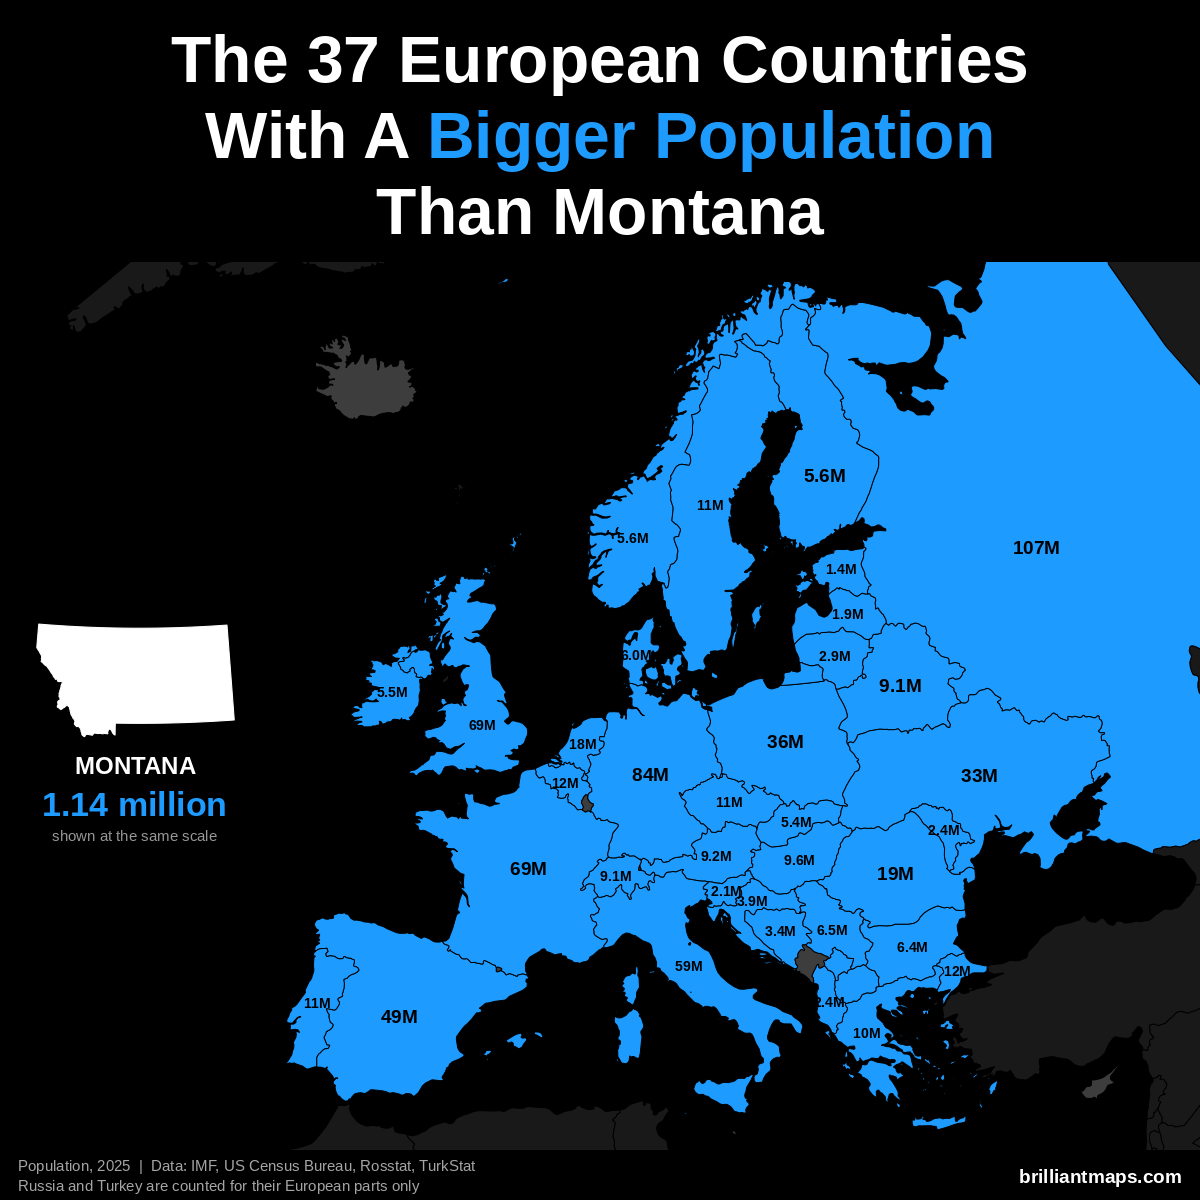
Montana has a population of 1.1 million (2025). 37 European countries have a bigger population:
- Russia (European part): 107.0 million
- Germany: 83.5 million
- United Kingdom: 69.5 million
- France: 68.9 million
- Italy: 58.9 million
- Spain: 49.5 million
- Poland: 36.5 million
- Ukraine: 32.9 million
- Romania: 19.0 million
- Netherlands: 18.0 million
- Turkey (European part): 12.2 million
- Belgium: 11.9 million
- Portugal: 10.8 million
- Czechia: 10.8 million
- Sweden: 10.7 million
- Greece: 10.4 million
- Hungary: 9.6 million
- Austria: 9.2 million
- Belarus: 9.1 million
- Switzerland: 9.1 million
- Serbia: 6.5 million
- Bulgaria: 6.4 million
- Denmark: 6.0 million
- Norway: 5.6 million
- Finland: 5.6 million
- Ireland: 5.5 million
- Slovakia: 5.4 million
- Croatia: 3.9 million
- Bosnia and Herzegovina: 3.4 million
- Lithuania: 2.9 million
- Moldova: 2.4 million
- Albania: 2.4 million
- Slovenia: 2.1 million
- Latvia: 1.9 million
- North Macedonia: 1.8 million
- Kosovo: 1.6 million
- Estonia: 1.4 million
Montana Vs European GDP (Nominal)
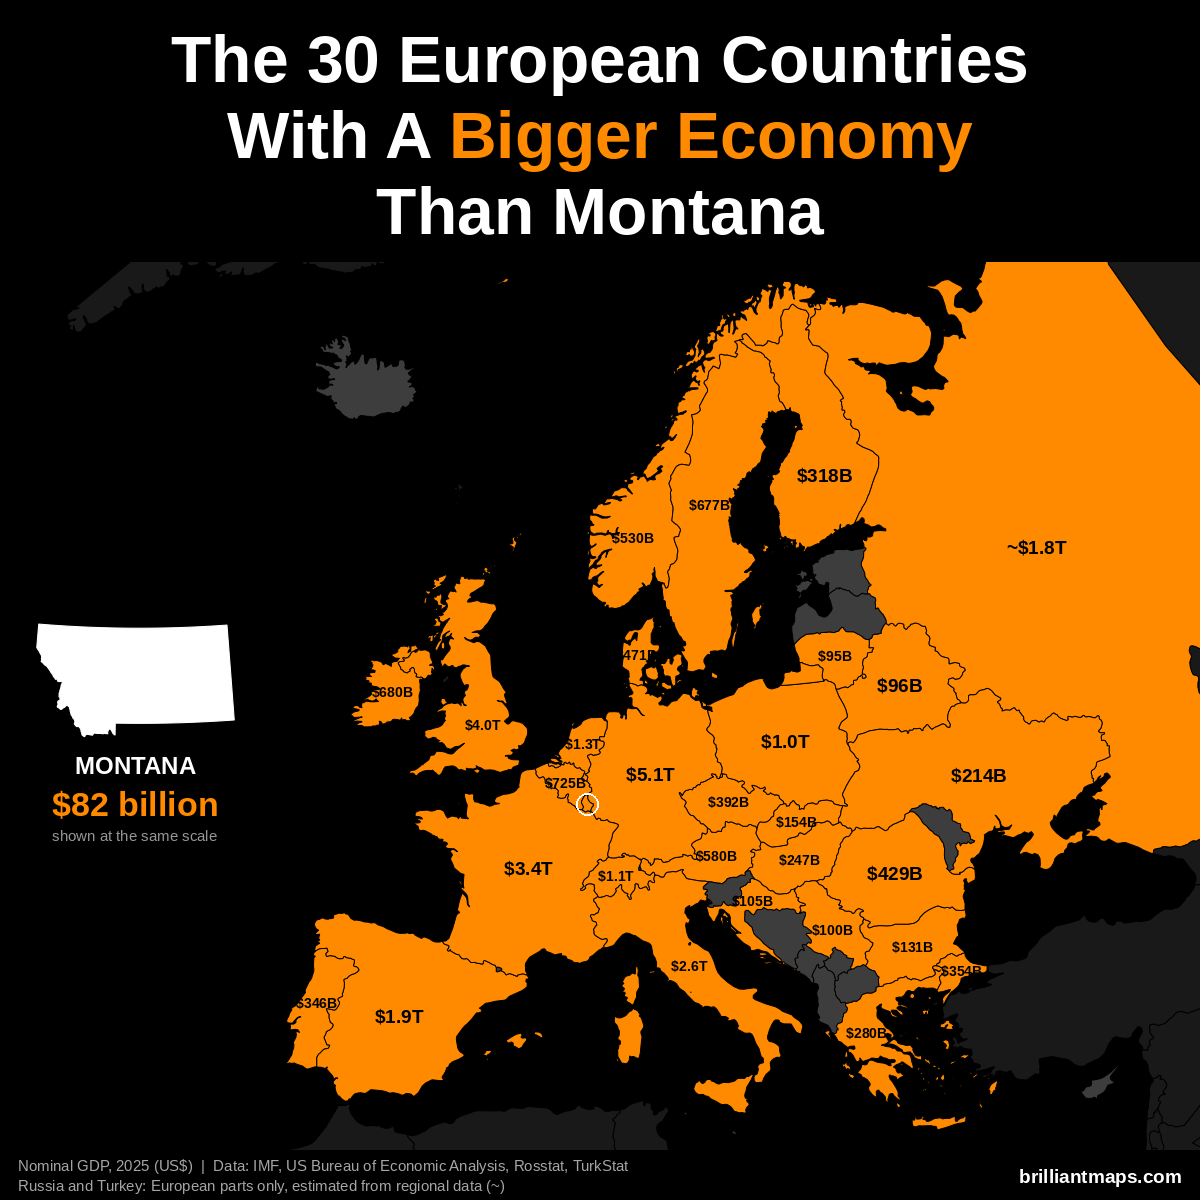
Montana has a nominal GDP of $82 billion (2025). 30 European countries have a bigger economy:
- Germany: $5.12 trillion
- United Kingdom: $4.01 trillion
- France: $3.38 trillion
- Italy: $2.55 trillion
- Spain: $1.91 trillion
- Russia (European part): ~$1.83 trillion
- Netherlands: $1.32 trillion
- Switzerland: $1.06 trillion
- Poland: $1.04 trillion
- Belgium: $725 billion
- Ireland: $680 billion
- Sweden: $677 billion
- Austria: $580 billion
- Norway: $530 billion
- Denmark: $471 billion
- Romania: $429 billion
- Czechia: $392 billion
- Turkey (European part): ~$354 billion
- Portugal: $346 billion
- Finland: $318 billion
- Greece: $280 billion
- Hungary: $247 billion
- Ukraine: $214 billion
- Slovakia: $154 billion
- Bulgaria: $131 billion
- Croatia: $105 billion
- Luxembourg: $101 billion
- Serbia: $100 billion
- Belarus: $96 billion
- Lithuania: $95 billion
Montana Vs European GDP (PPP)
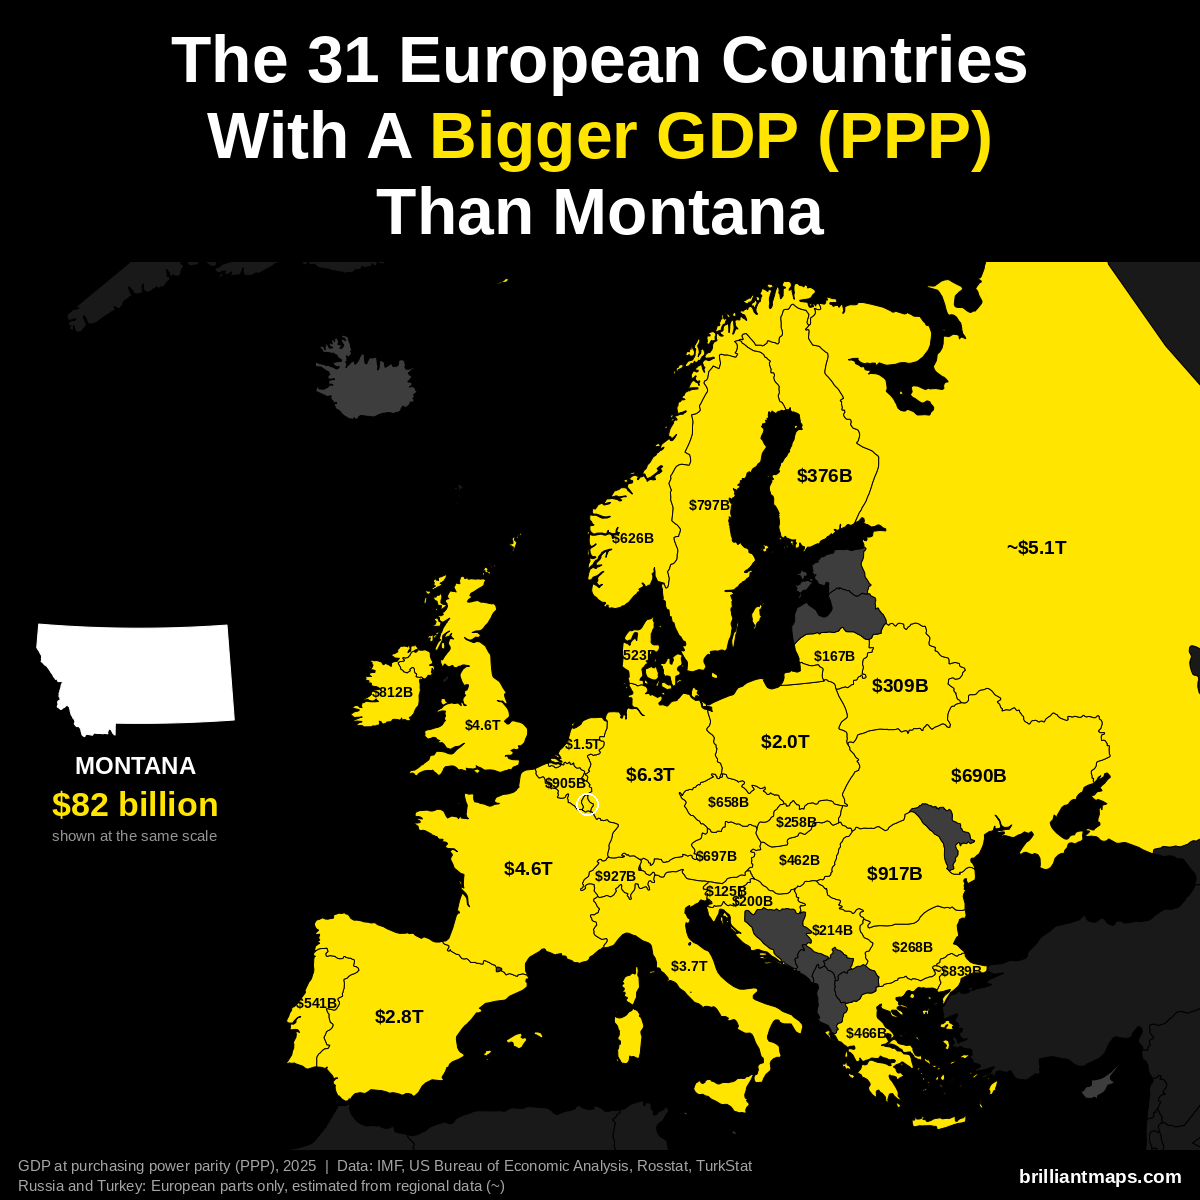
Montana has a GDP of $82 billion (2025). US states are already measured in the dollars PPP is based on, so the figure is the same as nominal GDP. 31 European countries have a bigger GDP at purchasing power parity:
- Germany: $6.26 trillion
- Russia (European part): ~$5.14 trillion
- France: $4.58 trillion
- United Kingdom: $4.57 trillion
- Italy: $3.74 trillion
- Spain: $2.83 trillion
- Poland: $2.04 trillion
- Netherlands: $1.52 trillion
- Switzerland: $927 billion
- Romania: $917 billion
- Belgium: $905 billion
- Turkey (European part): ~$839 billion
- Ireland: $812 billion
- Sweden: $797 billion
- Austria: $697 billion
- Ukraine: $690 billion
- Czechia: $658 billion
- Norway: $626 billion
- Portugal: $541 billion
- Denmark: $523 billion
- Greece: $466 billion
- Hungary: $462 billion
- Finland: $376 billion
- Belarus: $309 billion
- Bulgaria: $268 billion
- Slovakia: $258 billion
- Serbia: $214 billion
- Croatia: $200 billion
- Lithuania: $167 billion
- Slovenia: $125 billion
- Luxembourg: $104 billion
Montana Vs European GDP Per Capita (PPP)
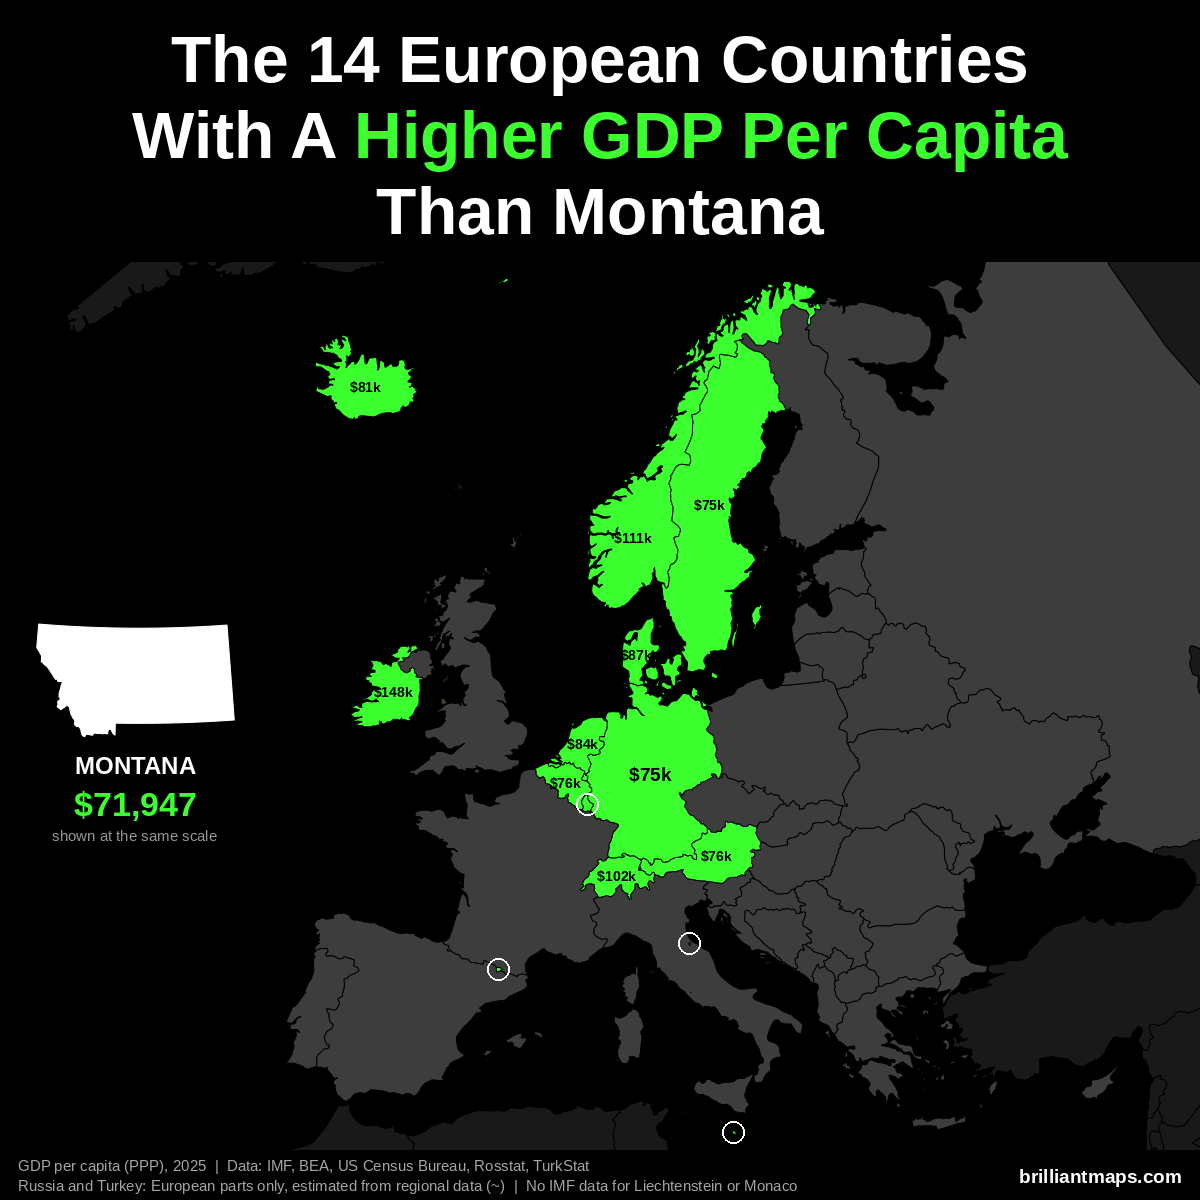
Montana has a GDP per capita of $71,947 (2025). 14 European countries have a higher GDP per capita at purchasing power parity:
- Luxembourg: $152,894
- Ireland: $147,825
- Norway: $111,462
- Switzerland: $102,397
- Denmark: $87,303
- Netherlands: $84,445
- San Marino: $83,838
- Iceland: $80,915
- Belgium: $76,136
- Austria: $75,965
- Malta: $75,687
- Germany: $74,901
- Sweden: $74,651
- Andorra: $74,059
Liechtenstein and Monaco are not covered by the IMF data and are not counted here.
Montana Vs European Size
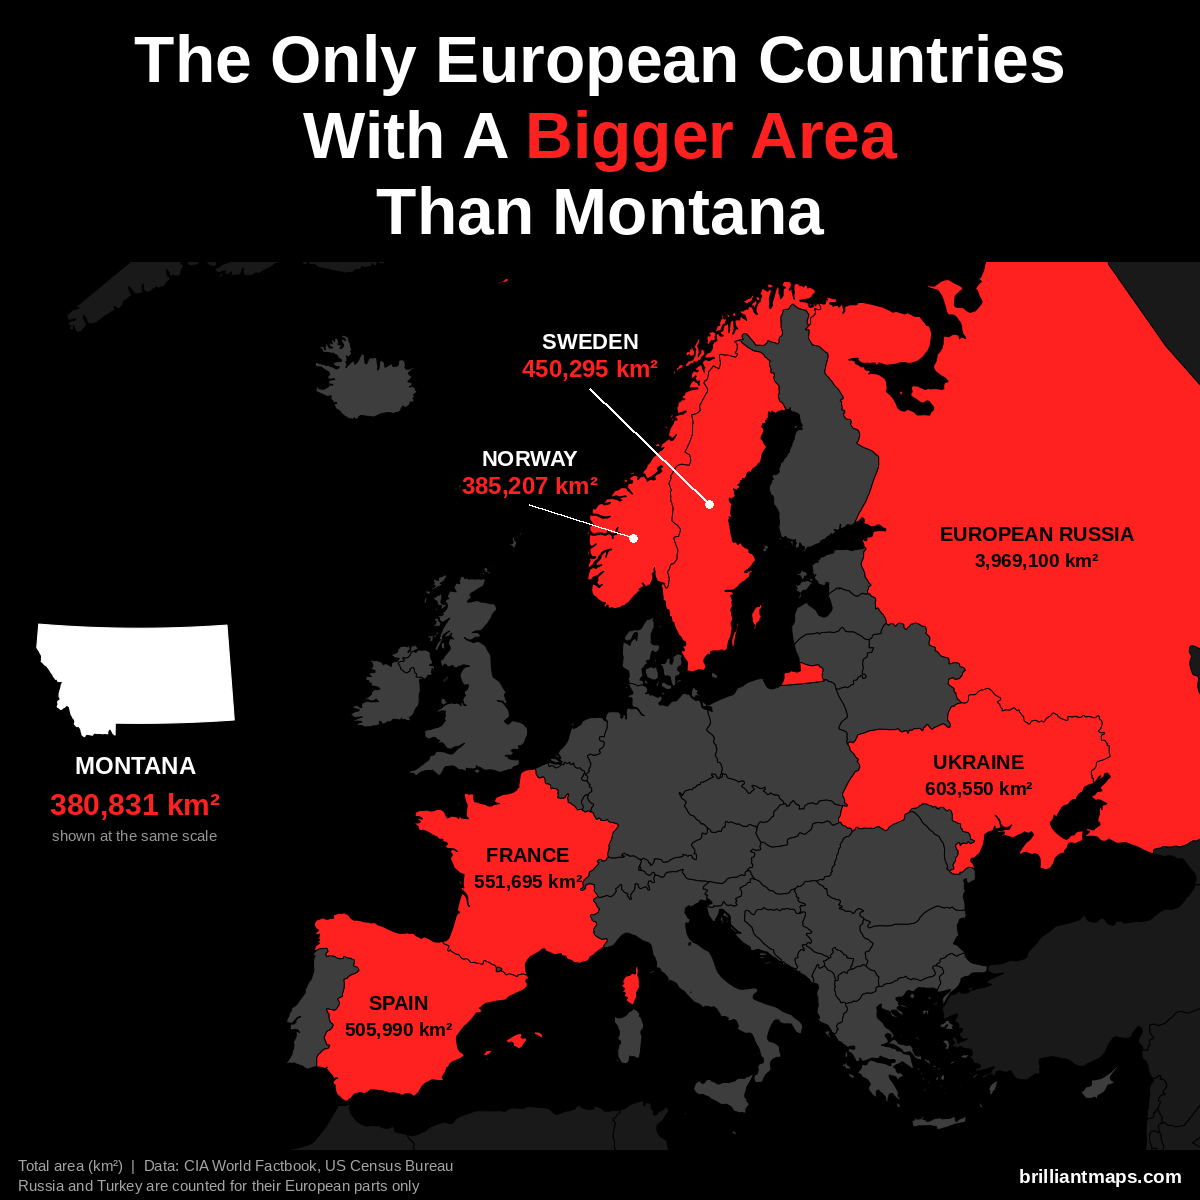
Montana has a total area of 380,831 km² (147,040 sq mi). Only 6 European countries have a bigger area:
- Russia (European part): 3,969,100 km² (1,532,477 sq mi)
- Ukraine: 603,550 km² (233,032 sq mi)
- France: 551,695 km² (213,010 sq mi)
- Spain: 505,990 km² (195,364 sq mi)
- Sweden: 450,295 km² (173,860 sq mi)
- Norway: 385,207 km² (148,729 sq mi)
Montana Vs European Life Expectancy
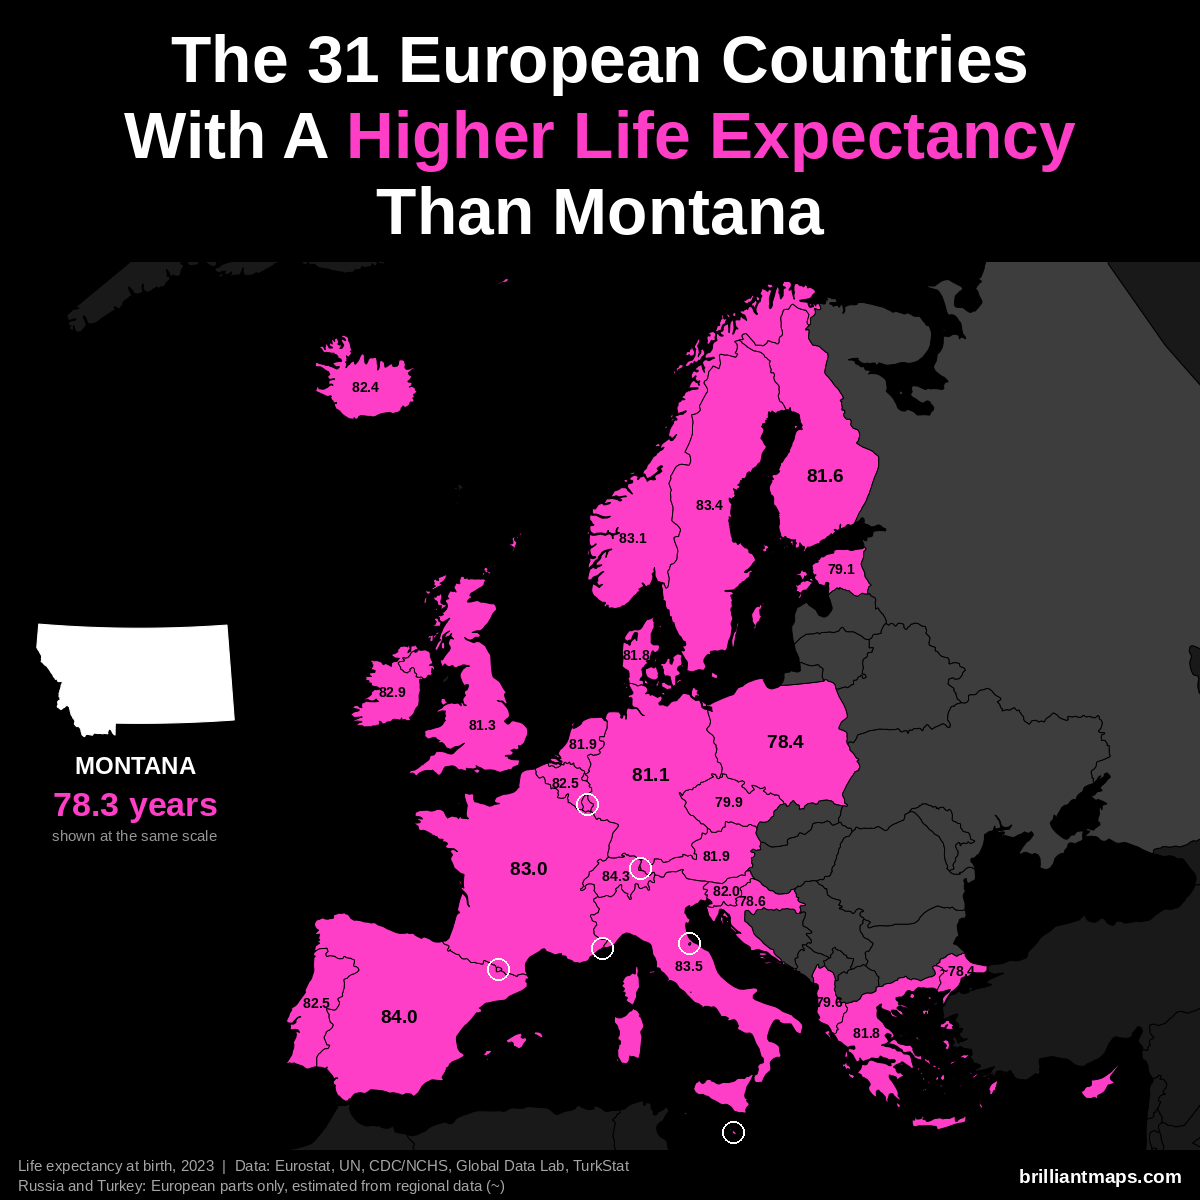
Montana has a life expectancy at birth of 78.3 years (2023). 31 European countries have a higher life expectancy:
- Monaco: 86.4 years
- San Marino: 85.7 years
- Liechtenstein: 84.6 years
- Switzerland: 84.3 years
- Andorra: 84.0 years
- Spain: 84.0 years
- Italy: 83.5 years
- Luxembourg: 83.4 years
- Malta: 83.4 years
- Sweden: 83.4 years
- Norway: 83.1 years
- France: 83.0 years
- Cyprus: 82.9 years
- Ireland: 82.9 years
- Belgium: 82.5 years
- Portugal: 82.5 years
- Iceland: 82.4 years
- Slovenia: 82.0 years
- Austria: 81.9 years
- Netherlands: 81.9 years
- Denmark: 81.8 years
- Greece: 81.8 years
- Finland: 81.6 years
- United Kingdom: 81.3 years
- Germany: 81.1 years
- Czechia: 79.9 years
- Albania: 79.6 years
- Estonia: 79.1 years
- Croatia: 78.6 years
- Poland: 78.4 years
- Turkey (European part): ~78.4 years
Nebraska vs Europe
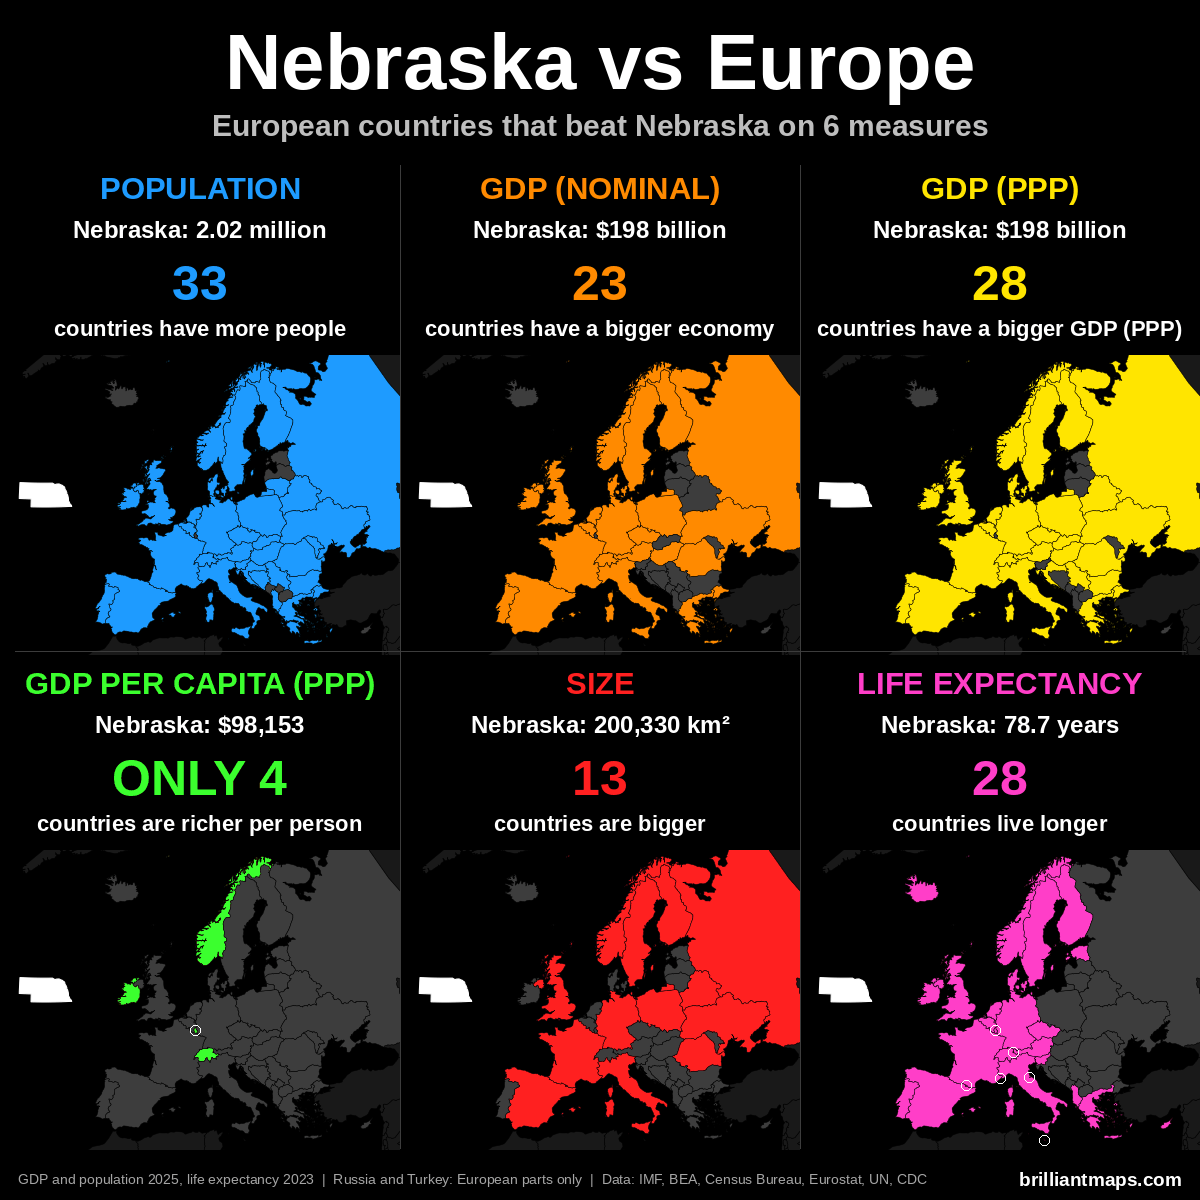
Nebraska Vs European Population
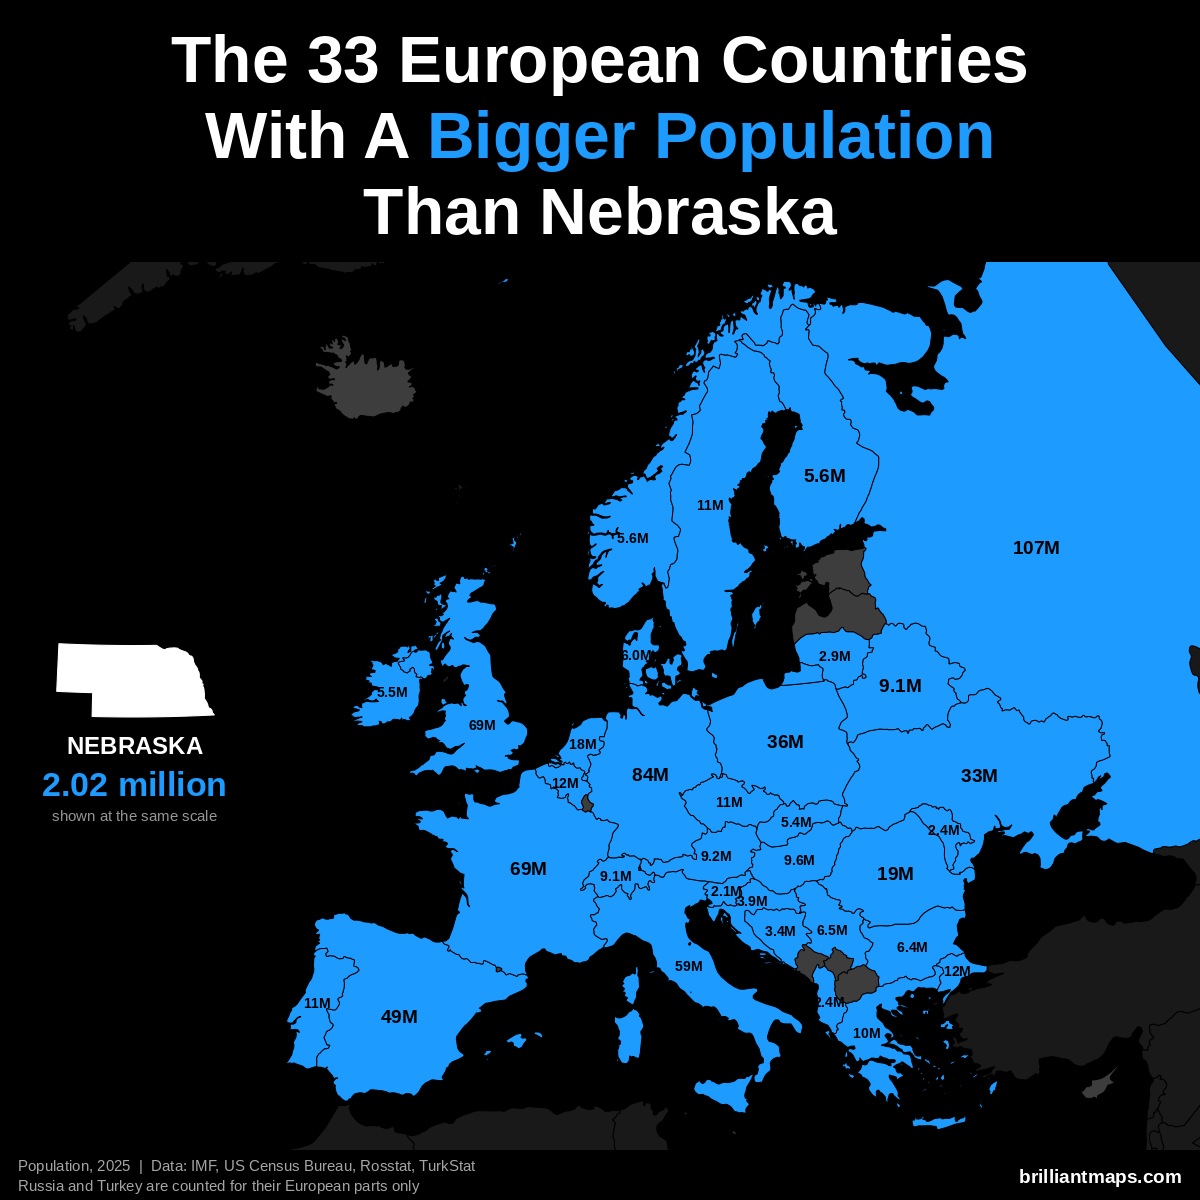
Nebraska has a population of 2.0 million (2025). 33 European countries have a bigger population:
- Russia (European part): 107.0 million
- Germany: 83.5 million
- United Kingdom: 69.5 million
- France: 68.9 million
- Italy: 58.9 million
- Spain: 49.5 million
- Poland: 36.5 million
- Ukraine: 32.9 million
- Romania: 19.0 million
- Netherlands: 18.0 million
- Turkey (European part): 12.2 million
- Belgium: 11.9 million
- Portugal: 10.8 million
- Czechia: 10.8 million
- Sweden: 10.7 million
- Greece: 10.4 million
- Hungary: 9.6 million
- Austria: 9.2 million
- Belarus: 9.1 million
- Switzerland: 9.1 million
- Serbia: 6.5 million
- Bulgaria: 6.4 million
- Denmark: 6.0 million
- Norway: 5.6 million
- Finland: 5.6 million
- Ireland: 5.5 million
- Slovakia: 5.4 million
- Croatia: 3.9 million
- Bosnia and Herzegovina: 3.4 million
- Lithuania: 2.9 million
- Moldova: 2.4 million
- Albania: 2.4 million
- Slovenia: 2.1 million
Nebraska Vs European GDP (Nominal)
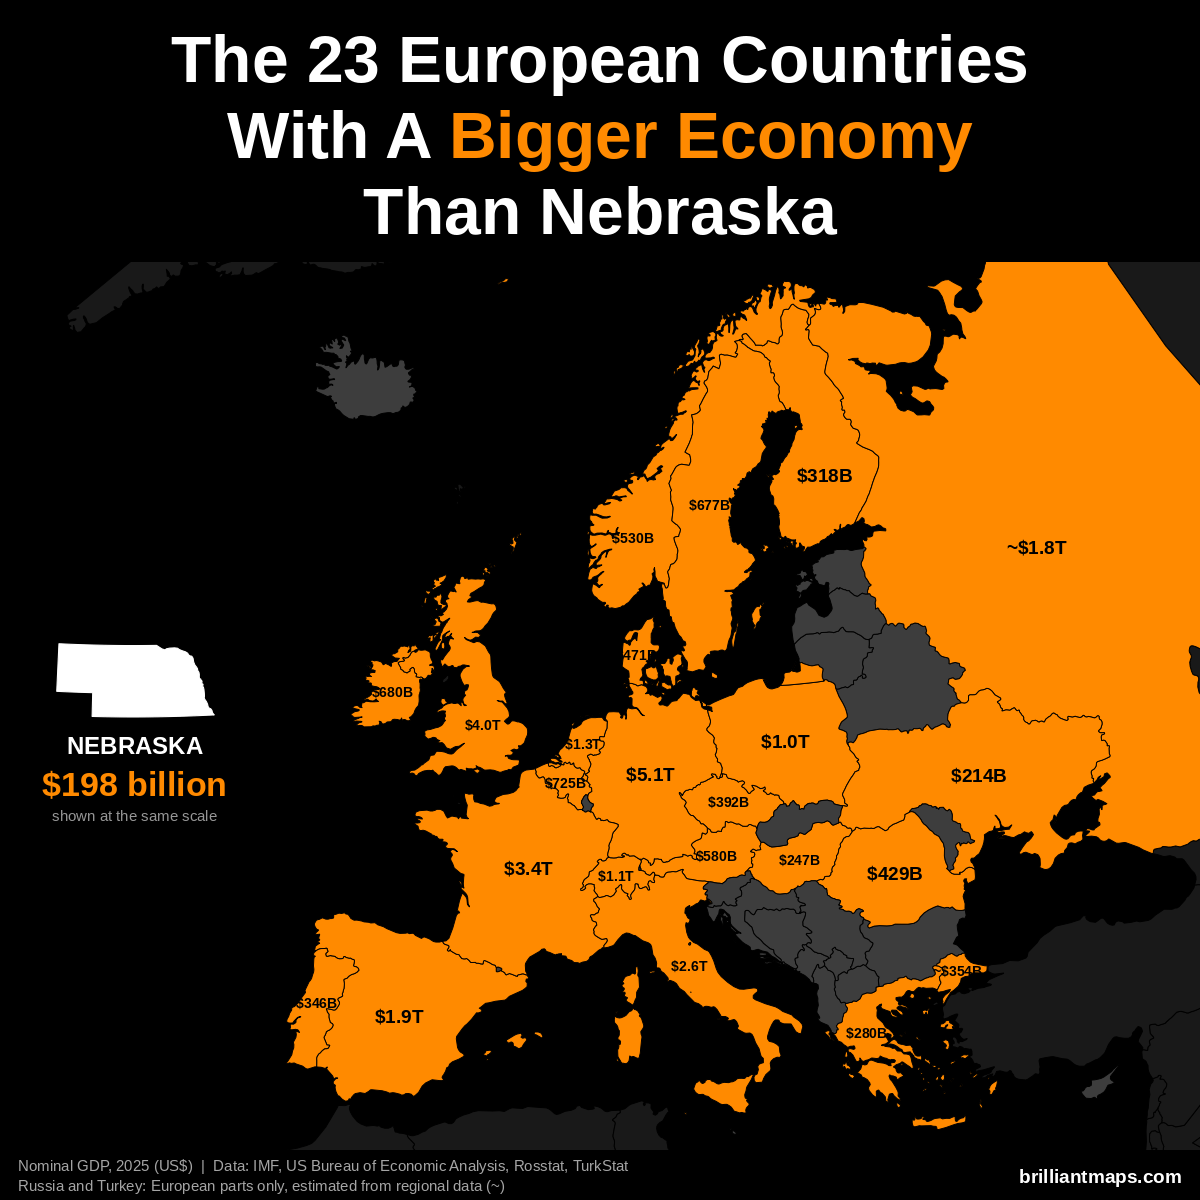
Nebraska has a nominal GDP of $198 billion (2025). 23 European countries have a bigger economy:
- Germany: $5.12 trillion
- United Kingdom: $4.01 trillion
- France: $3.38 trillion
- Italy: $2.55 trillion
- Spain: $1.91 trillion
- Russia (European part): ~$1.83 trillion
- Netherlands: $1.32 trillion
- Switzerland: $1.06 trillion
- Poland: $1.04 trillion
- Belgium: $725 billion
- Ireland: $680 billion
- Sweden: $677 billion
- Austria: $580 billion
- Norway: $530 billion
- Denmark: $471 billion
- Romania: $429 billion
- Czechia: $392 billion
- Turkey (European part): ~$354 billion
- Portugal: $346 billion
- Finland: $318 billion
- Greece: $280 billion
- Hungary: $247 billion
- Ukraine: $214 billion
Nebraska Vs European GDP (PPP)
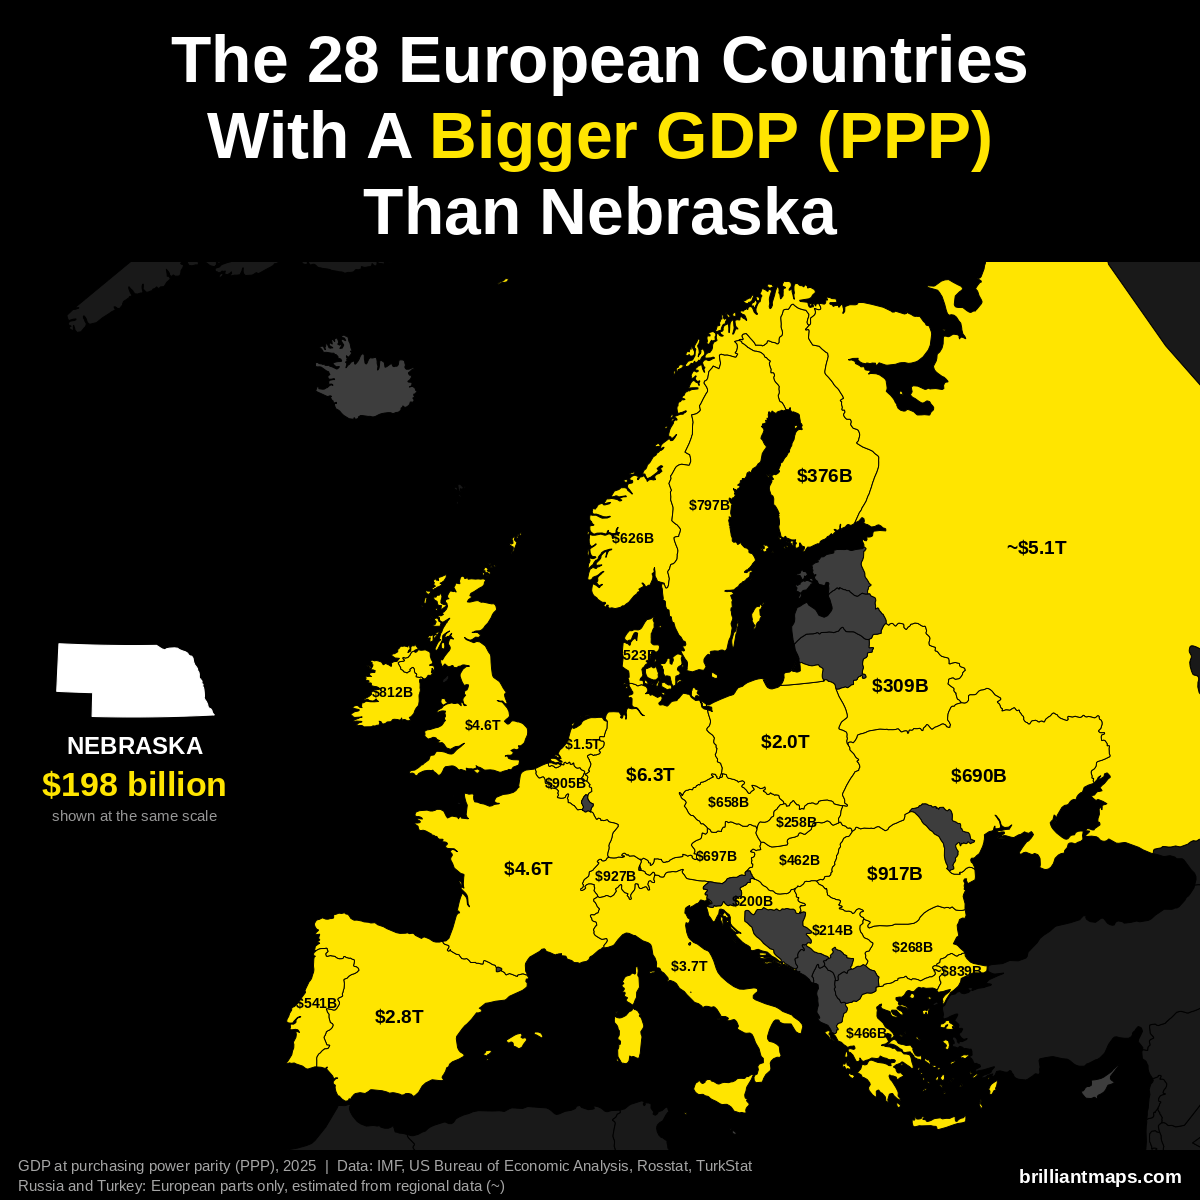
Nebraska has a GDP of $198 billion (2025). US states are already measured in the dollars PPP is based on, so the figure is the same as nominal GDP. 28 European countries have a bigger GDP at purchasing power parity:
- Germany: $6.26 trillion
- Russia (European part): ~$5.14 trillion
- France: $4.58 trillion
- United Kingdom: $4.57 trillion
- Italy: $3.74 trillion
- Spain: $2.83 trillion
- Poland: $2.04 trillion
- Netherlands: $1.52 trillion
- Switzerland: $927 billion
- Romania: $917 billion
- Belgium: $905 billion
- Turkey (European part): ~$839 billion
- Ireland: $812 billion
- Sweden: $797 billion
- Austria: $697 billion
- Ukraine: $690 billion
- Czechia: $658 billion
- Norway: $626 billion
- Portugal: $541 billion
- Denmark: $523 billion
- Greece: $466 billion
- Hungary: $462 billion
- Finland: $376 billion
- Belarus: $309 billion
- Bulgaria: $268 billion
- Slovakia: $258 billion
- Serbia: $214 billion
- Croatia: $200 billion
Nebraska Vs European GDP Per Capita (PPP)
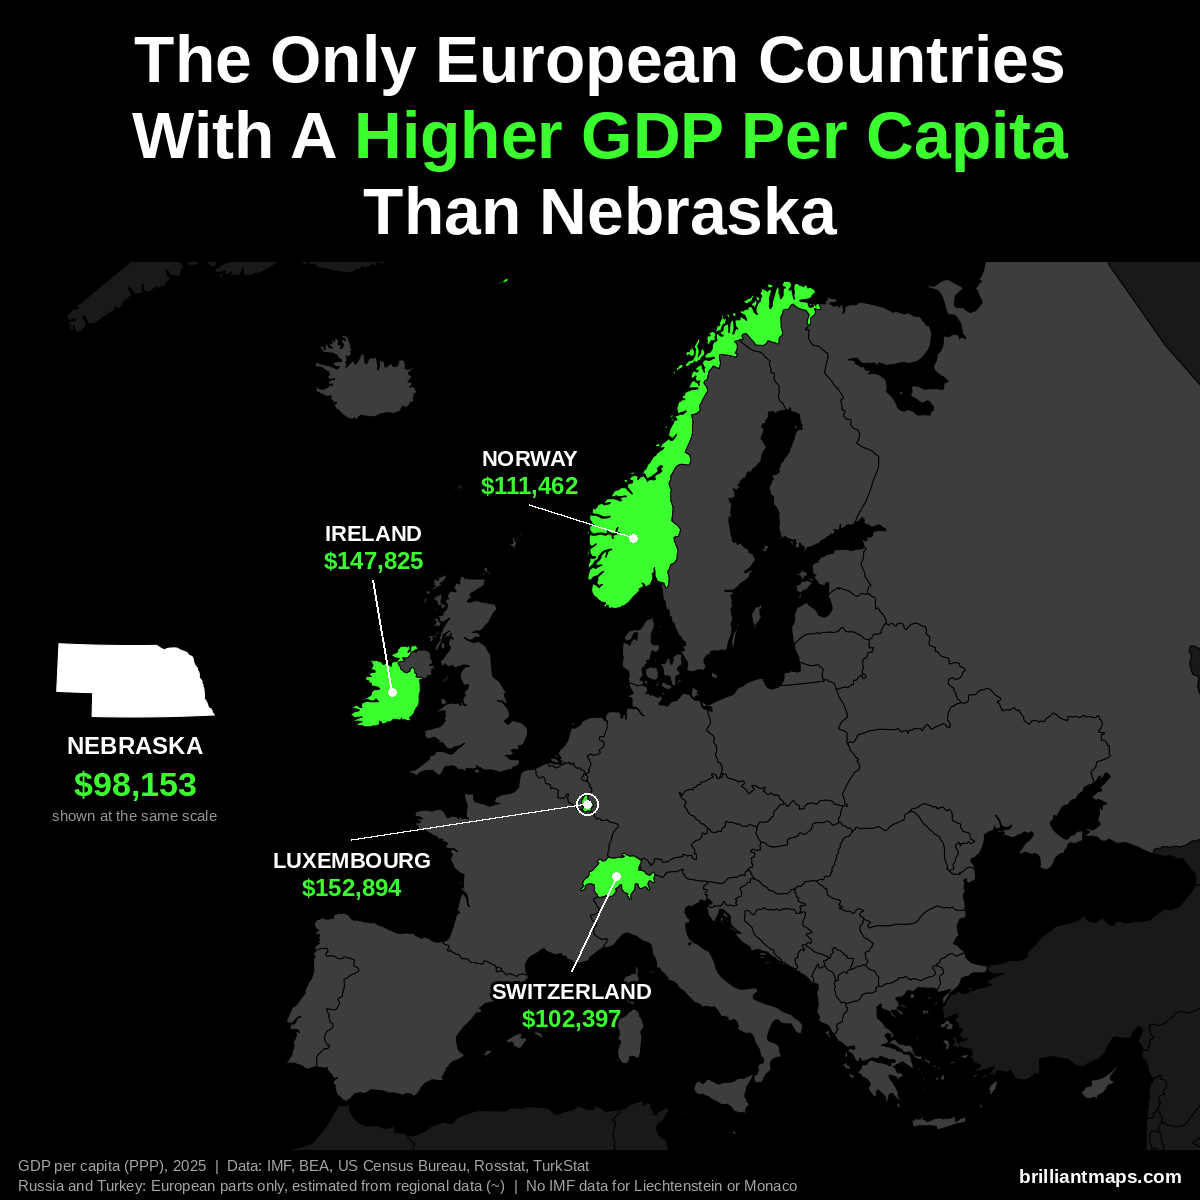
Nebraska has a GDP per capita of $98,153 (2025). Only 4 European countries have a higher GDP per capita at purchasing power parity:
- Luxembourg: $152,894
- Ireland: $147,825
- Norway: $111,462
- Switzerland: $102,397
Liechtenstein and Monaco are not covered by the IMF data and are not counted here.
Nebraska Vs European Size
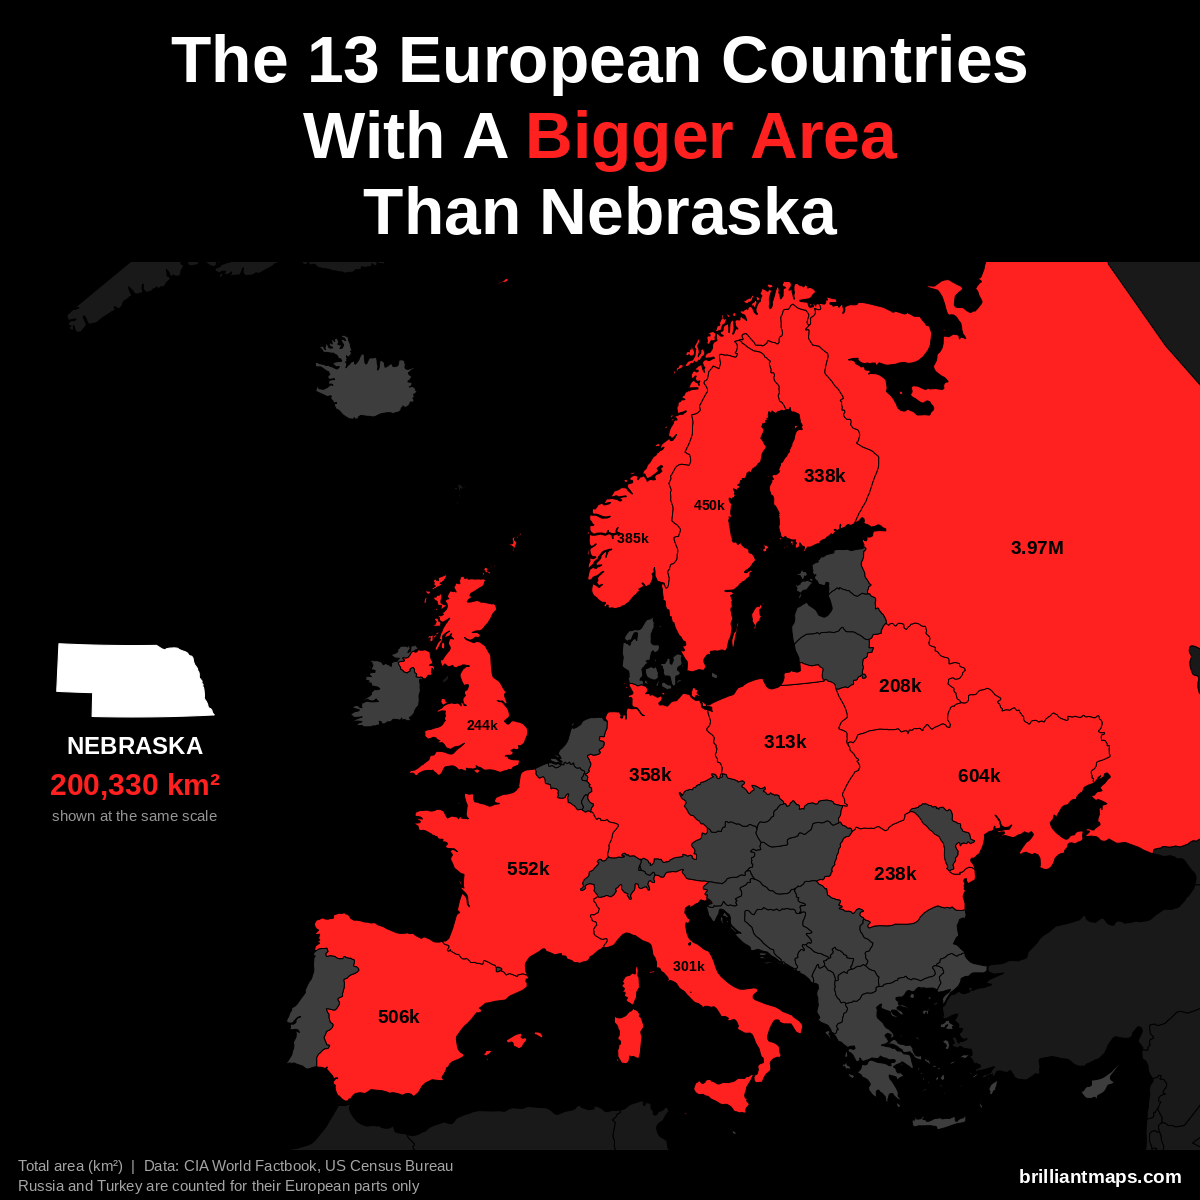
Nebraska has a total area of 200,330 km² (77,348 sq mi). 13 European countries have a bigger area:
- Russia (European part): 3,969,100 km² (1,532,477 sq mi)
- Ukraine: 603,550 km² (233,032 sq mi)
- France: 551,695 km² (213,010 sq mi)
- Spain: 505,990 km² (195,364 sq mi)
- Sweden: 450,295 km² (173,860 sq mi)
- Norway: 385,207 km² (148,729 sq mi)
- Germany: 357,588 km² (138,065 sq mi)
- Finland: 338,455 km² (130,678 sq mi)
- Poland: 312,696 km² (120,733 sq mi)
- Italy: 301,340 km² (116,348 sq mi)
- United Kingdom: 243,610 km² (94,058 sq mi)
- Romania: 238,397 km² (92,046 sq mi)
- Belarus: 207,600 km² (80,155 sq mi)
Nebraska Vs European Life Expectancy
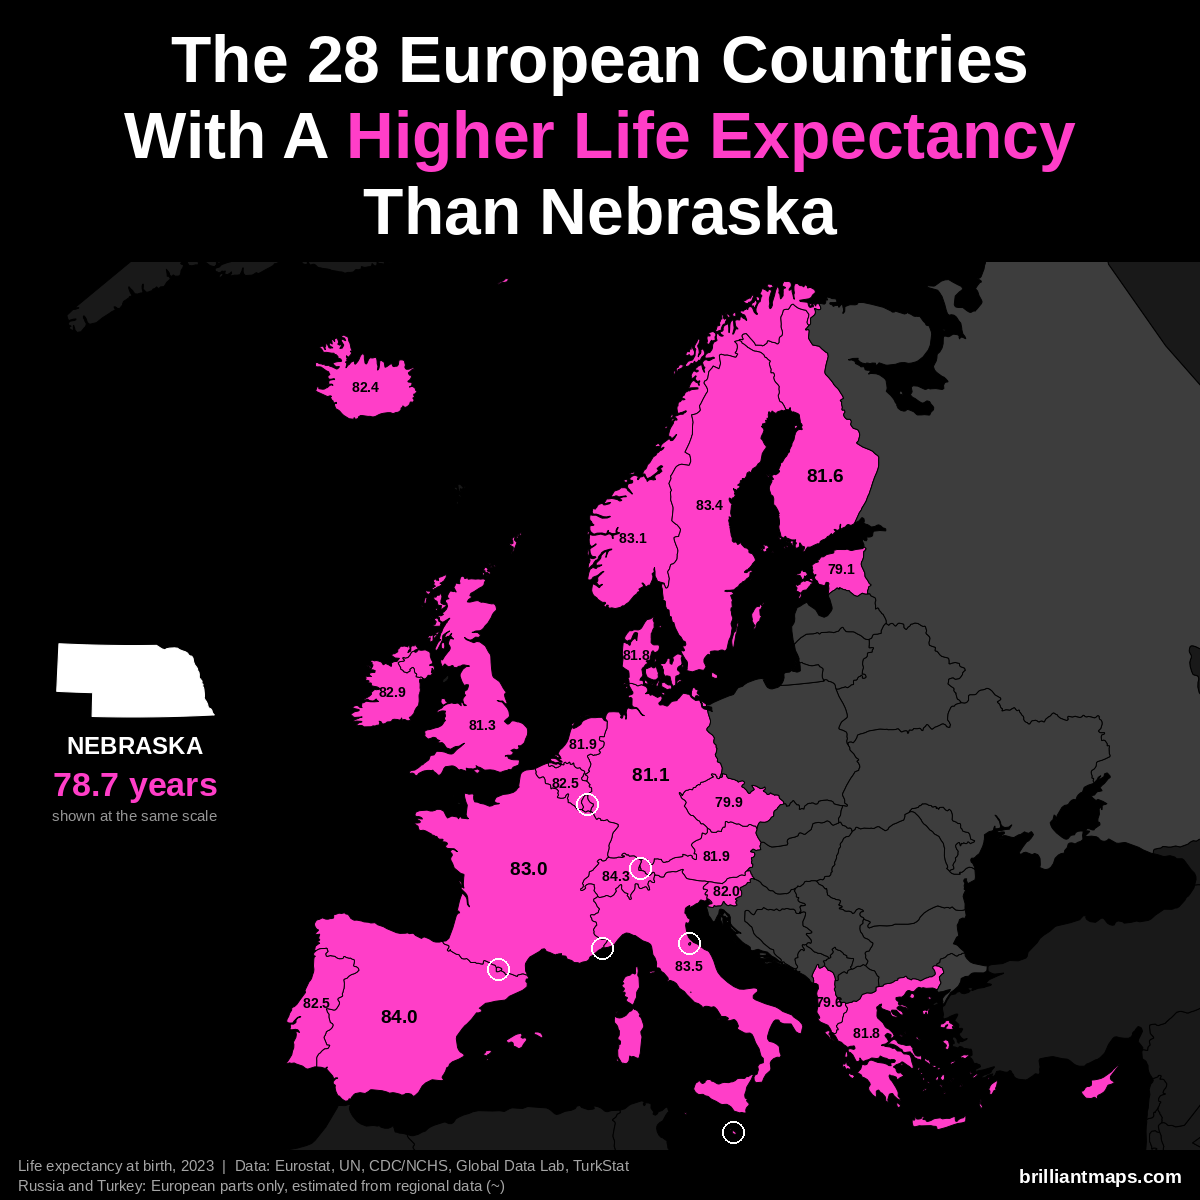
Nebraska has a life expectancy at birth of 78.7 years (2023). 28 European countries have a higher life expectancy:
- Monaco: 86.4 years
- San Marino: 85.7 years
- Liechtenstein: 84.6 years
- Switzerland: 84.3 years
- Andorra: 84.0 years
- Spain: 84.0 years
- Italy: 83.5 years
- Luxembourg: 83.4 years
- Malta: 83.4 years
- Sweden: 83.4 years
- Norway: 83.1 years
- France: 83.0 years
- Cyprus: 82.9 years
- Ireland: 82.9 years
- Belgium: 82.5 years
- Portugal: 82.5 years
- Iceland: 82.4 years
- Slovenia: 82.0 years
- Austria: 81.9 years
- Netherlands: 81.9 years
- Denmark: 81.8 years
- Greece: 81.8 years
- Finland: 81.6 years
- United Kingdom: 81.3 years
- Germany: 81.1 years
- Czechia: 79.9 years
- Albania: 79.6 years
- Estonia: 79.1 years
Nevada vs Europe
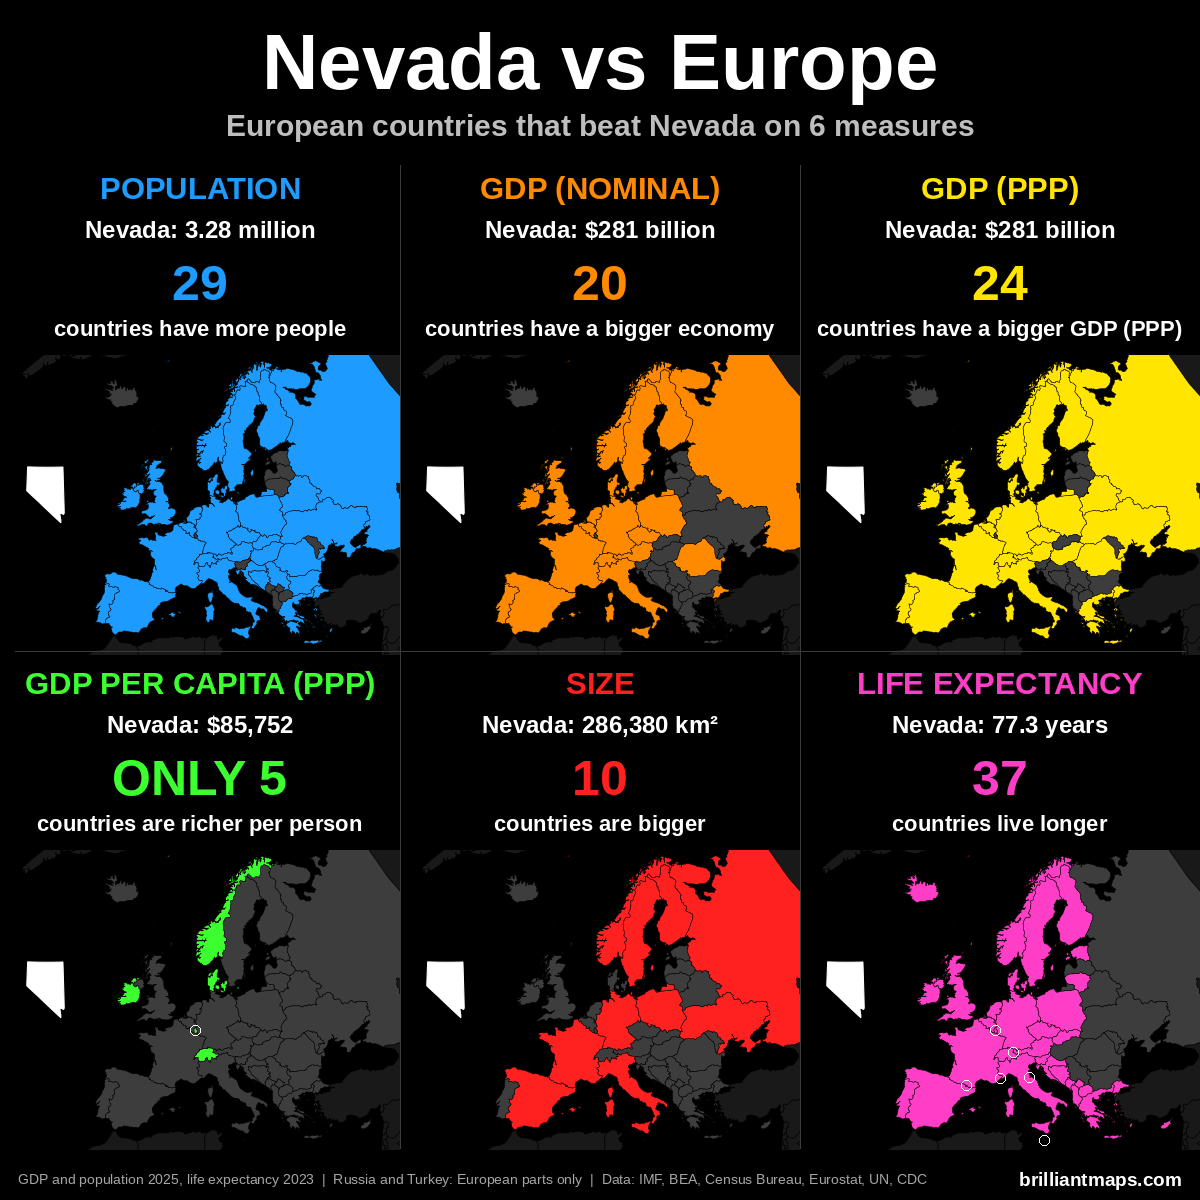
Nevada Vs European Population
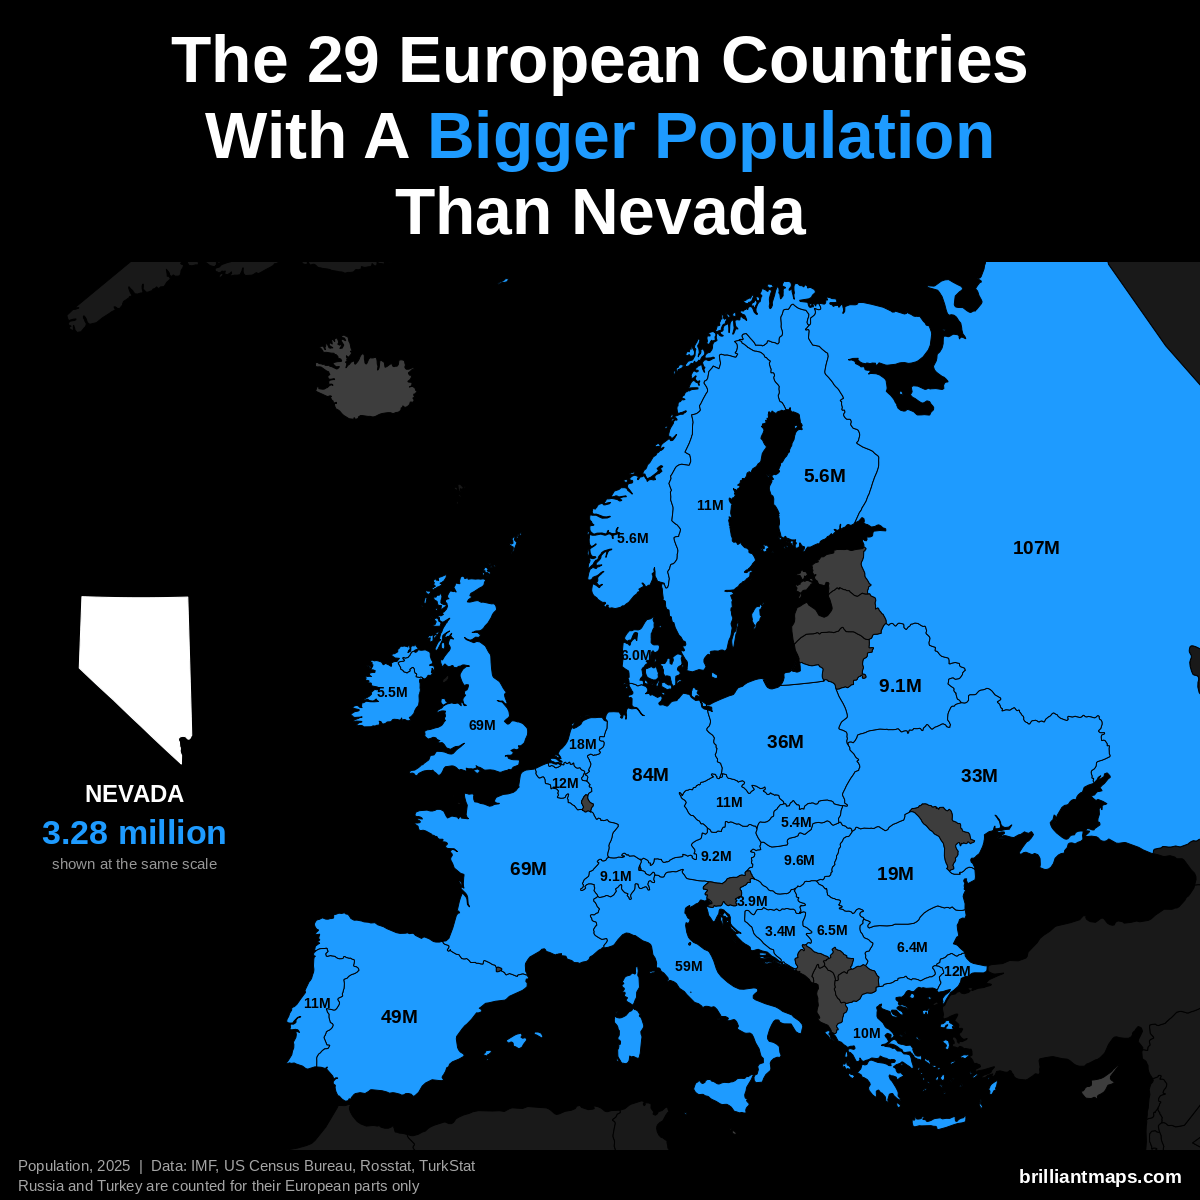
Nevada has a population of 3.3 million (2025). 29 European countries have a bigger population:
- Russia (European part): 107.0 million
- Germany: 83.5 million
- United Kingdom: 69.5 million
- France: 68.9 million
- Italy: 58.9 million
- Spain: 49.5 million
- Poland: 36.5 million
- Ukraine: 32.9 million
- Romania: 19.0 million
- Netherlands: 18.0 million
- Turkey (European part): 12.2 million
- Belgium: 11.9 million
- Portugal: 10.8 million
- Czechia: 10.8 million
- Sweden: 10.7 million
- Greece: 10.4 million
- Hungary: 9.6 million
- Austria: 9.2 million
- Belarus: 9.1 million
- Switzerland: 9.1 million
- Serbia: 6.5 million
- Bulgaria: 6.4 million
- Denmark: 6.0 million
- Norway: 5.6 million
- Finland: 5.6 million
- Ireland: 5.5 million
- Slovakia: 5.4 million
- Croatia: 3.9 million
- Bosnia and Herzegovina: 3.4 million
Nevada Vs European GDP (Nominal)
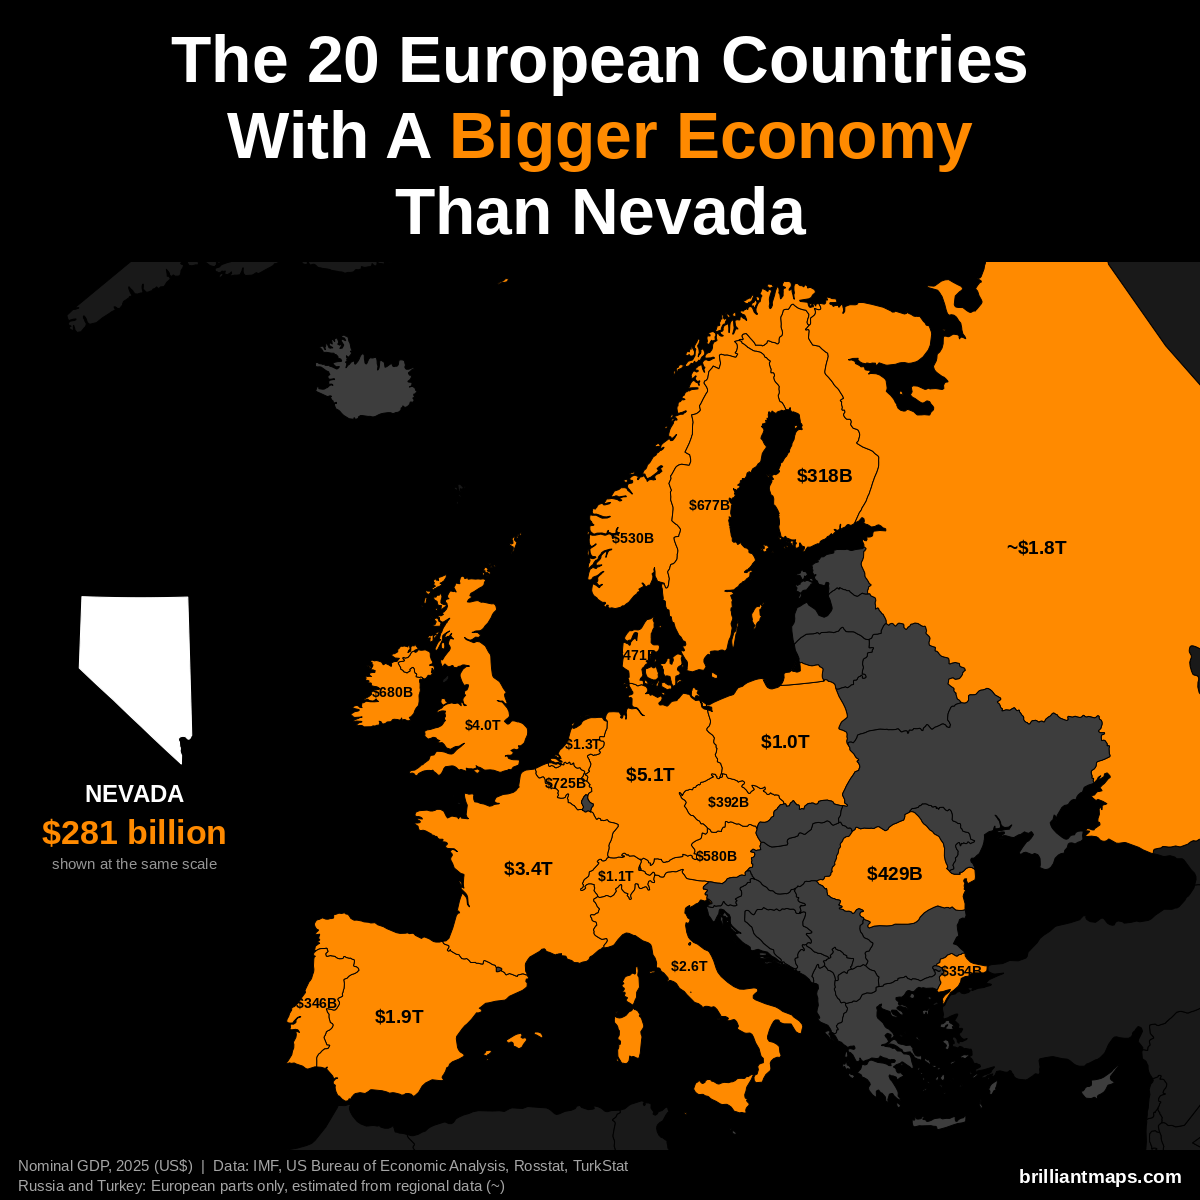
Nevada has a nominal GDP of $281 billion (2025). 20 European countries have a bigger economy:
- Germany: $5.12 trillion
- United Kingdom: $4.01 trillion
- France: $3.38 trillion
- Italy: $2.55 trillion
- Spain: $1.91 trillion
- Russia (European part): ~$1.83 trillion
- Netherlands: $1.32 trillion
- Switzerland: $1.06 trillion
- Poland: $1.04 trillion
- Belgium: $725 billion
- Ireland: $680 billion
- Sweden: $677 billion
- Austria: $580 billion
- Norway: $530 billion
- Denmark: $471 billion
- Romania: $429 billion
- Czechia: $392 billion
- Turkey (European part): ~$354 billion
- Portugal: $346 billion
- Finland: $318 billion
Nevada Vs European GDP (PPP)
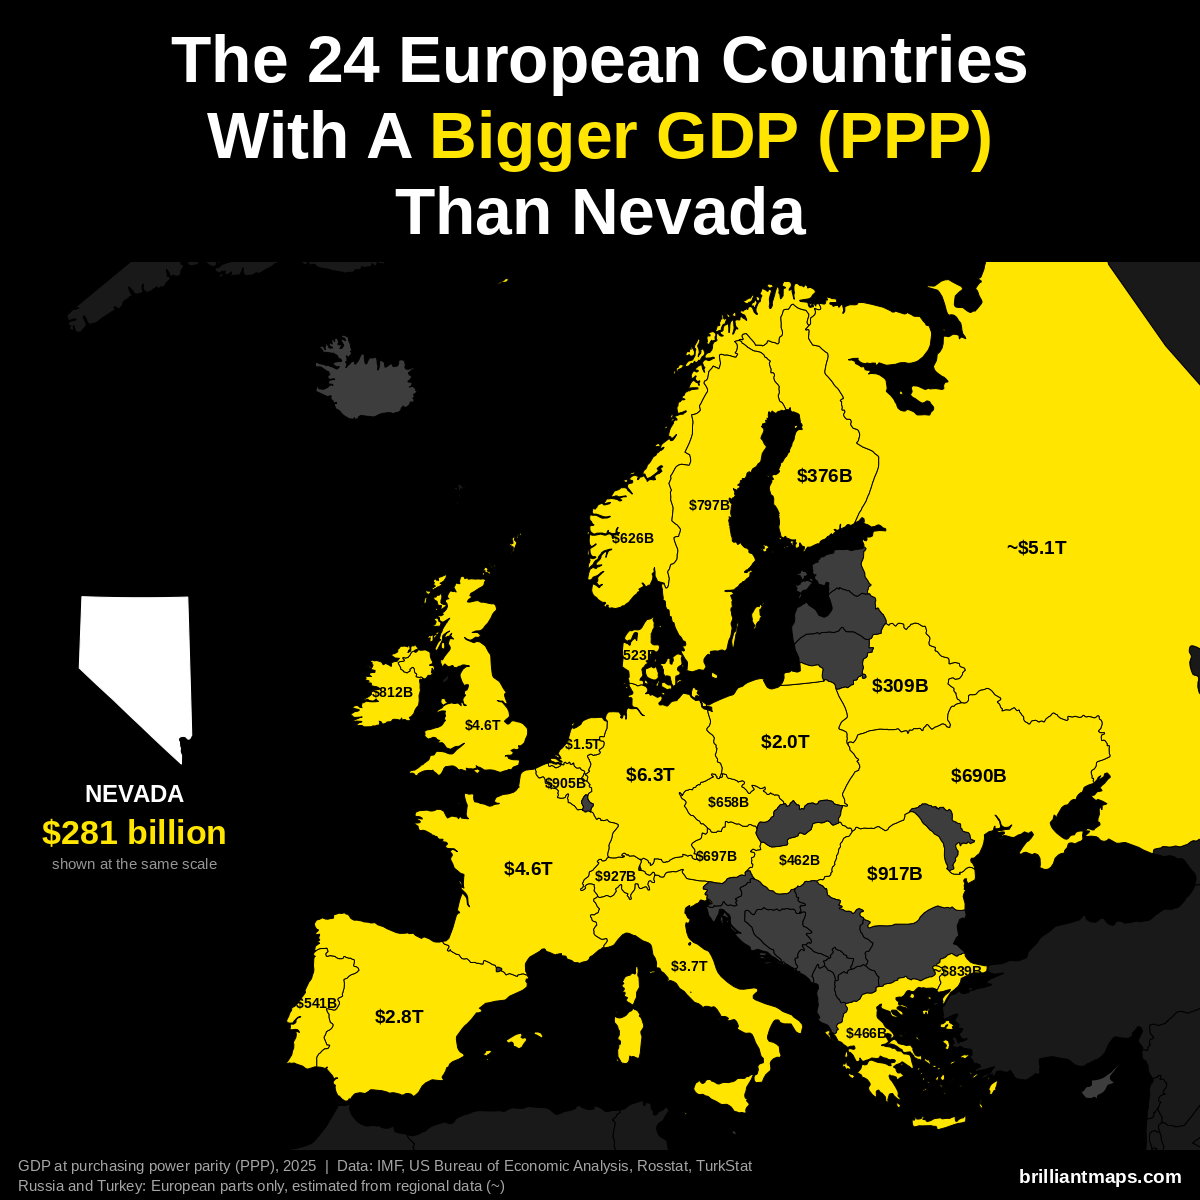
Nevada has a GDP of $281 billion (2025). US states are already measured in the dollars PPP is based on, so the figure is the same as nominal GDP. 24 European countries have a bigger GDP at purchasing power parity:
- Germany: $6.26 trillion
- Russia (European part): ~$5.14 trillion
- France: $4.58 trillion
- United Kingdom: $4.57 trillion
- Italy: $3.74 trillion
- Spain: $2.83 trillion
- Poland: $2.04 trillion
- Netherlands: $1.52 trillion
- Switzerland: $927 billion
- Romania: $917 billion
- Belgium: $905 billion
- Turkey (European part): ~$839 billion
- Ireland: $812 billion
- Sweden: $797 billion
- Austria: $697 billion
- Ukraine: $690 billion
- Czechia: $658 billion
- Norway: $626 billion
- Portugal: $541 billion
- Denmark: $523 billion
- Greece: $466 billion
- Hungary: $462 billion
- Finland: $376 billion
- Belarus: $309 billion
Nevada Vs European GDP Per Capita (PPP)
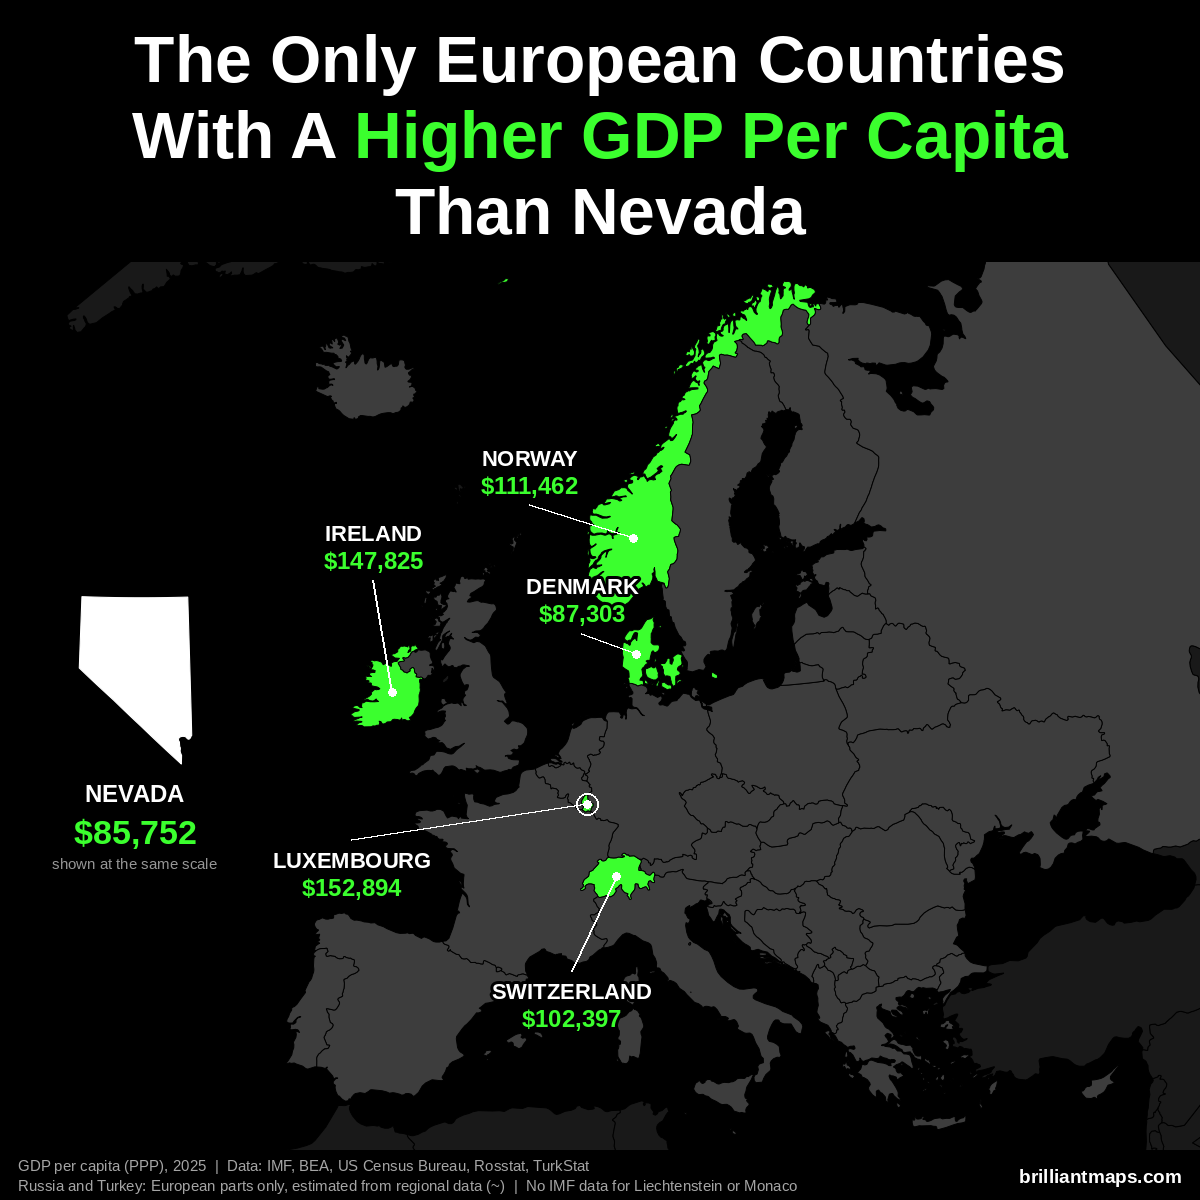
Nevada has a GDP per capita of $85,752 (2025). Only 5 European countries have a higher GDP per capita at purchasing power parity:
- Luxembourg: $152,894
- Ireland: $147,825
- Norway: $111,462
- Switzerland: $102,397
- Denmark: $87,303
Liechtenstein and Monaco are not covered by the IMF data and are not counted here.
Nevada Vs European Size
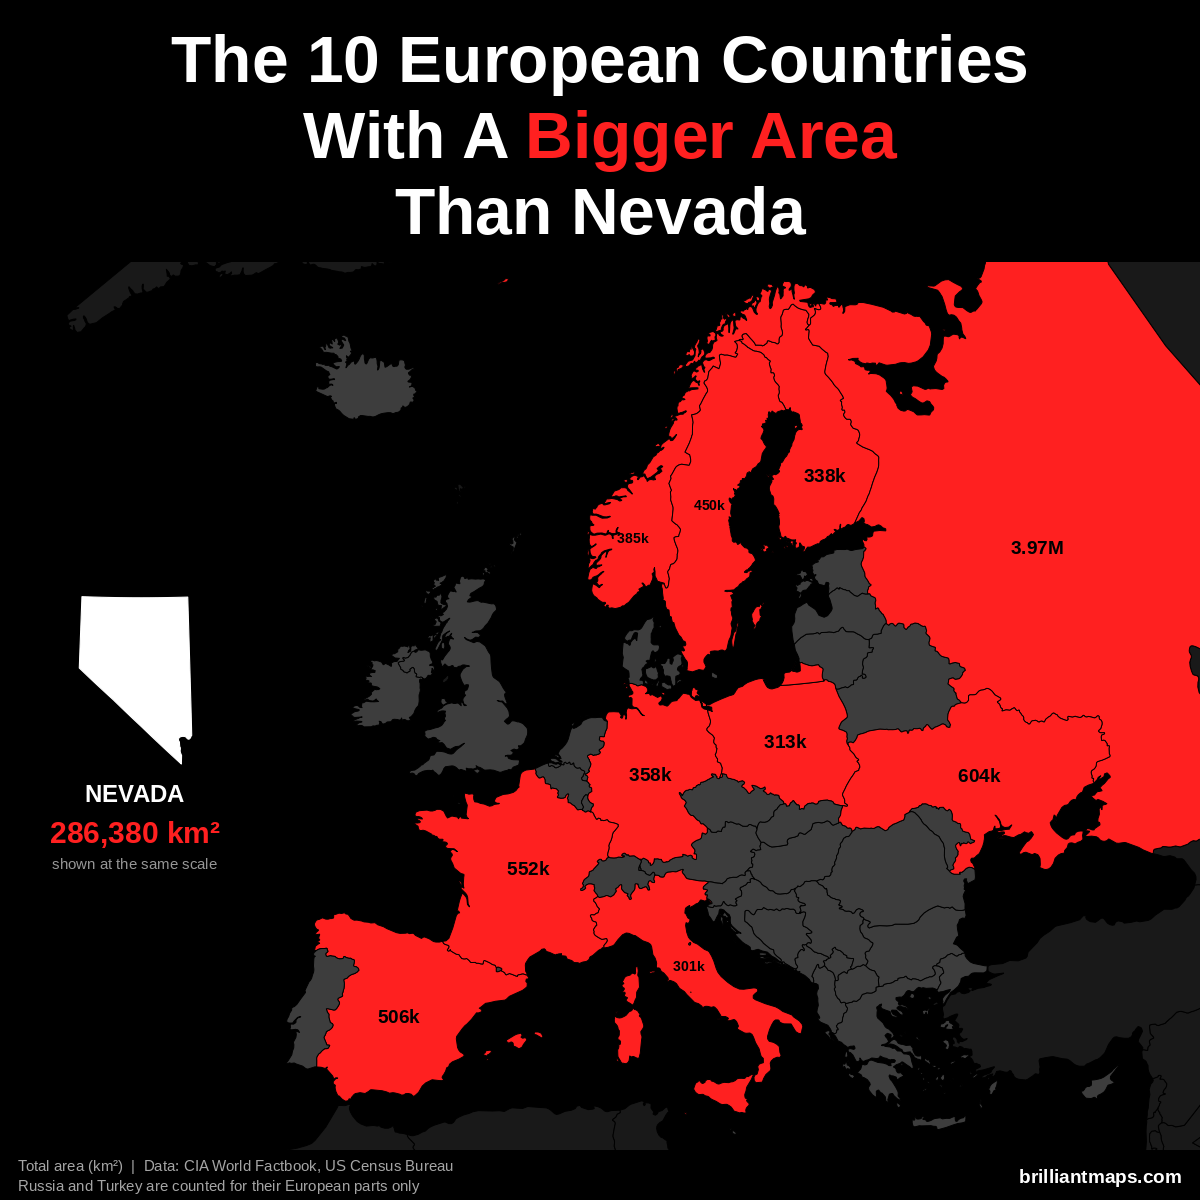
Nevada has a total area of 286,380 km² (110,572 sq mi). 10 European countries have a bigger area:
- Russia (European part): 3,969,100 km² (1,532,477 sq mi)
- Ukraine: 603,550 km² (233,032 sq mi)
- France: 551,695 km² (213,010 sq mi)
- Spain: 505,990 km² (195,364 sq mi)
- Sweden: 450,295 km² (173,860 sq mi)
- Norway: 385,207 km² (148,729 sq mi)
- Germany: 357,588 km² (138,065 sq mi)
- Finland: 338,455 km² (130,678 sq mi)
- Poland: 312,696 km² (120,733 sq mi)
- Italy: 301,340 km² (116,348 sq mi)
Nevada Vs European Life Expectancy
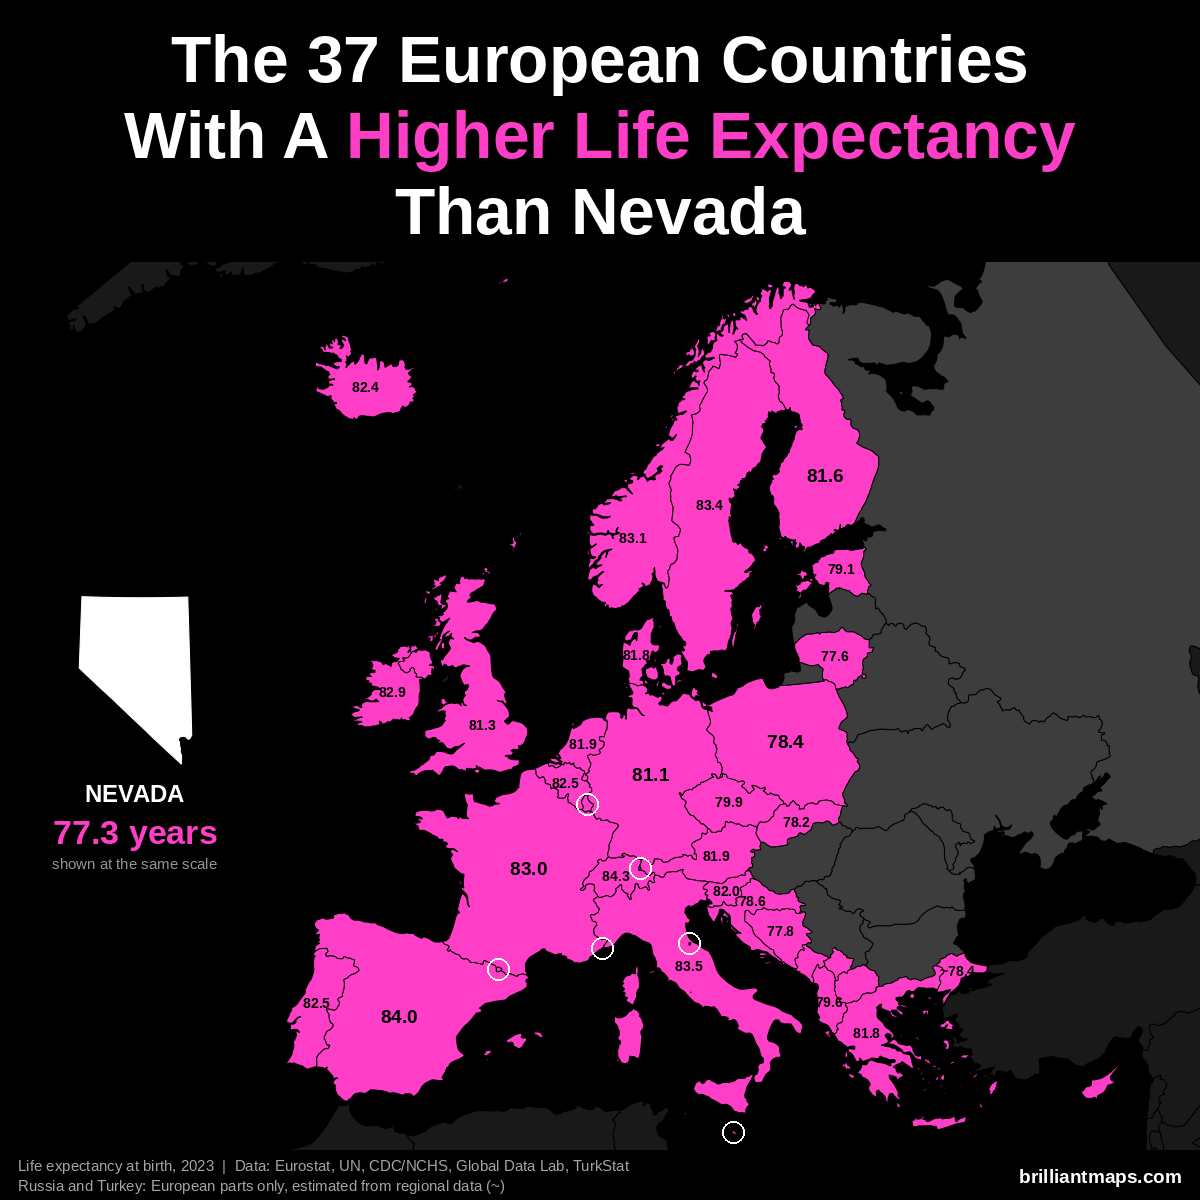
Nevada has a life expectancy at birth of 77.3 years (2023). 37 European countries have a higher life expectancy:
- Monaco: 86.4 years
- San Marino: 85.7 years
- Liechtenstein: 84.6 years
- Switzerland: 84.3 years
- Andorra: 84.0 years
- Spain: 84.0 years
- Italy: 83.5 years
- Luxembourg: 83.4 years
- Malta: 83.4 years
- Sweden: 83.4 years
- Norway: 83.1 years
- France: 83.0 years
- Cyprus: 82.9 years
- Ireland: 82.9 years
- Belgium: 82.5 years
- Portugal: 82.5 years
- Iceland: 82.4 years
- Slovenia: 82.0 years
- Austria: 81.9 years
- Netherlands: 81.9 years
- Denmark: 81.8 years
- Greece: 81.8 years
- Finland: 81.6 years
- United Kingdom: 81.3 years
- Germany: 81.1 years
- Czechia: 79.9 years
- Albania: 79.6 years
- Estonia: 79.1 years
- Croatia: 78.6 years
- Poland: 78.4 years
- Turkey (European part): ~78.4 years
- Slovakia: 78.2 years
- Kosovo: 78.0 years
- Bosnia and Herzegovina: 77.8 years
- Lithuania: 77.6 years
- Montenegro: 77.6 years
- North Macedonia: 77.4 years
New Hampshire vs Europe
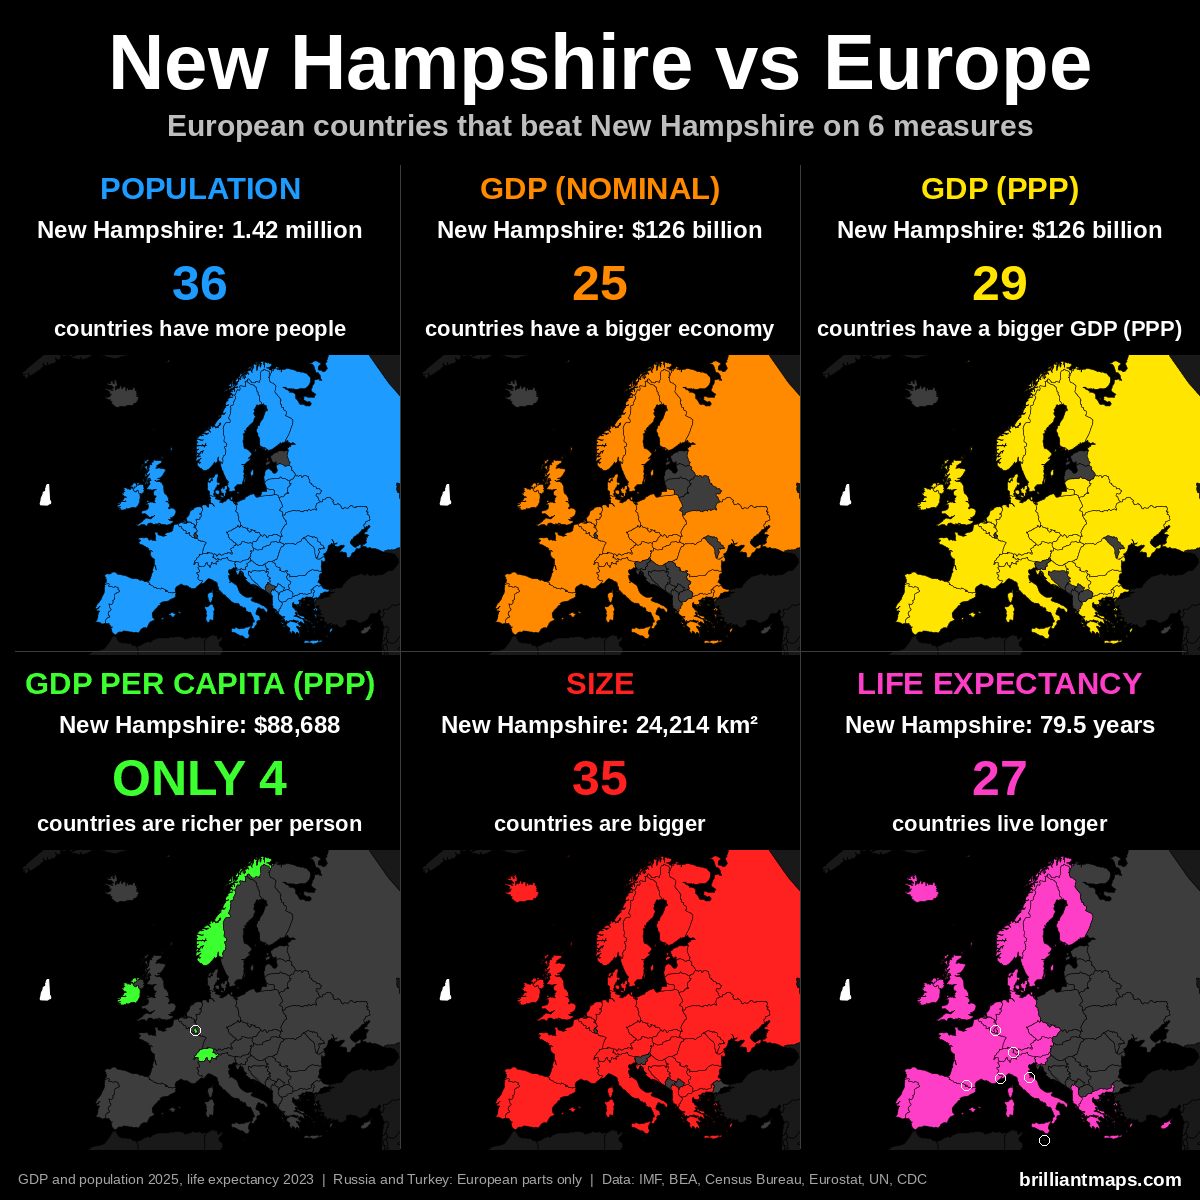
New Hampshire Vs European Population
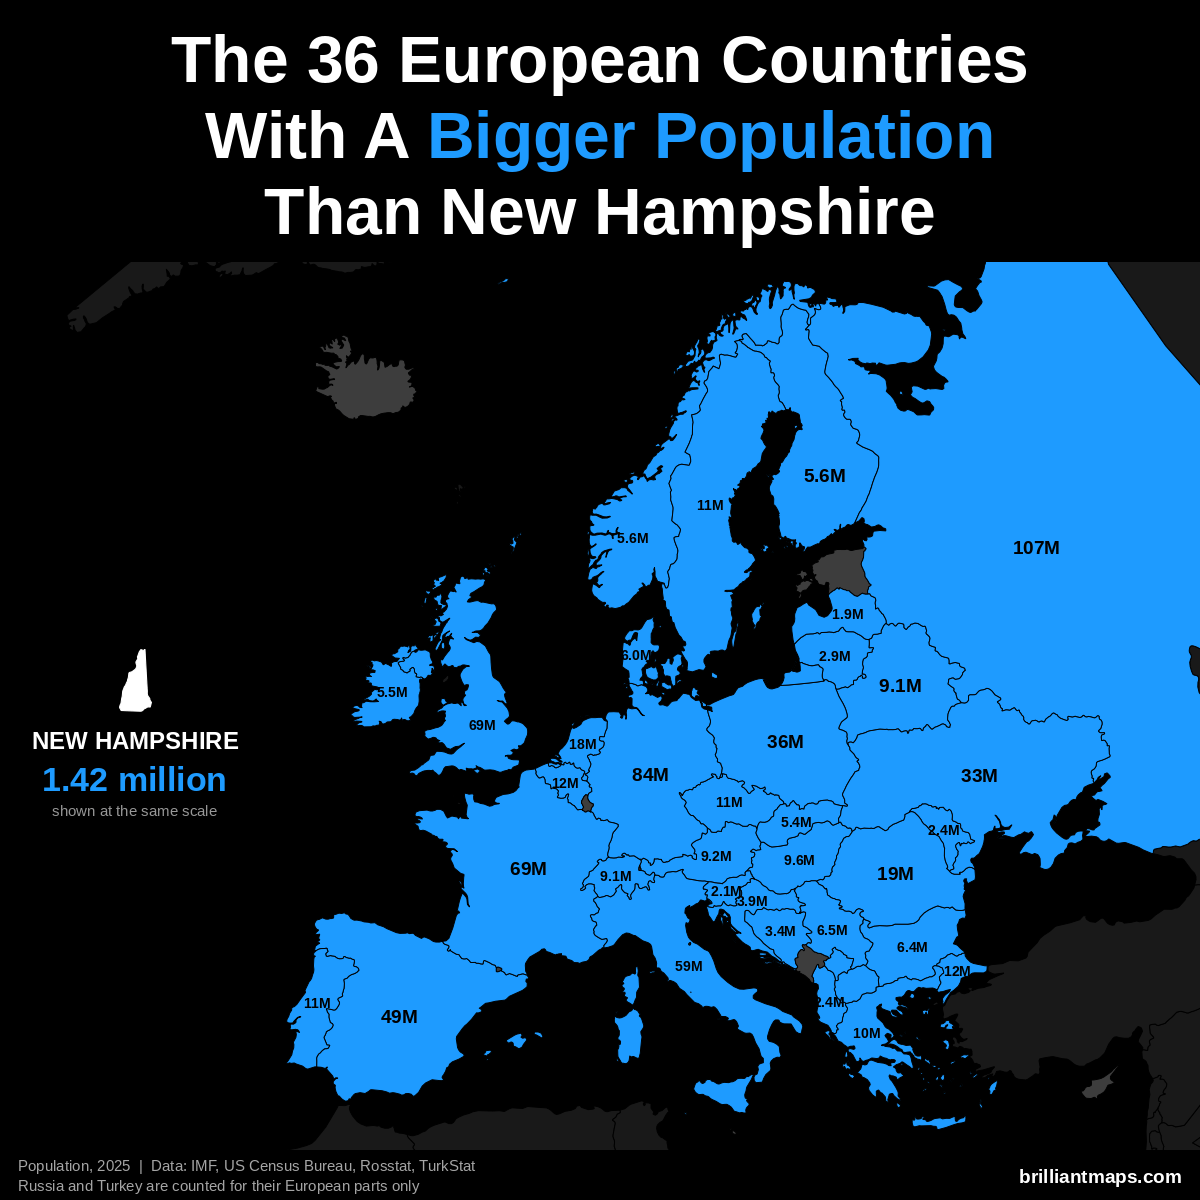
New Hampshire has a population of 1.4 million (2025). 36 European countries have a bigger population:
- Russia (European part): 107.0 million
- Germany: 83.5 million
- United Kingdom: 69.5 million
- France: 68.9 million
- Italy: 58.9 million
- Spain: 49.5 million
- Poland: 36.5 million
- Ukraine: 32.9 million
- Romania: 19.0 million
- Netherlands: 18.0 million
- Turkey (European part): 12.2 million
- Belgium: 11.9 million
- Portugal: 10.8 million
- Czechia: 10.8 million
- Sweden: 10.7 million
- Greece: 10.4 million
- Hungary: 9.6 million
- Austria: 9.2 million
- Belarus: 9.1 million
- Switzerland: 9.1 million
- Serbia: 6.5 million
- Bulgaria: 6.4 million
- Denmark: 6.0 million
- Norway: 5.6 million
- Finland: 5.6 million
- Ireland: 5.5 million
- Slovakia: 5.4 million
- Croatia: 3.9 million
- Bosnia and Herzegovina: 3.4 million
- Lithuania: 2.9 million
- Moldova: 2.4 million
- Albania: 2.4 million
- Slovenia: 2.1 million
- Latvia: 1.9 million
- North Macedonia: 1.8 million
- Kosovo: 1.6 million
New Hampshire Vs European GDP (Nominal)
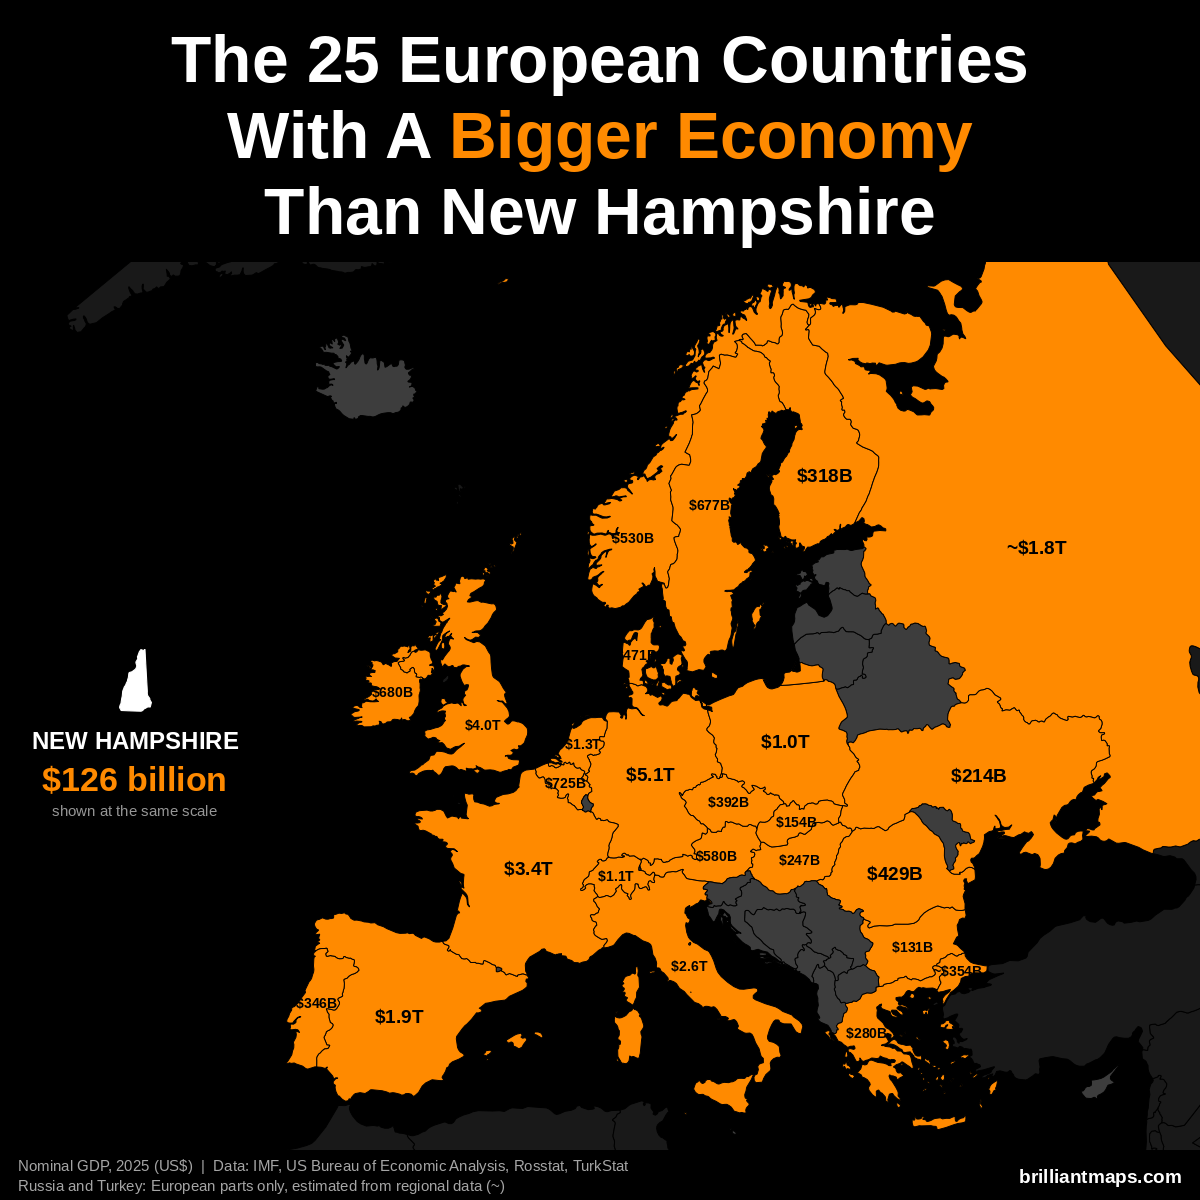
New Hampshire has a nominal GDP of $126 billion (2025). 25 European countries have a bigger economy:
- Germany: $5.12 trillion
- United Kingdom: $4.01 trillion
- France: $3.38 trillion
- Italy: $2.55 trillion
- Spain: $1.91 trillion
- Russia (European part): ~$1.83 trillion
- Netherlands: $1.32 trillion
- Switzerland: $1.06 trillion
- Poland: $1.04 trillion
- Belgium: $725 billion
- Ireland: $680 billion
- Sweden: $677 billion
- Austria: $580 billion
- Norway: $530 billion
- Denmark: $471 billion
- Romania: $429 billion
- Czechia: $392 billion
- Turkey (European part): ~$354 billion
- Portugal: $346 billion
- Finland: $318 billion
- Greece: $280 billion
- Hungary: $247 billion
- Ukraine: $214 billion
- Slovakia: $154 billion
- Bulgaria: $131 billion
New Hampshire Vs European GDP (PPP)
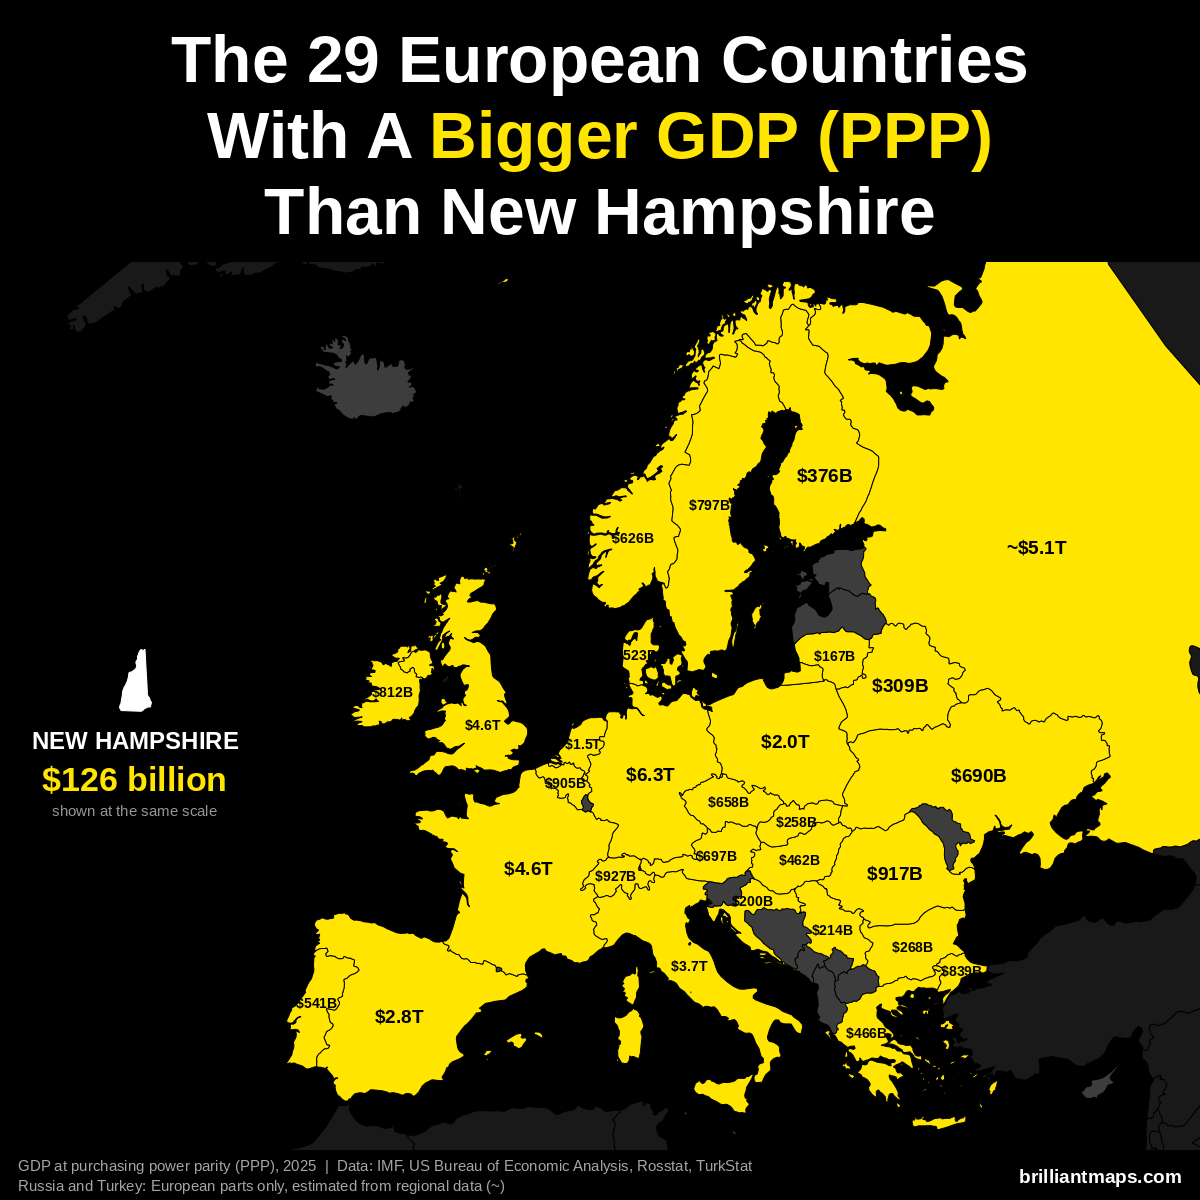
New Hampshire has a GDP of $126 billion (2025). US states are already measured in the dollars PPP is based on, so the figure is the same as nominal GDP. 29 European countries have a bigger GDP at purchasing power parity:
- Germany: $6.26 trillion
- Russia (European part): ~$5.14 trillion
- France: $4.58 trillion
- United Kingdom: $4.57 trillion
- Italy: $3.74 trillion
- Spain: $2.83 trillion
- Poland: $2.04 trillion
- Netherlands: $1.52 trillion
- Switzerland: $927 billion
- Romania: $917 billion
- Belgium: $905 billion
- Turkey (European part): ~$839 billion
- Ireland: $812 billion
- Sweden: $797 billion
- Austria: $697 billion
- Ukraine: $690 billion
- Czechia: $658 billion
- Norway: $626 billion
- Portugal: $541 billion
- Denmark: $523 billion
- Greece: $466 billion
- Hungary: $462 billion
- Finland: $376 billion
- Belarus: $309 billion
- Bulgaria: $268 billion
- Slovakia: $258 billion
- Serbia: $214 billion
- Croatia: $200 billion
- Lithuania: $167 billion
New Hampshire Vs European GDP Per Capita (PPP)
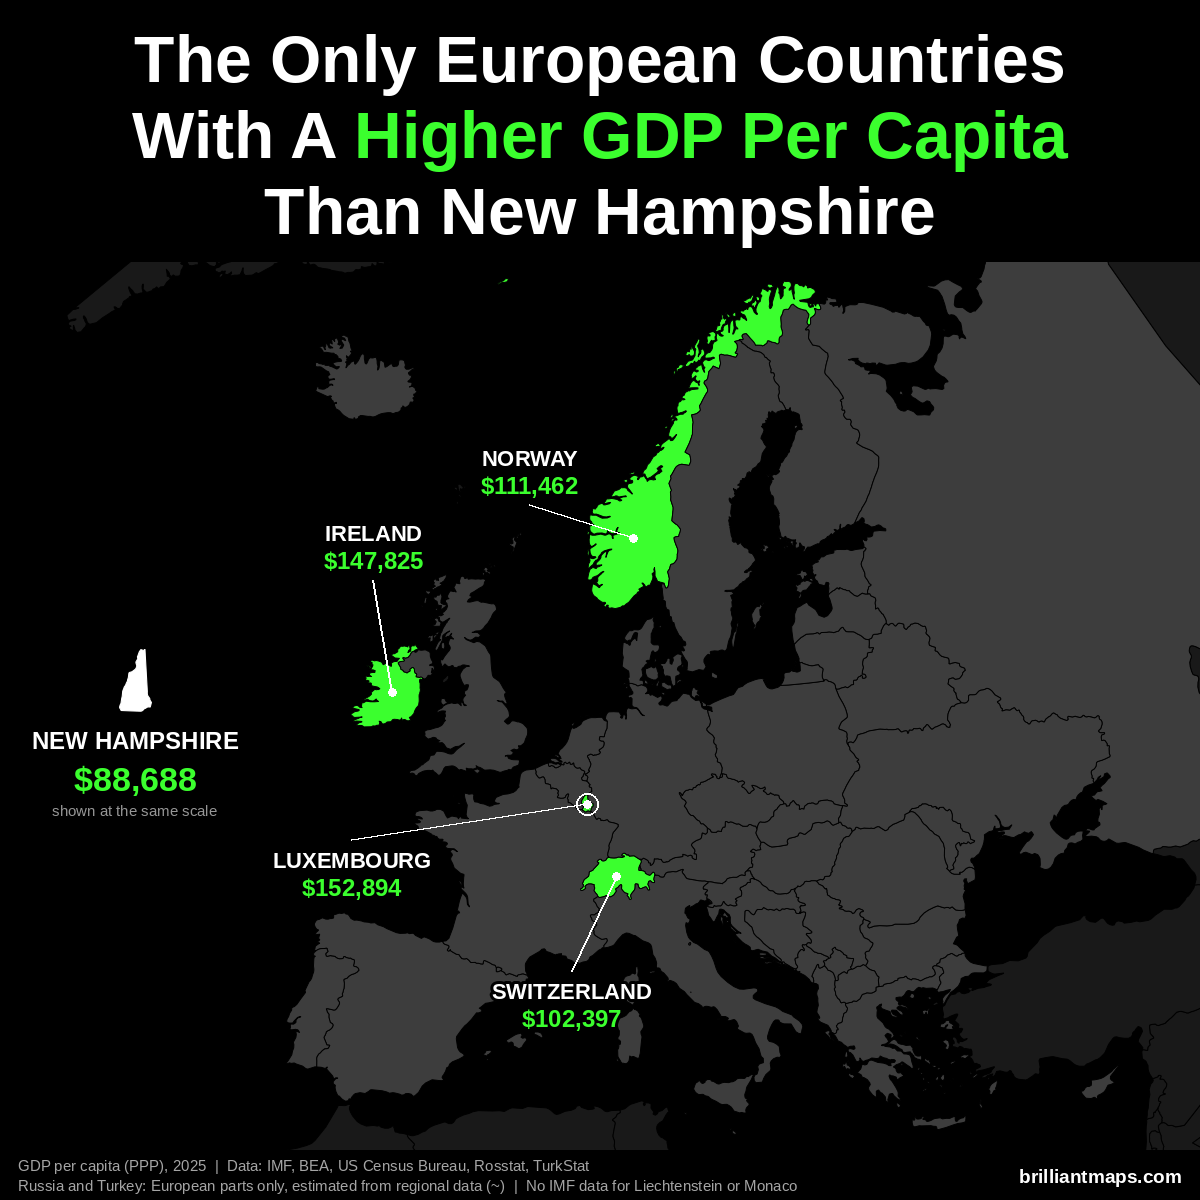
New Hampshire has a GDP per capita of $88,688 (2025). Only 4 European countries have a higher GDP per capita at purchasing power parity:
- Luxembourg: $152,894
- Ireland: $147,825
- Norway: $111,462
- Switzerland: $102,397
Liechtenstein and Monaco are not covered by the IMF data and are not counted here.
New Hampshire Vs European Size
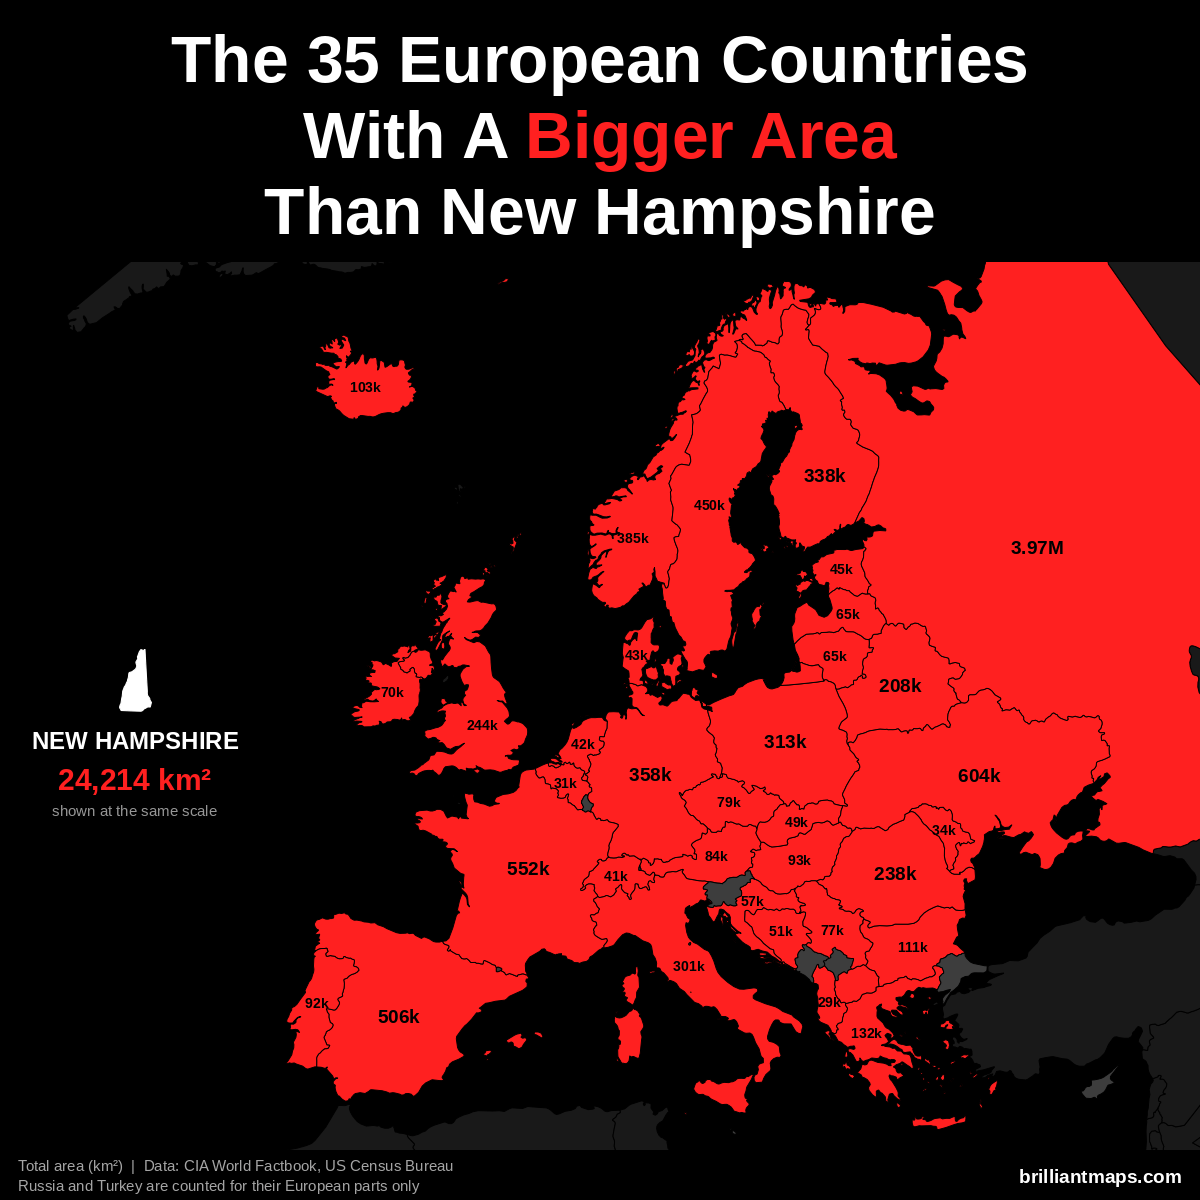
New Hampshire has a total area of 24,214 km² (9,349 sq mi). 35 European countries have a bigger area:
- Russia (European part): 3,969,100 km² (1,532,477 sq mi)
- Ukraine: 603,550 km² (233,032 sq mi)
- France: 551,695 km² (213,010 sq mi)
- Spain: 505,990 km² (195,364 sq mi)
- Sweden: 450,295 km² (173,860 sq mi)
- Norway: 385,207 km² (148,729 sq mi)
- Germany: 357,588 km² (138,065 sq mi)
- Finland: 338,455 km² (130,678 sq mi)
- Poland: 312,696 km² (120,733 sq mi)
- Italy: 301,340 km² (116,348 sq mi)
- United Kingdom: 243,610 km² (94,058 sq mi)
- Romania: 238,397 km² (92,046 sq mi)
- Belarus: 207,600 km² (80,155 sq mi)
- Greece: 131,957 km² (50,949 sq mi)
- Bulgaria: 110,994 km² (42,855 sq mi)
- Iceland: 103,000 km² (39,768 sq mi)
- Hungary: 93,028 km² (35,918 sq mi)
- Portugal: 92,212 km² (35,603 sq mi)
- Austria: 83,871 km² (32,383 sq mi)
- Czechia: 78,867 km² (30,451 sq mi)
- Serbia: 77,474 km² (29,913 sq mi)
- Ireland: 70,273 km² (27,133 sq mi)
- Lithuania: 65,300 km² (25,212 sq mi)
- Latvia: 64,589 km² (24,938 sq mi)
- Croatia: 56,594 km² (21,851 sq mi)
- Bosnia and Herzegovina: 51,197 km² (19,767 sq mi)
- Slovakia: 49,035 km² (18,933 sq mi)
- Estonia: 45,339 km² (17,505 sq mi)
- Denmark: 43,094 km² (16,639 sq mi)
- Netherlands: 41,850 km² (16,158 sq mi)
- Switzerland: 41,285 km² (15,940 sq mi)
- Moldova: 33,846 km² (13,068 sq mi)
- Belgium: 30,528 km² (11,787 sq mi)
- Albania: 28,748 km² (11,100 sq mi)
- North Macedonia: 25,713 km² (9,928 sq mi)
New Hampshire Vs European Life Expectancy
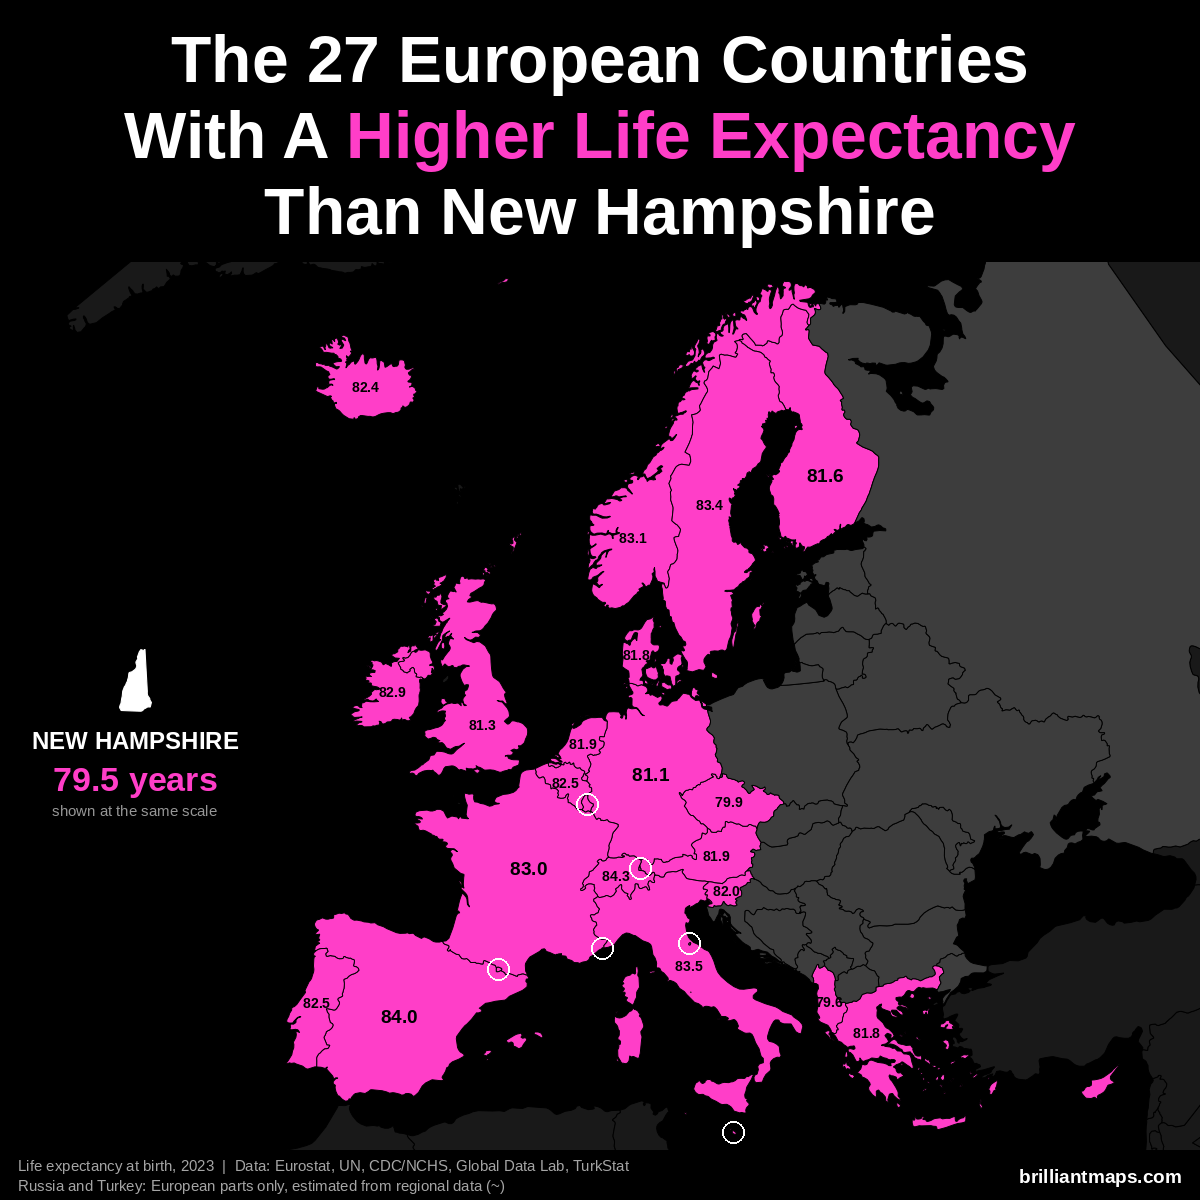
New Hampshire has a life expectancy at birth of 79.5 years (2023). 27 European countries have a higher life expectancy:
- Monaco: 86.4 years
- San Marino: 85.7 years
- Liechtenstein: 84.6 years
- Switzerland: 84.3 years
- Andorra: 84.0 years
- Spain: 84.0 years
- Italy: 83.5 years
- Luxembourg: 83.4 years
- Malta: 83.4 years
- Sweden: 83.4 years
- Norway: 83.1 years
- France: 83.0 years
- Cyprus: 82.9 years
- Ireland: 82.9 years
- Belgium: 82.5 years
- Portugal: 82.5 years
- Iceland: 82.4 years
- Slovenia: 82.0 years
- Austria: 81.9 years
- Netherlands: 81.9 years
- Denmark: 81.8 years
- Greece: 81.8 years
- Finland: 81.6 years
- United Kingdom: 81.3 years
- Germany: 81.1 years
- Czechia: 79.9 years
- Albania: 79.6 years
New Jersey vs Europe
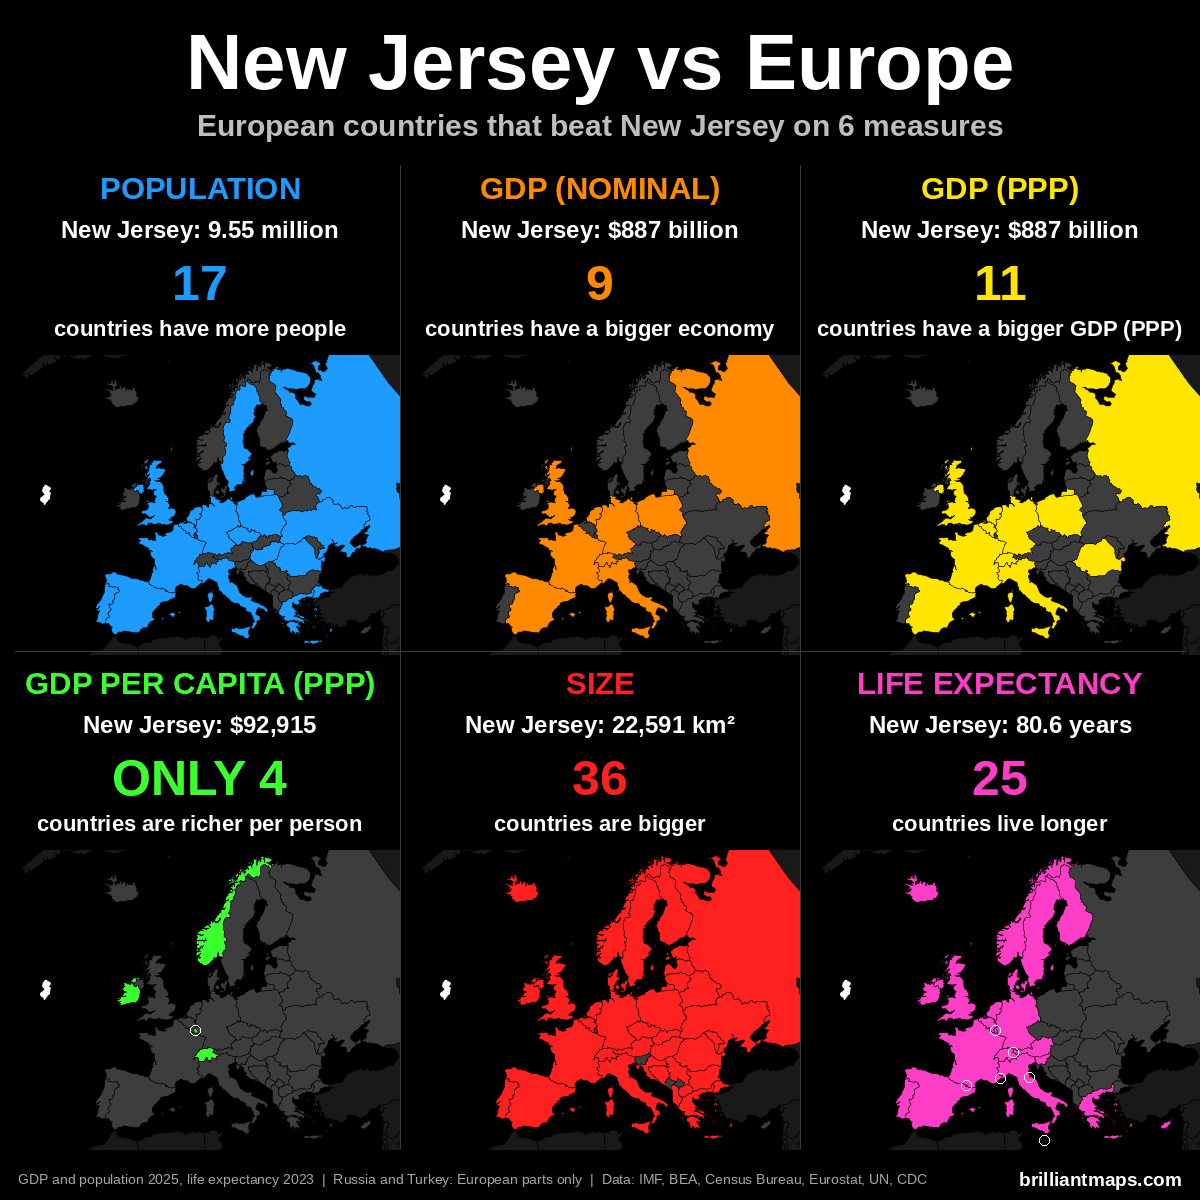
New Jersey Vs European Population
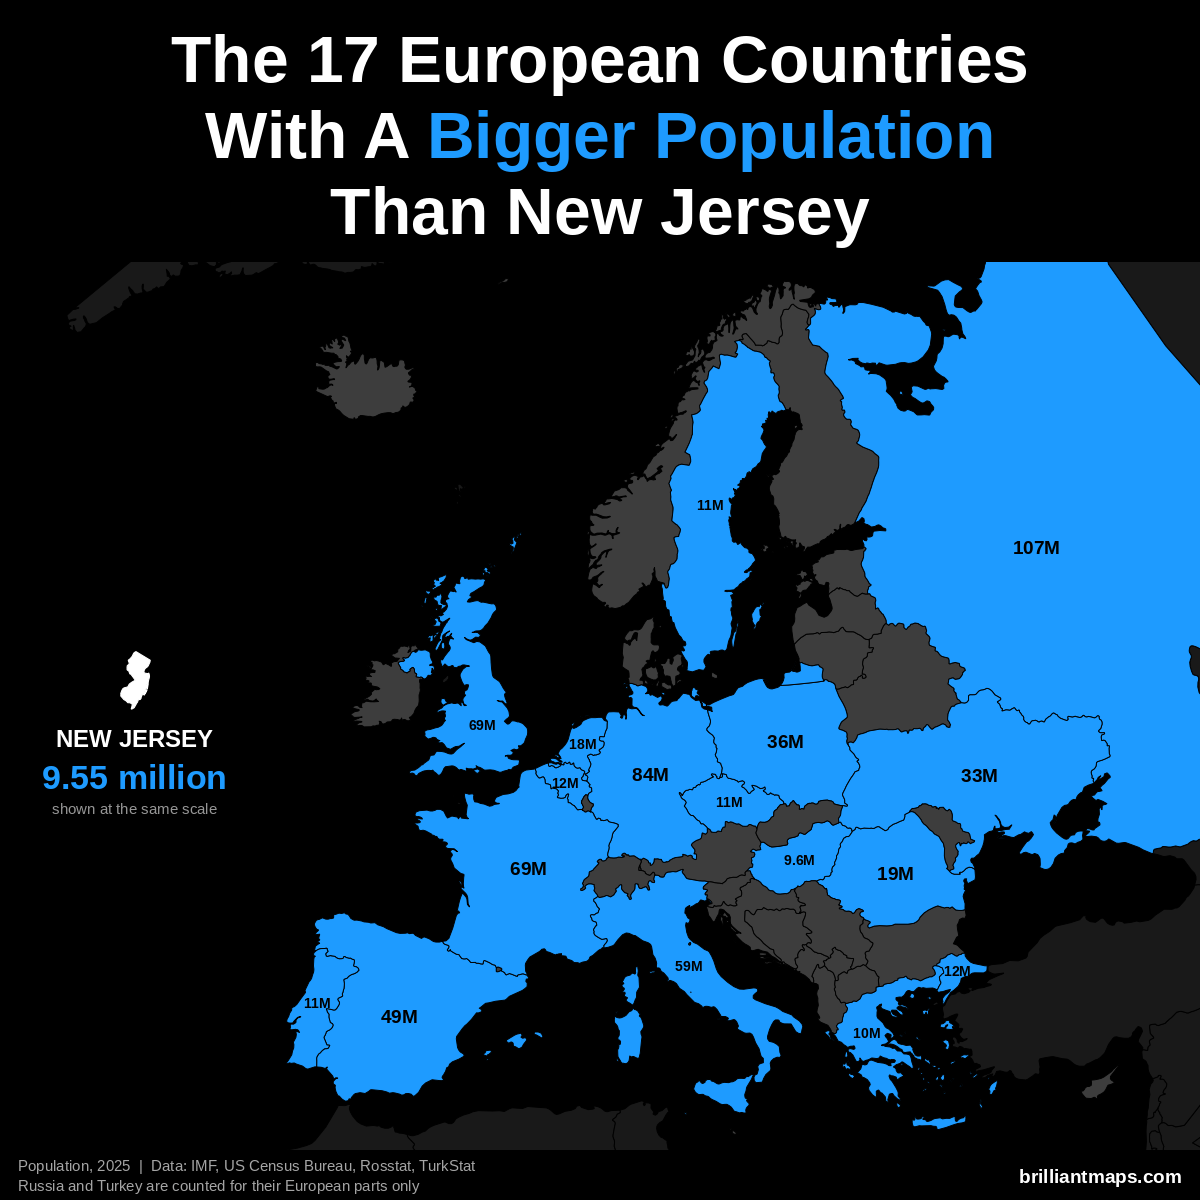
New Jersey has a population of 9.5 million (2025). 17 European countries have a bigger population:
- Russia (European part): 107.0 million
- Germany: 83.5 million
- United Kingdom: 69.5 million
- France: 68.9 million
- Italy: 58.9 million
- Spain: 49.5 million
- Poland: 36.5 million
- Ukraine: 32.9 million
- Romania: 19.0 million
- Netherlands: 18.0 million
- Turkey (European part): 12.2 million
- Belgium: 11.9 million
- Portugal: 10.8 million
- Czechia: 10.8 million
- Sweden: 10.7 million
- Greece: 10.4 million
- Hungary: 9.6 million
New Jersey Vs European GDP (Nominal)
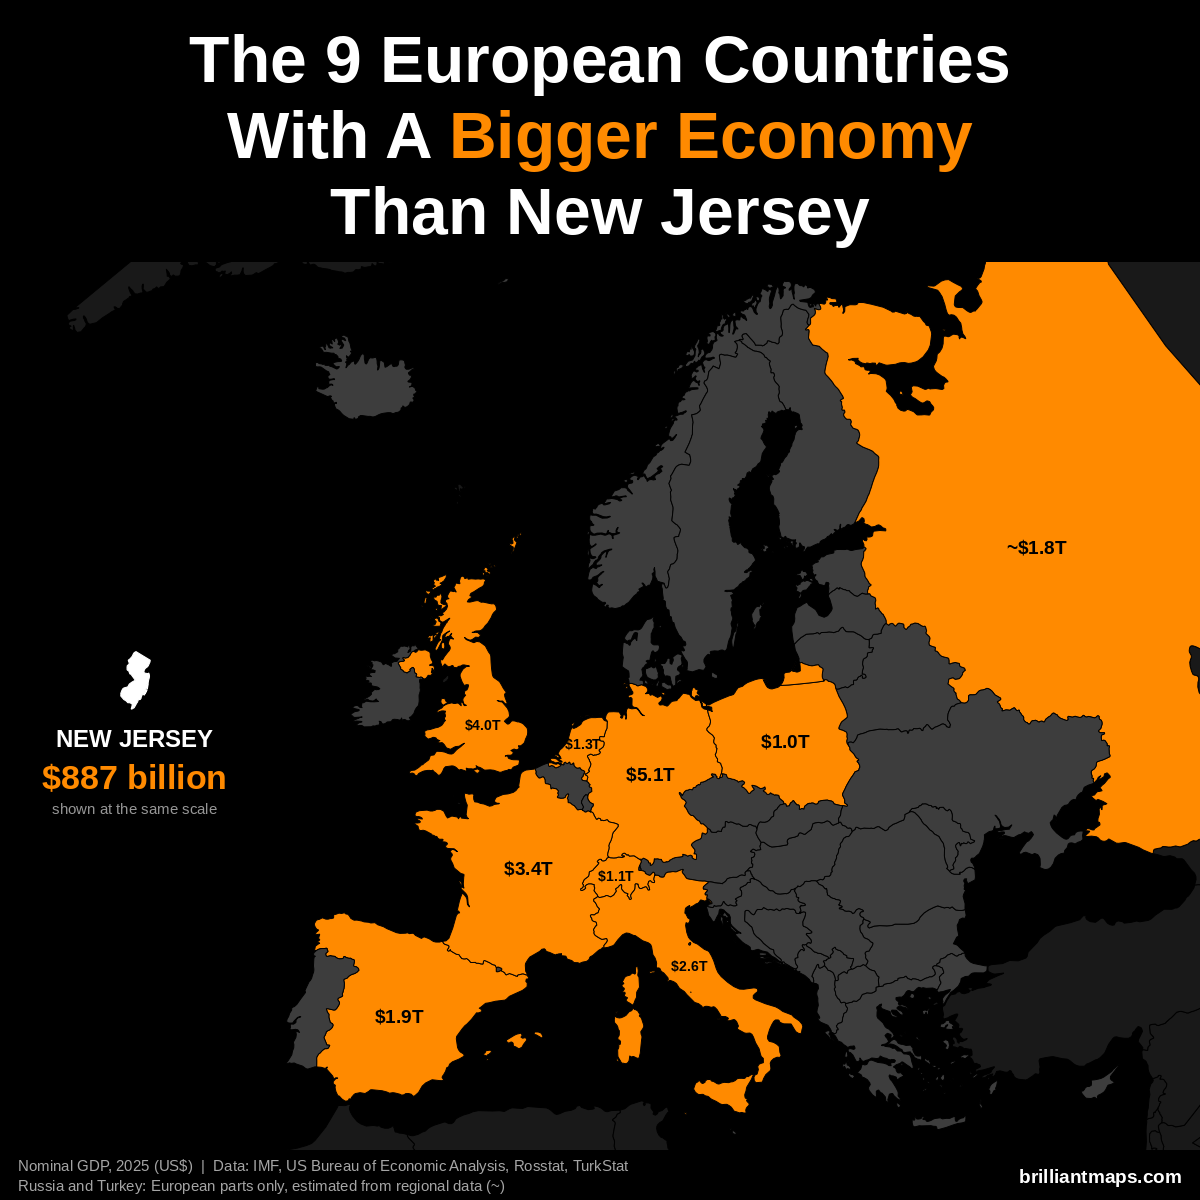
New Jersey has a nominal GDP of $887 billion (2025). 9 European countries have a bigger economy:
- Germany: $5.12 trillion
- United Kingdom: $4.01 trillion
- France: $3.38 trillion
- Italy: $2.55 trillion
- Spain: $1.91 trillion
- Russia (European part): ~$1.83 trillion
- Netherlands: $1.32 trillion
- Switzerland: $1.06 trillion
- Poland: $1.04 trillion
New Jersey Vs European GDP (PPP)
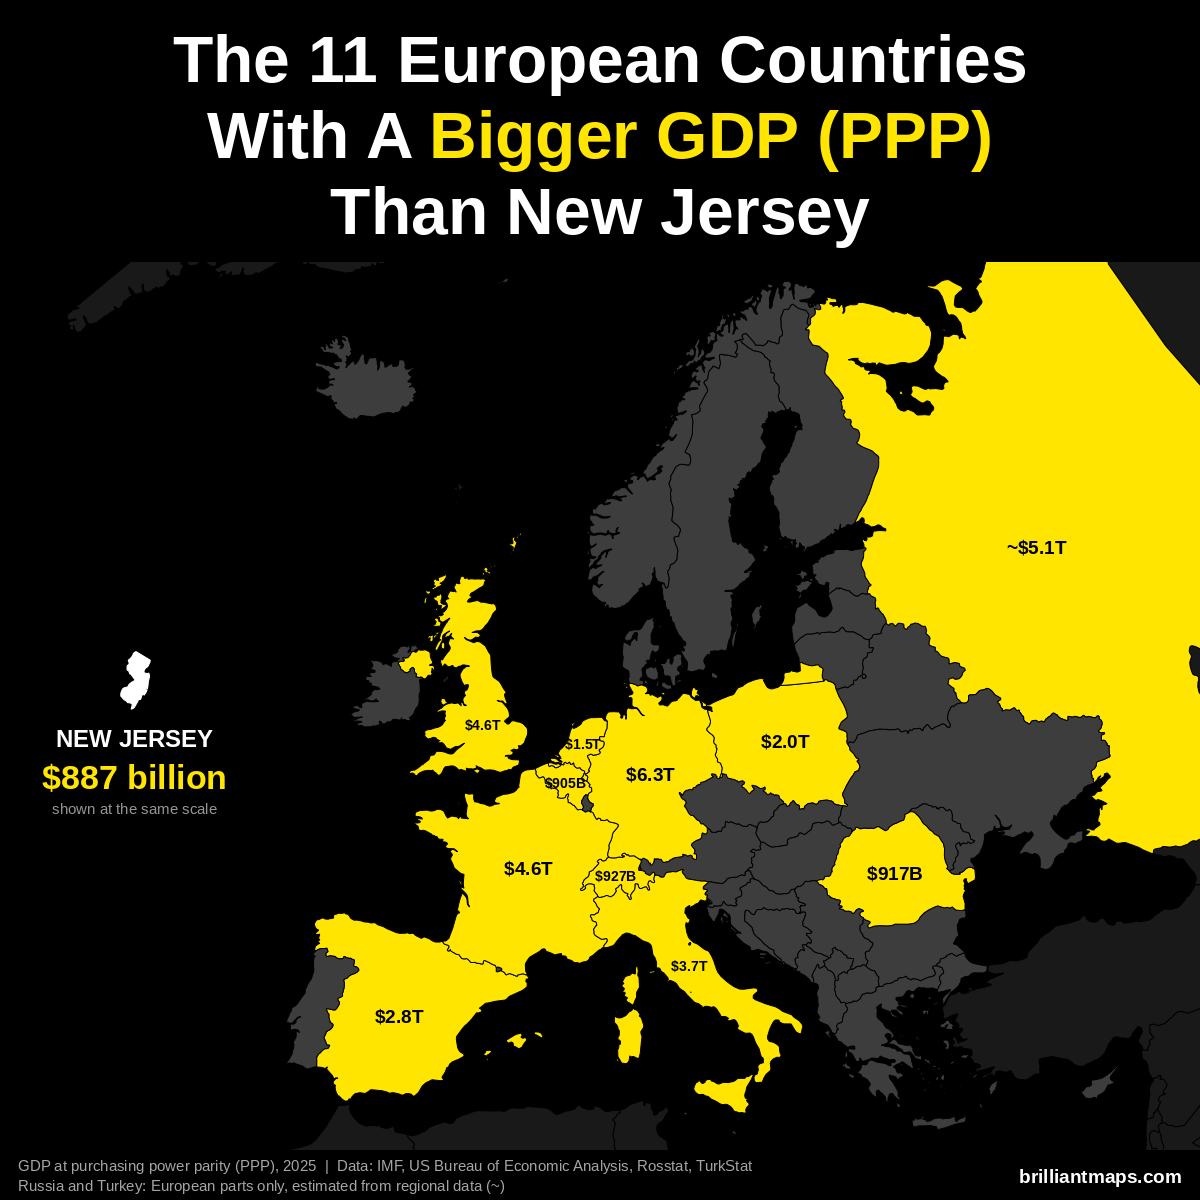
New Jersey has a GDP of $887 billion (2025). US states are already measured in the dollars PPP is based on, so the figure is the same as nominal GDP. 11 European countries have a bigger GDP at purchasing power parity:
- Germany: $6.26 trillion
- Russia (European part): ~$5.14 trillion
- France: $4.58 trillion
- United Kingdom: $4.57 trillion
- Italy: $3.74 trillion
- Spain: $2.83 trillion
- Poland: $2.04 trillion
- Netherlands: $1.52 trillion
- Switzerland: $927 billion
- Romania: $917 billion
- Belgium: $905 billion
New Jersey Vs European GDP Per Capita (PPP)
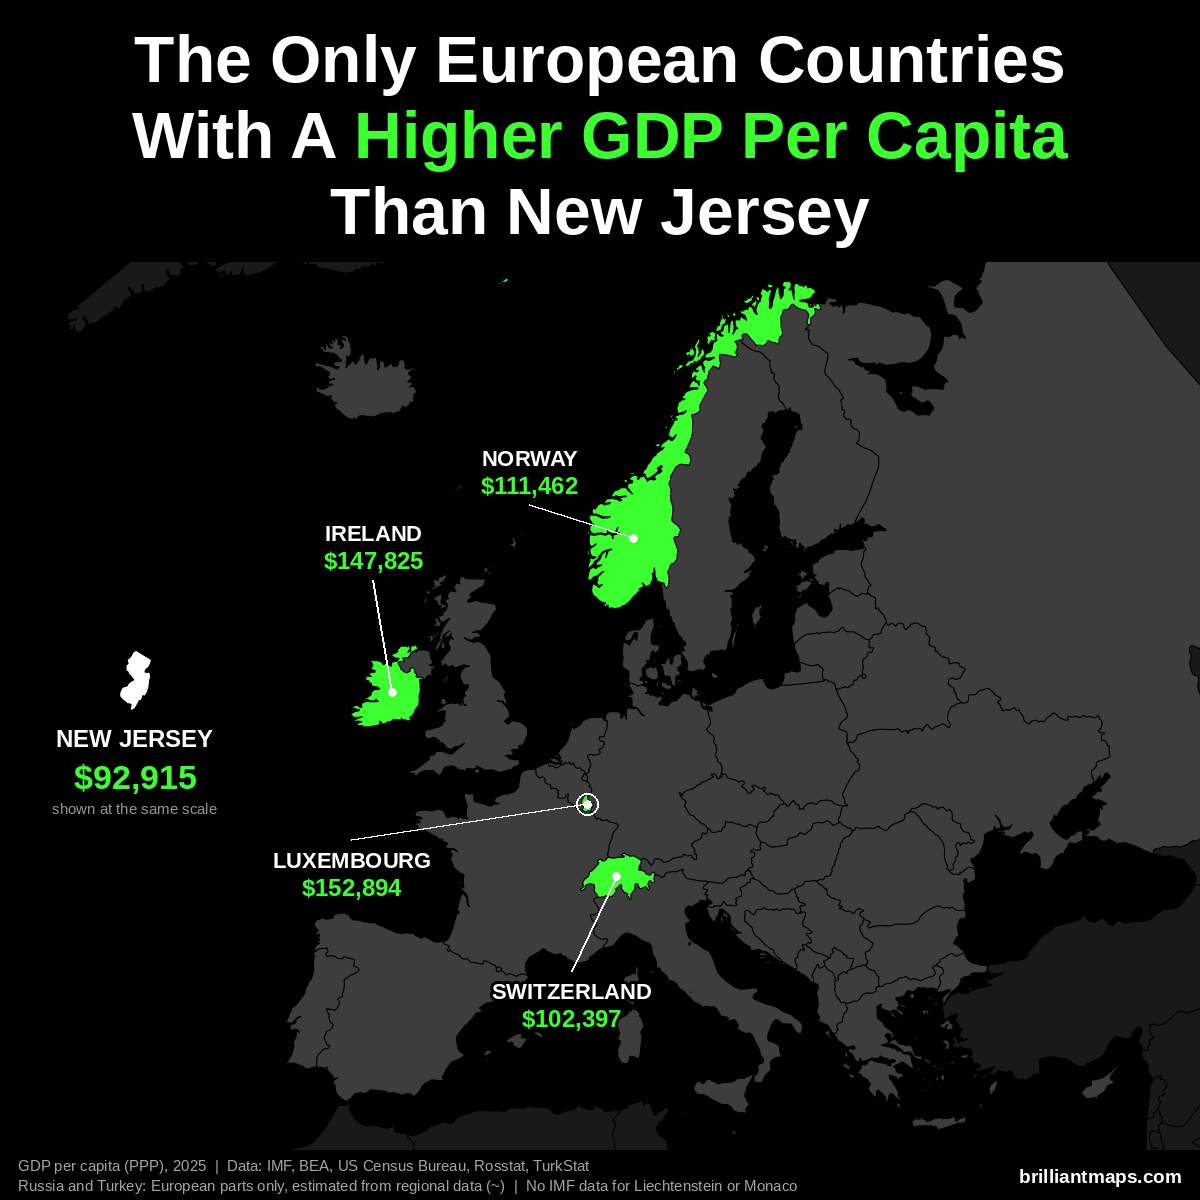
New Jersey has a GDP per capita of $92,915 (2025). Only 4 European countries have a higher GDP per capita at purchasing power parity:
- Luxembourg: $152,894
- Ireland: $147,825
- Norway: $111,462
- Switzerland: $102,397
Liechtenstein and Monaco are not covered by the IMF data and are not counted here.
New Jersey Vs European Size
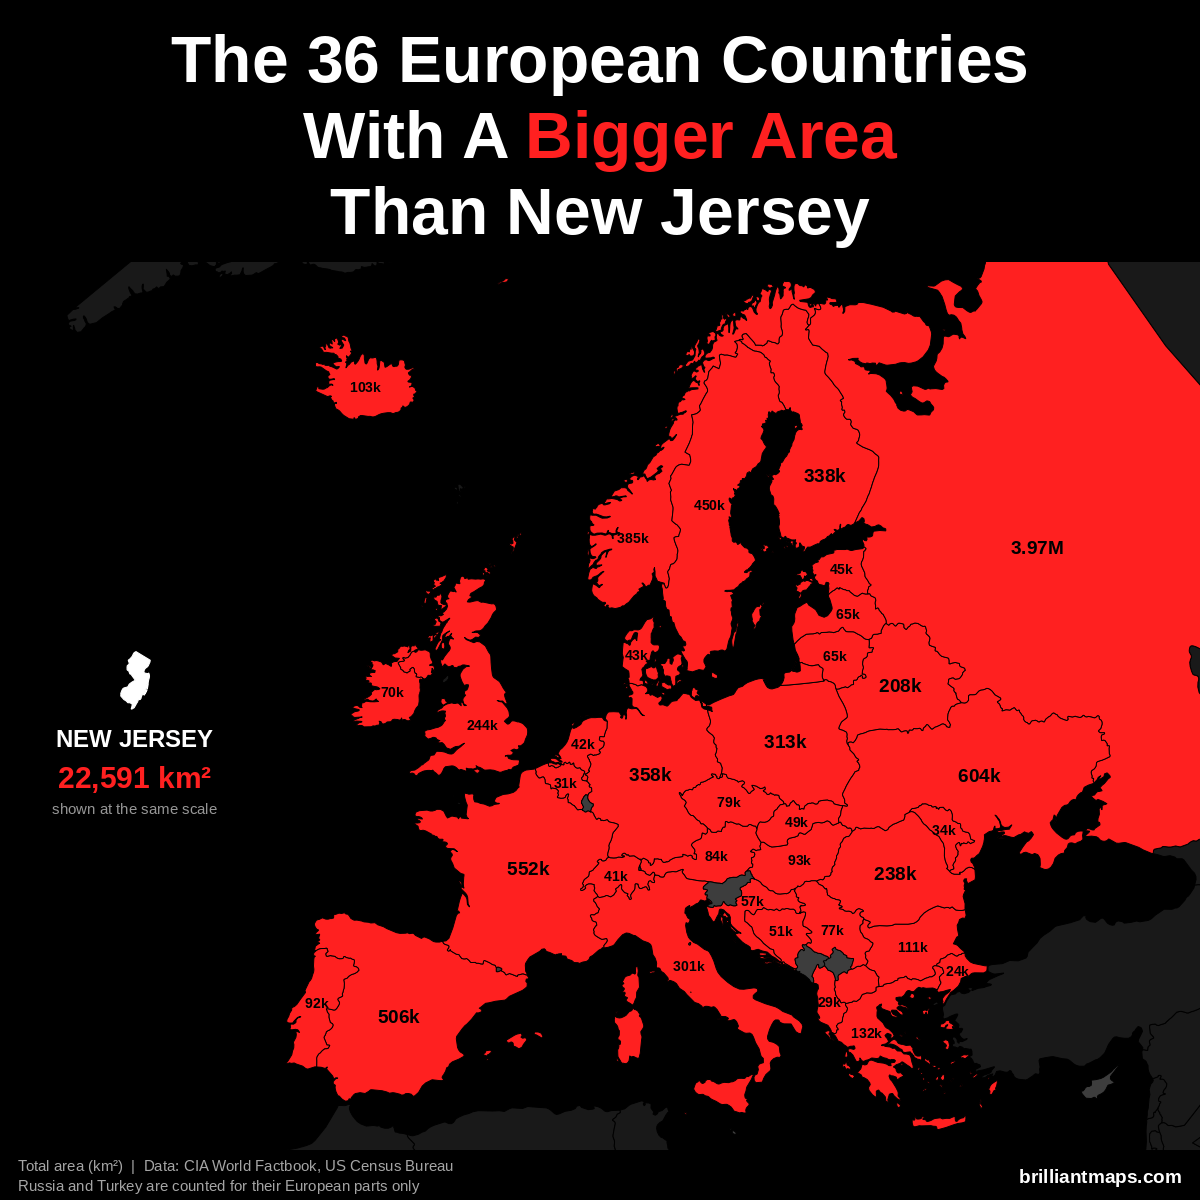
New Jersey has a total area of 22,591 km² (8,722 sq mi). 36 European countries have a bigger area:
- Russia (European part): 3,969,100 km² (1,532,477 sq mi)
- Ukraine: 603,550 km² (233,032 sq mi)
- France: 551,695 km² (213,010 sq mi)
- Spain: 505,990 km² (195,364 sq mi)
- Sweden: 450,295 km² (173,860 sq mi)
- Norway: 385,207 km² (148,729 sq mi)
- Germany: 357,588 km² (138,065 sq mi)
- Finland: 338,455 km² (130,678 sq mi)
- Poland: 312,696 km² (120,733 sq mi)
- Italy: 301,340 km² (116,348 sq mi)
- United Kingdom: 243,610 km² (94,058 sq mi)
- Romania: 238,397 km² (92,046 sq mi)
- Belarus: 207,600 km² (80,155 sq mi)
- Greece: 131,957 km² (50,949 sq mi)
- Bulgaria: 110,994 km² (42,855 sq mi)
- Iceland: 103,000 km² (39,768 sq mi)
- Hungary: 93,028 km² (35,918 sq mi)
- Portugal: 92,212 km² (35,603 sq mi)
- Austria: 83,871 km² (32,383 sq mi)
- Czechia: 78,867 km² (30,451 sq mi)
- Serbia: 77,474 km² (29,913 sq mi)
- Ireland: 70,273 km² (27,133 sq mi)
- Lithuania: 65,300 km² (25,212 sq mi)
- Latvia: 64,589 km² (24,938 sq mi)
- Croatia: 56,594 km² (21,851 sq mi)
- Bosnia and Herzegovina: 51,197 km² (19,767 sq mi)
- Slovakia: 49,035 km² (18,933 sq mi)
- Estonia: 45,339 km² (17,505 sq mi)
- Denmark: 43,094 km² (16,639 sq mi)
- Netherlands: 41,850 km² (16,158 sq mi)
- Switzerland: 41,285 km² (15,940 sq mi)
- Moldova: 33,846 km² (13,068 sq mi)
- Belgium: 30,528 km² (11,787 sq mi)
- Albania: 28,748 km² (11,100 sq mi)
- North Macedonia: 25,713 km² (9,928 sq mi)
- Turkey (European part): 23,764 km² (9,175 sq mi)
New Jersey Vs European Life Expectancy
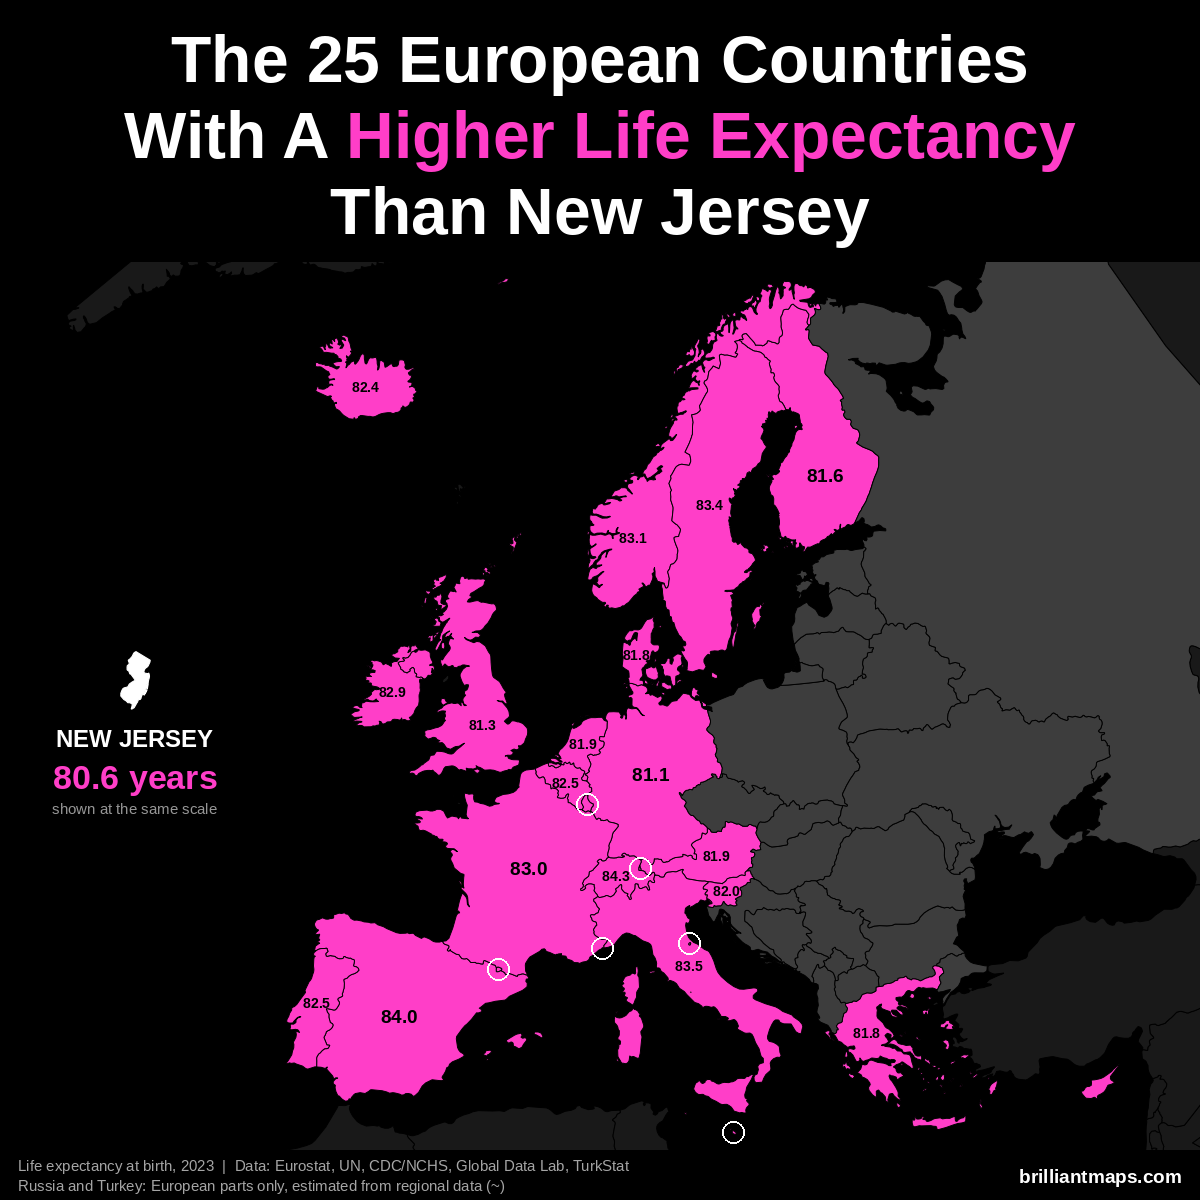
New Jersey has a life expectancy at birth of 80.6 years (2023). 25 European countries have a higher life expectancy:
- Monaco: 86.4 years
- San Marino: 85.7 years
- Liechtenstein: 84.6 years
- Switzerland: 84.3 years
- Andorra: 84.0 years
- Spain: 84.0 years
- Italy: 83.5 years
- Luxembourg: 83.4 years
- Malta: 83.4 years
- Sweden: 83.4 years
- Norway: 83.1 years
- France: 83.0 years
- Cyprus: 82.9 years
- Ireland: 82.9 years
- Belgium: 82.5 years
- Portugal: 82.5 years
- Iceland: 82.4 years
- Slovenia: 82.0 years
- Austria: 81.9 years
- Netherlands: 81.9 years
- Denmark: 81.8 years
- Greece: 81.8 years
- Finland: 81.6 years
- United Kingdom: 81.3 years
- Germany: 81.1 years
New Mexico vs Europe
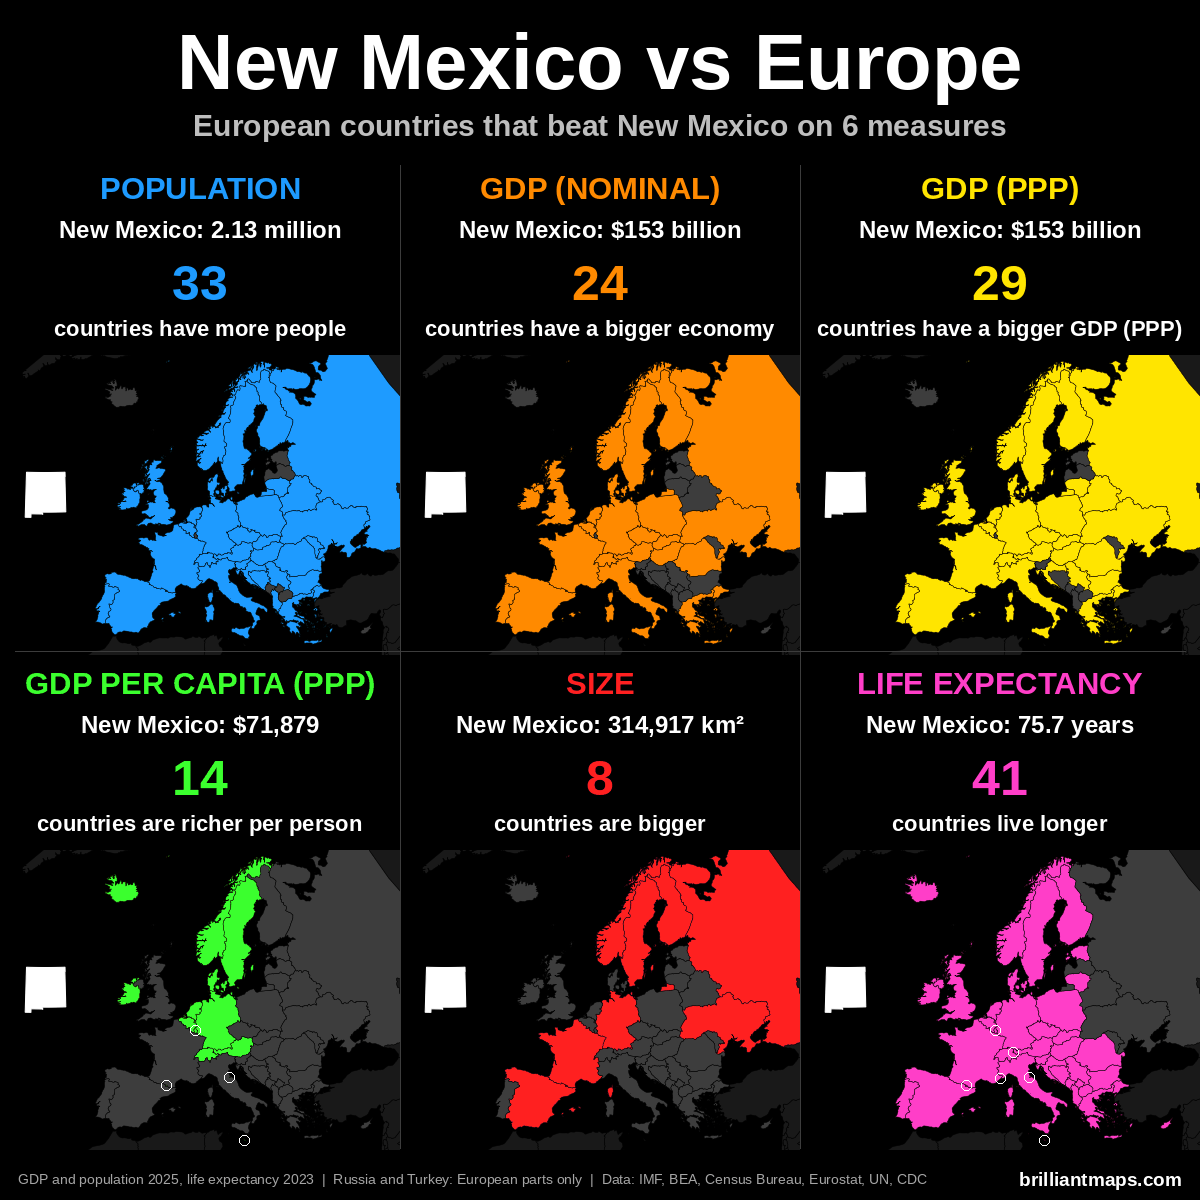
New Mexico Vs European Population
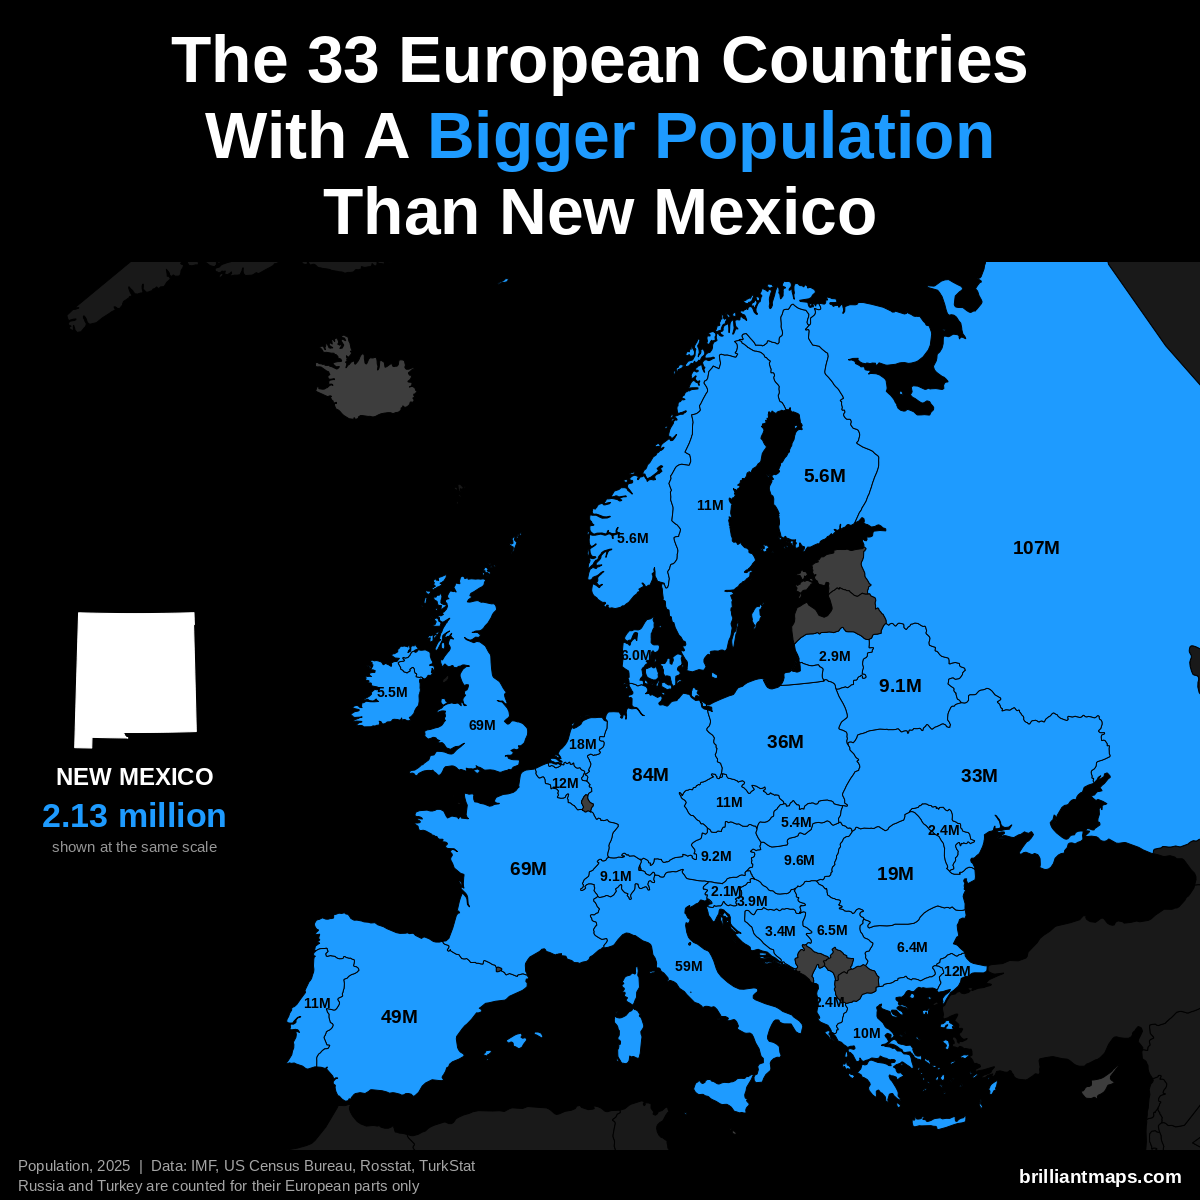
New Mexico has a population of 2.1 million (2025). 33 European countries have a bigger population:
- Russia (European part): 107.0 million
- Germany: 83.5 million
- United Kingdom: 69.5 million
- France: 68.9 million
- Italy: 58.9 million
- Spain: 49.5 million
- Poland: 36.5 million
- Ukraine: 32.9 million
- Romania: 19.0 million
- Netherlands: 18.0 million
- Turkey (European part): 12.2 million
- Belgium: 11.9 million
- Portugal: 10.8 million
- Czechia: 10.8 million
- Sweden: 10.7 million
- Greece: 10.4 million
- Hungary: 9.6 million
- Austria: 9.2 million
- Belarus: 9.1 million
- Switzerland: 9.1 million
- Serbia: 6.5 million
- Bulgaria: 6.4 million
- Denmark: 6.0 million
- Norway: 5.6 million
- Finland: 5.6 million
- Ireland: 5.5 million
- Slovakia: 5.4 million
- Croatia: 3.9 million
- Bosnia and Herzegovina: 3.4 million
- Lithuania: 2.9 million
- Moldova: 2.4 million
- Albania: 2.4 million
- Slovenia: 2.1 million
New Mexico Vs European GDP (Nominal)
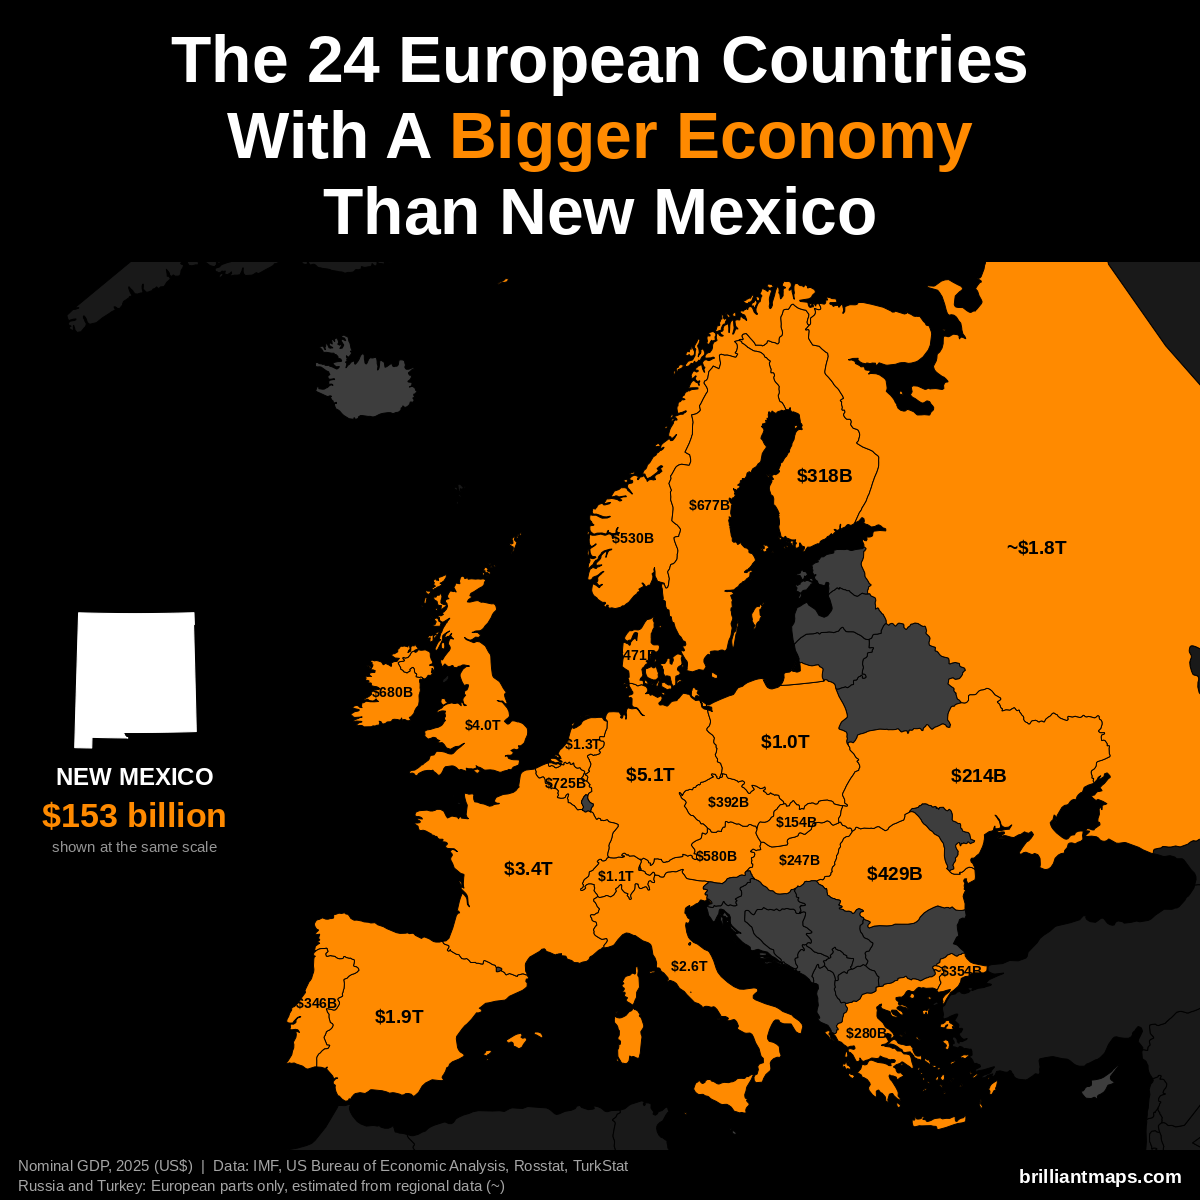
New Mexico has a nominal GDP of $153 billion (2025). 24 European countries have a bigger economy:
- Germany: $5.12 trillion
- United Kingdom: $4.01 trillion
- France: $3.38 trillion
- Italy: $2.55 trillion
- Spain: $1.91 trillion
- Russia (European part): ~$1.83 trillion
- Netherlands: $1.32 trillion
- Switzerland: $1.06 trillion
- Poland: $1.04 trillion
- Belgium: $725 billion
- Ireland: $680 billion
- Sweden: $677 billion
- Austria: $580 billion
- Norway: $530 billion
- Denmark: $471 billion
- Romania: $429 billion
- Czechia: $392 billion
- Turkey (European part): ~$354 billion
- Portugal: $346 billion
- Finland: $318 billion
- Greece: $280 billion
- Hungary: $247 billion
- Ukraine: $214 billion
- Slovakia: $154 billion
New Mexico Vs European GDP (PPP)
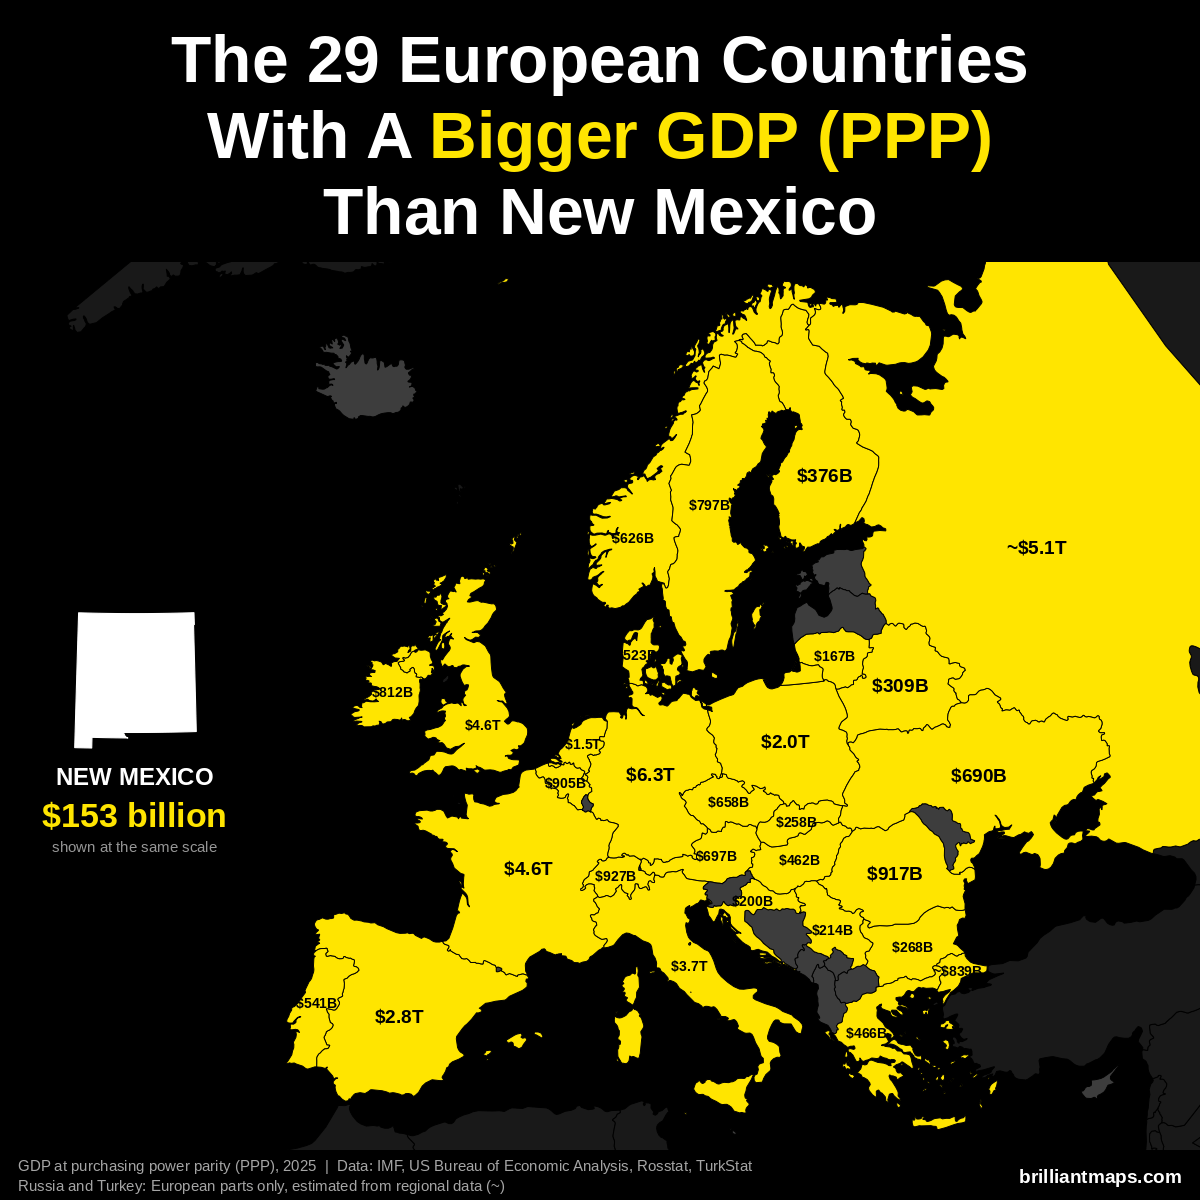
New Mexico has a GDP of $153 billion (2025). US states are already measured in the dollars PPP is based on, so the figure is the same as nominal GDP. 29 European countries have a bigger GDP at purchasing power parity:
- Germany: $6.26 trillion
- Russia (European part): ~$5.14 trillion
- France: $4.58 trillion
- United Kingdom: $4.57 trillion
- Italy: $3.74 trillion
- Spain: $2.83 trillion
- Poland: $2.04 trillion
- Netherlands: $1.52 trillion
- Switzerland: $927 billion
- Romania: $917 billion
- Belgium: $905 billion
- Turkey (European part): ~$839 billion
- Ireland: $812 billion
- Sweden: $797 billion
- Austria: $697 billion
- Ukraine: $690 billion
- Czechia: $658 billion
- Norway: $626 billion
- Portugal: $541 billion
- Denmark: $523 billion
- Greece: $466 billion
- Hungary: $462 billion
- Finland: $376 billion
- Belarus: $309 billion
- Bulgaria: $268 billion
- Slovakia: $258 billion
- Serbia: $214 billion
- Croatia: $200 billion
- Lithuania: $167 billion
New Mexico Vs European GDP Per Capita (PPP)
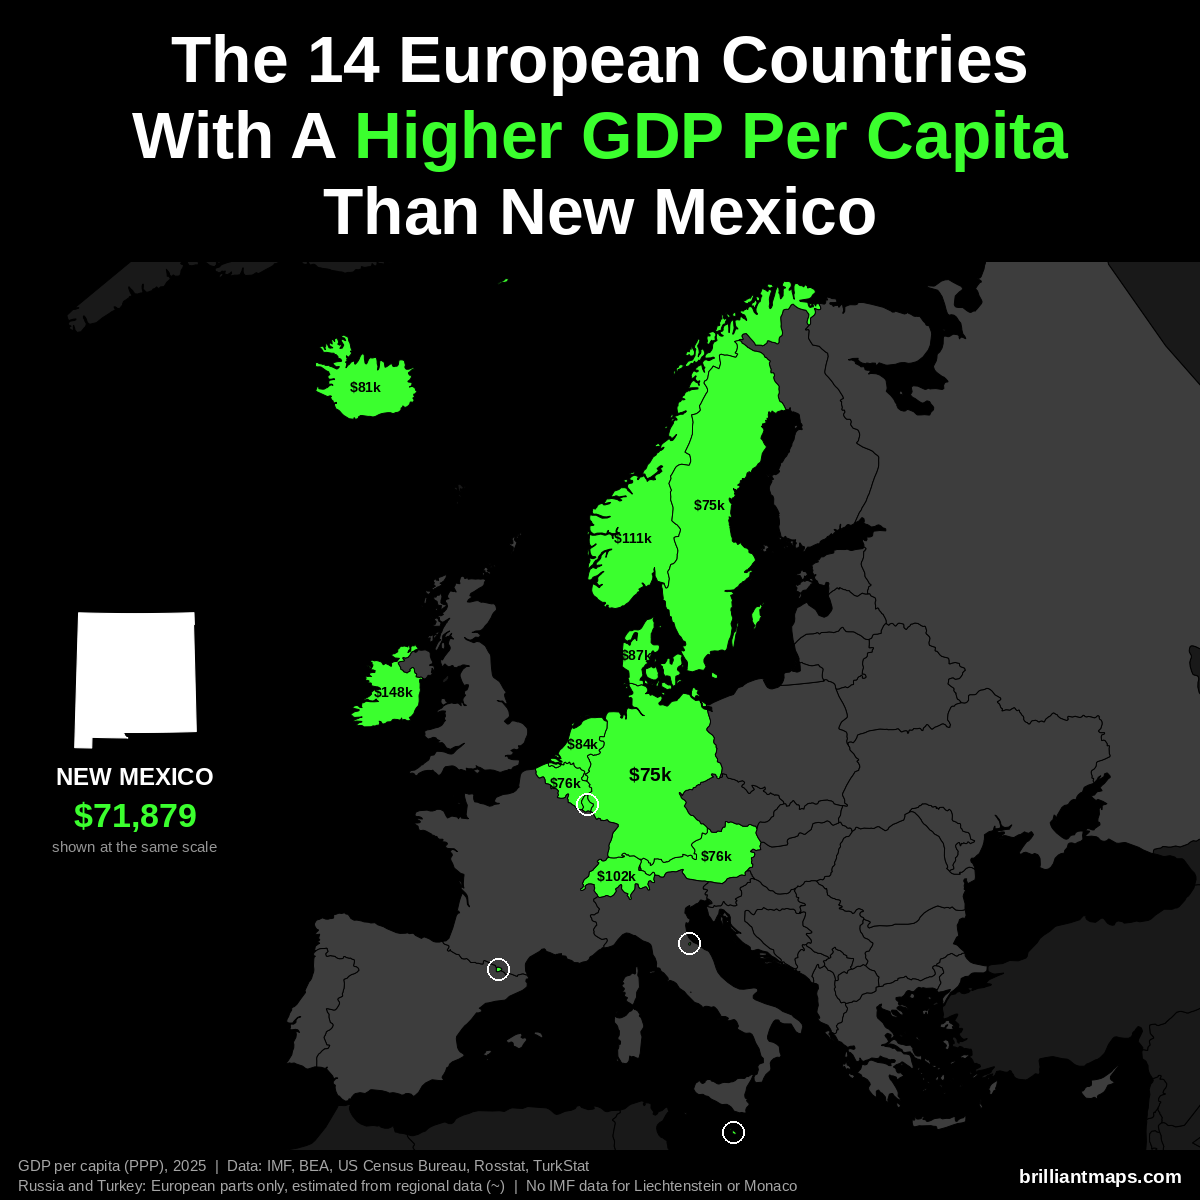
New Mexico has a GDP per capita of $71,879 (2025). 14 European countries have a higher GDP per capita at purchasing power parity:
- Luxembourg: $152,894
- Ireland: $147,825
- Norway: $111,462
- Switzerland: $102,397
- Denmark: $87,303
- Netherlands: $84,445
- San Marino: $83,838
- Iceland: $80,915
- Belgium: $76,136
- Austria: $75,965
- Malta: $75,687
- Germany: $74,901
- Sweden: $74,651
- Andorra: $74,059
Liechtenstein and Monaco are not covered by the IMF data and are not counted here.
New Mexico Vs European Size
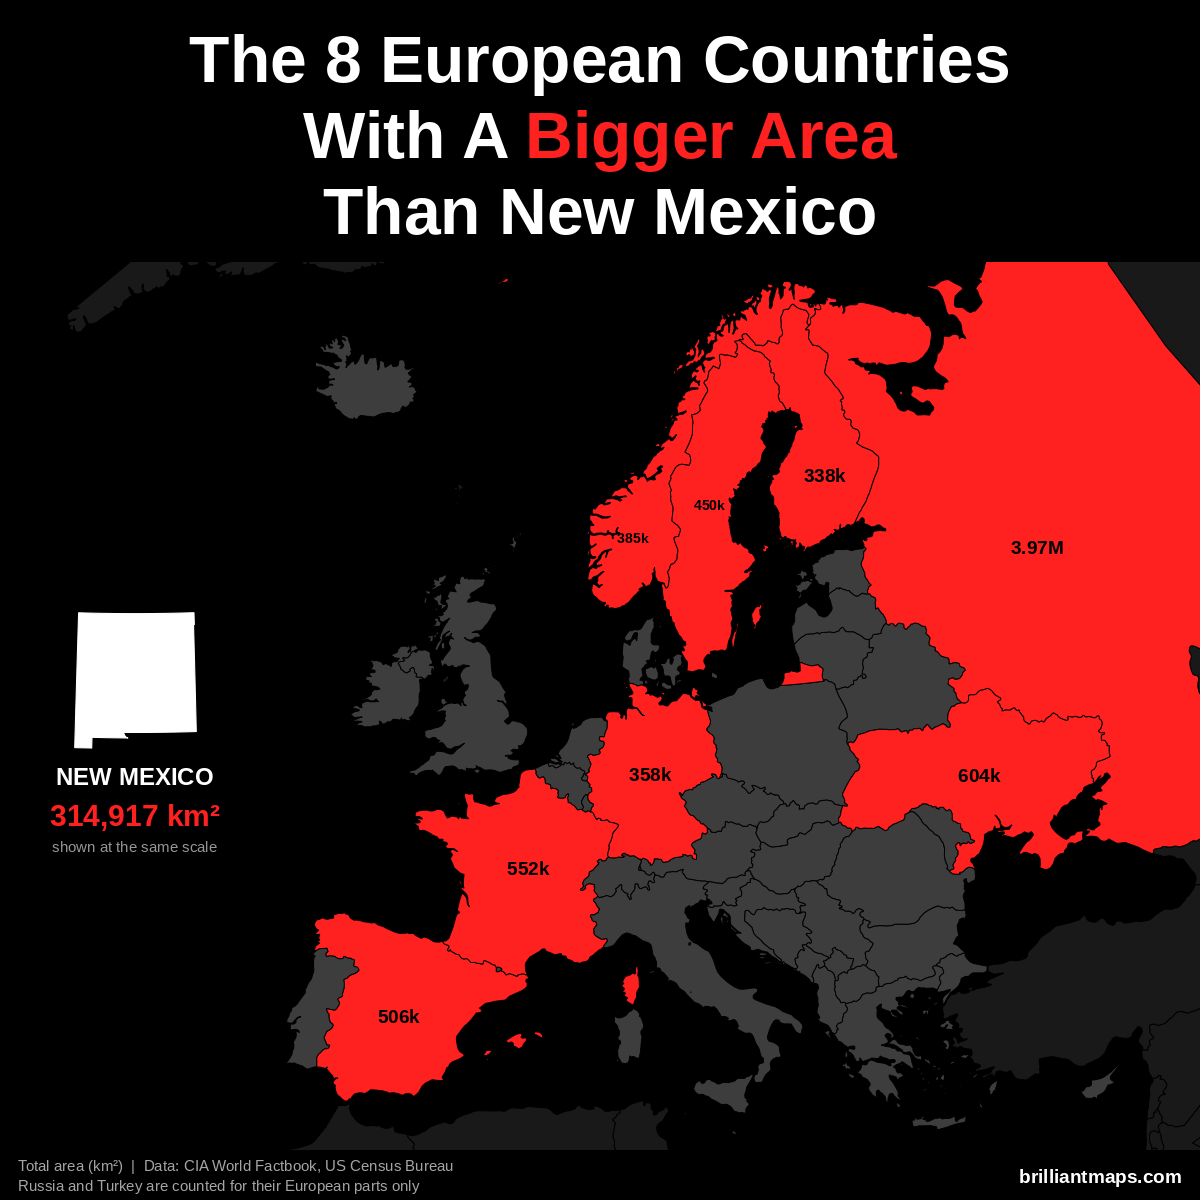
New Mexico has a total area of 314,917 km² (121,590 sq mi). 8 European countries have a bigger area:
- Russia (European part): 3,969,100 km² (1,532,477 sq mi)
- Ukraine: 603,550 km² (233,032 sq mi)
- France: 551,695 km² (213,010 sq mi)
- Spain: 505,990 km² (195,364 sq mi)
- Sweden: 450,295 km² (173,860 sq mi)
- Norway: 385,207 km² (148,729 sq mi)
- Germany: 357,588 km² (138,065 sq mi)
- Finland: 338,455 km² (130,678 sq mi)
New Mexico Vs European Life Expectancy
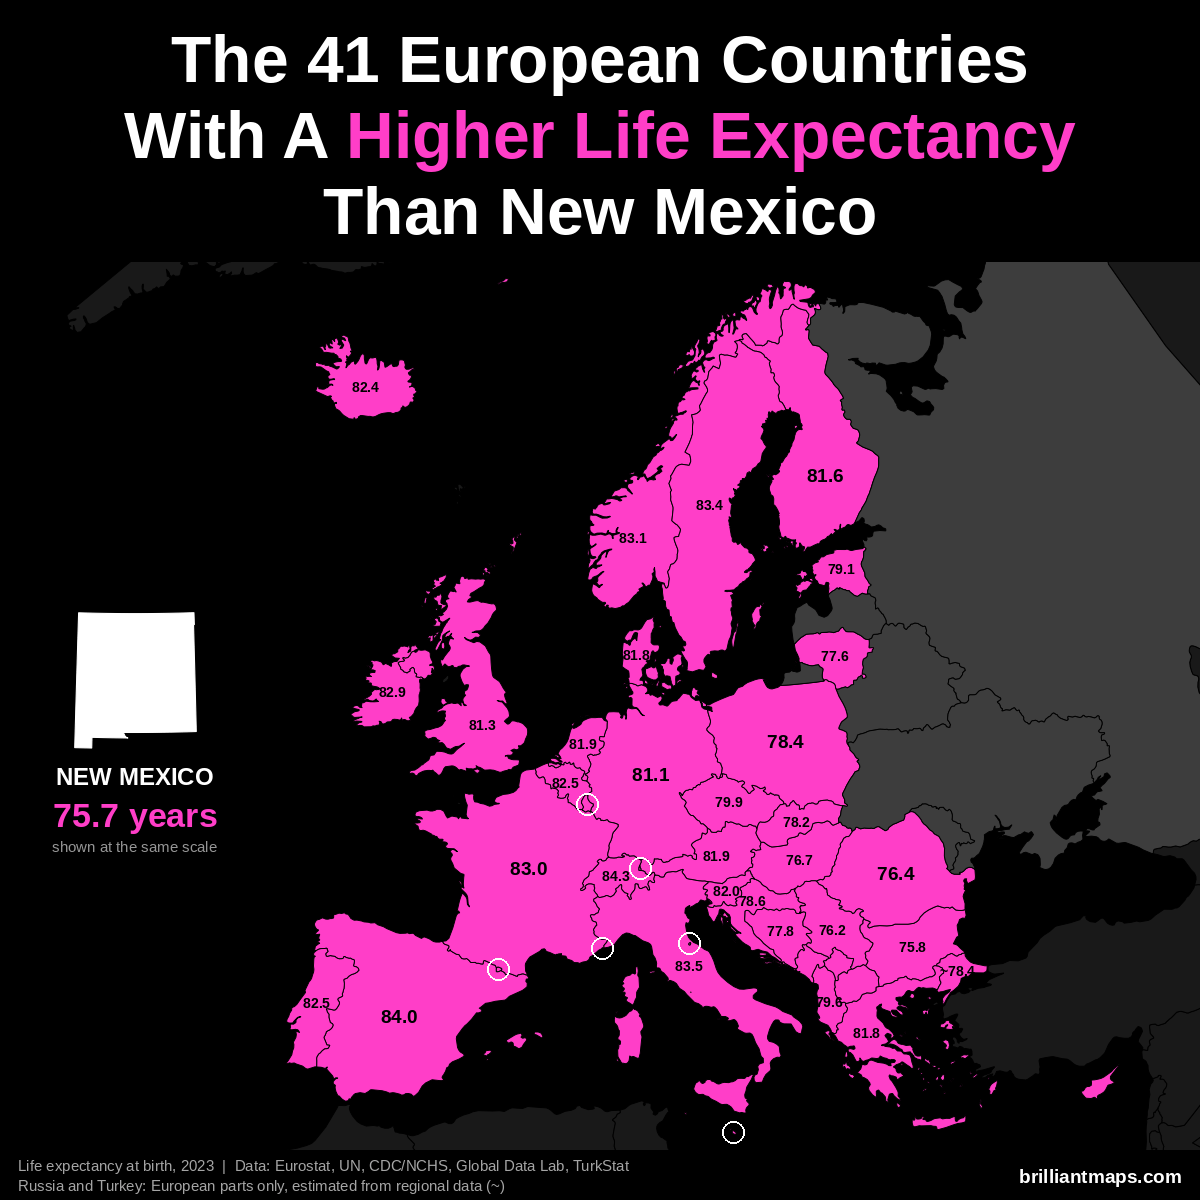
New Mexico has a life expectancy at birth of 75.7 years (2023). 41 European countries have a higher life expectancy:
- Monaco: 86.4 years
- San Marino: 85.7 years
- Liechtenstein: 84.6 years
- Switzerland: 84.3 years
- Andorra: 84.0 years
- Spain: 84.0 years
- Italy: 83.5 years
- Luxembourg: 83.4 years
- Malta: 83.4 years
- Sweden: 83.4 years
- Norway: 83.1 years
- France: 83.0 years
- Cyprus: 82.9 years
- Ireland: 82.9 years
- Belgium: 82.5 years
- Portugal: 82.5 years
- Iceland: 82.4 years
- Slovenia: 82.0 years
- Austria: 81.9 years
- Netherlands: 81.9 years
- Denmark: 81.8 years
- Greece: 81.8 years
- Finland: 81.6 years
- United Kingdom: 81.3 years
- Germany: 81.1 years
- Czechia: 79.9 years
- Albania: 79.6 years
- Estonia: 79.1 years
- Croatia: 78.6 years
- Poland: 78.4 years
- Turkey (European part): ~78.4 years
- Slovakia: 78.2 years
- Kosovo: 78.0 years
- Bosnia and Herzegovina: 77.8 years
- Lithuania: 77.6 years
- Montenegro: 77.6 years
- North Macedonia: 77.4 years
- Hungary: 76.7 years
- Romania: 76.4 years
- Serbia: 76.2 years
- Bulgaria: 75.8 years
New York vs Europe
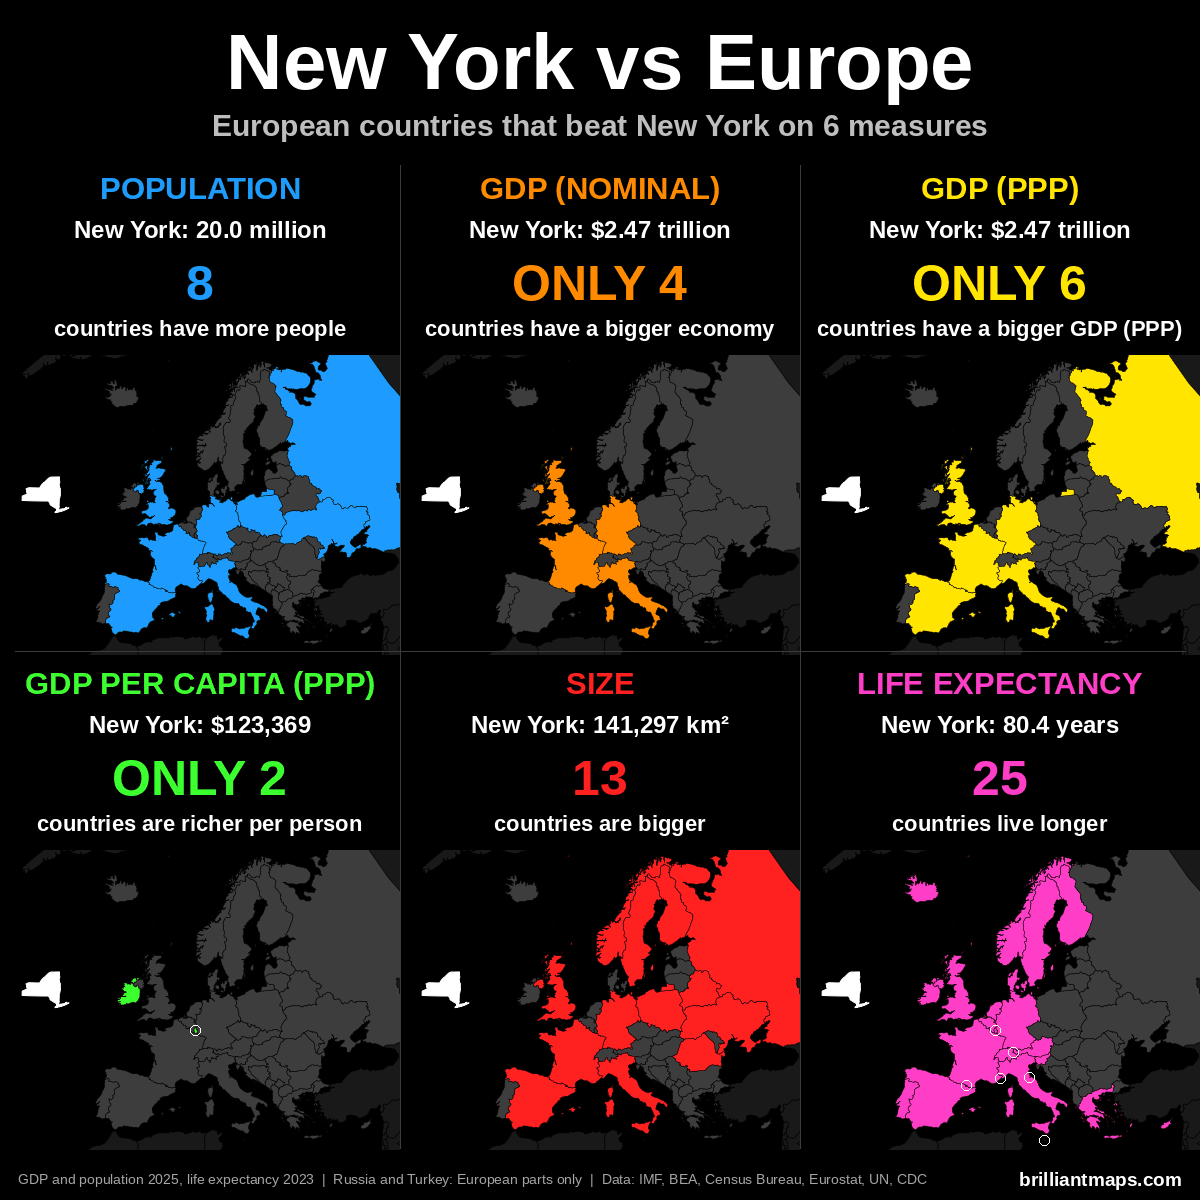
New York Vs European Population
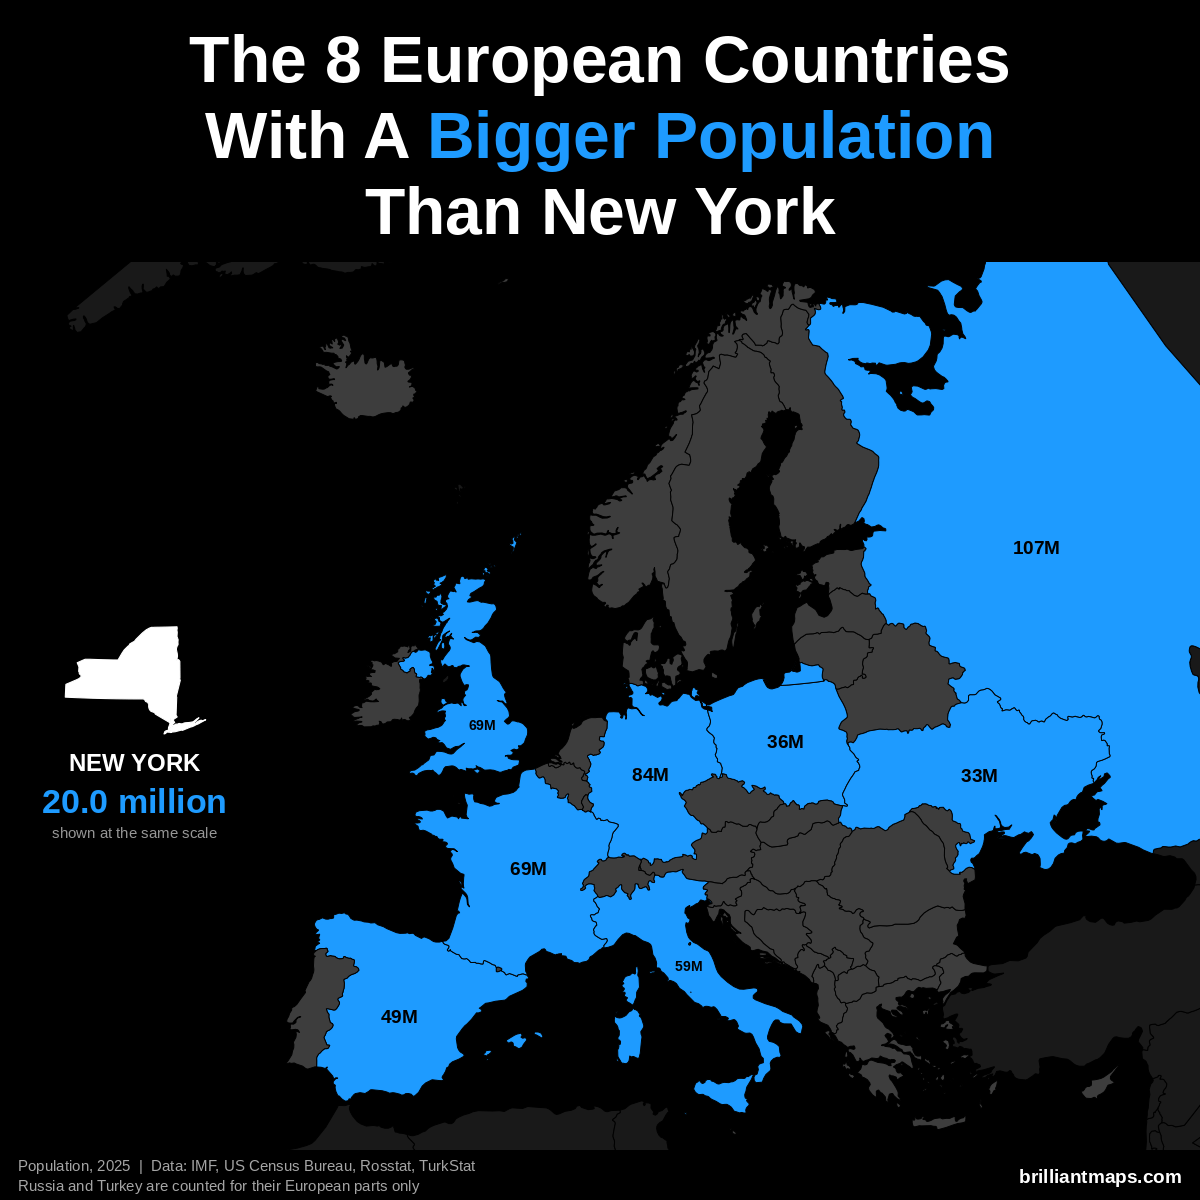
New York has a population of 20.0 million (2025). 8 European countries have a bigger population:
- Russia (European part): 107.0 million
- Germany: 83.5 million
- United Kingdom: 69.5 million
- France: 68.9 million
- Italy: 58.9 million
- Spain: 49.5 million
- Poland: 36.5 million
- Ukraine: 32.9 million
New York Vs European GDP (Nominal)
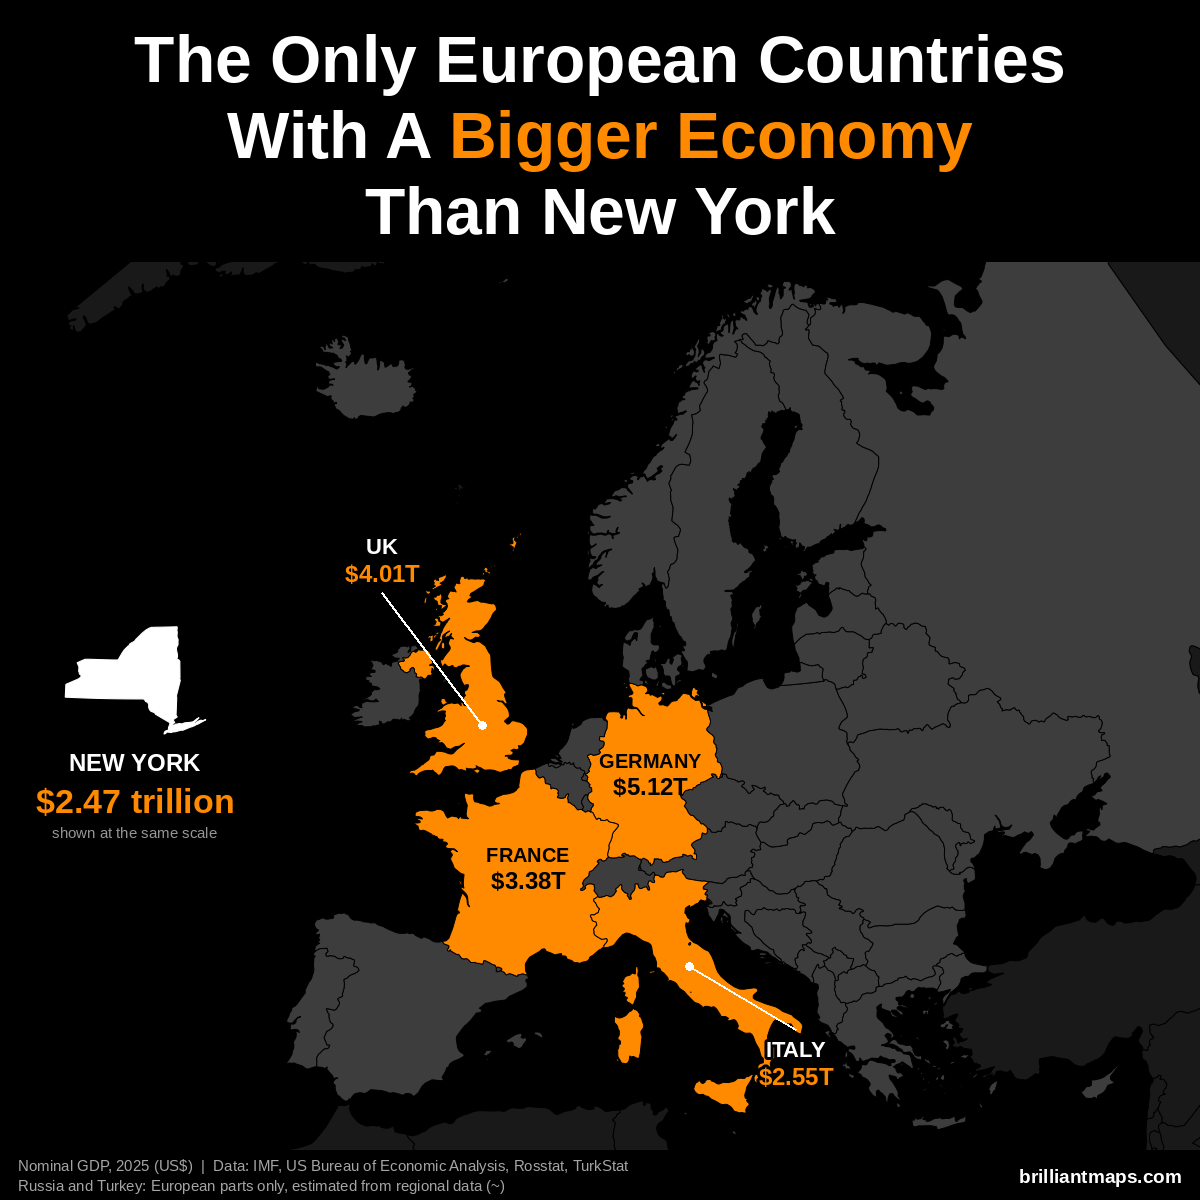
New York has a nominal GDP of $2.47 trillion (2025). Only 4 European countries have a bigger economy:
- Germany: $5.12 trillion
- United Kingdom: $4.01 trillion
- France: $3.38 trillion
- Italy: $2.55 trillion
New York Vs European GDP (PPP)
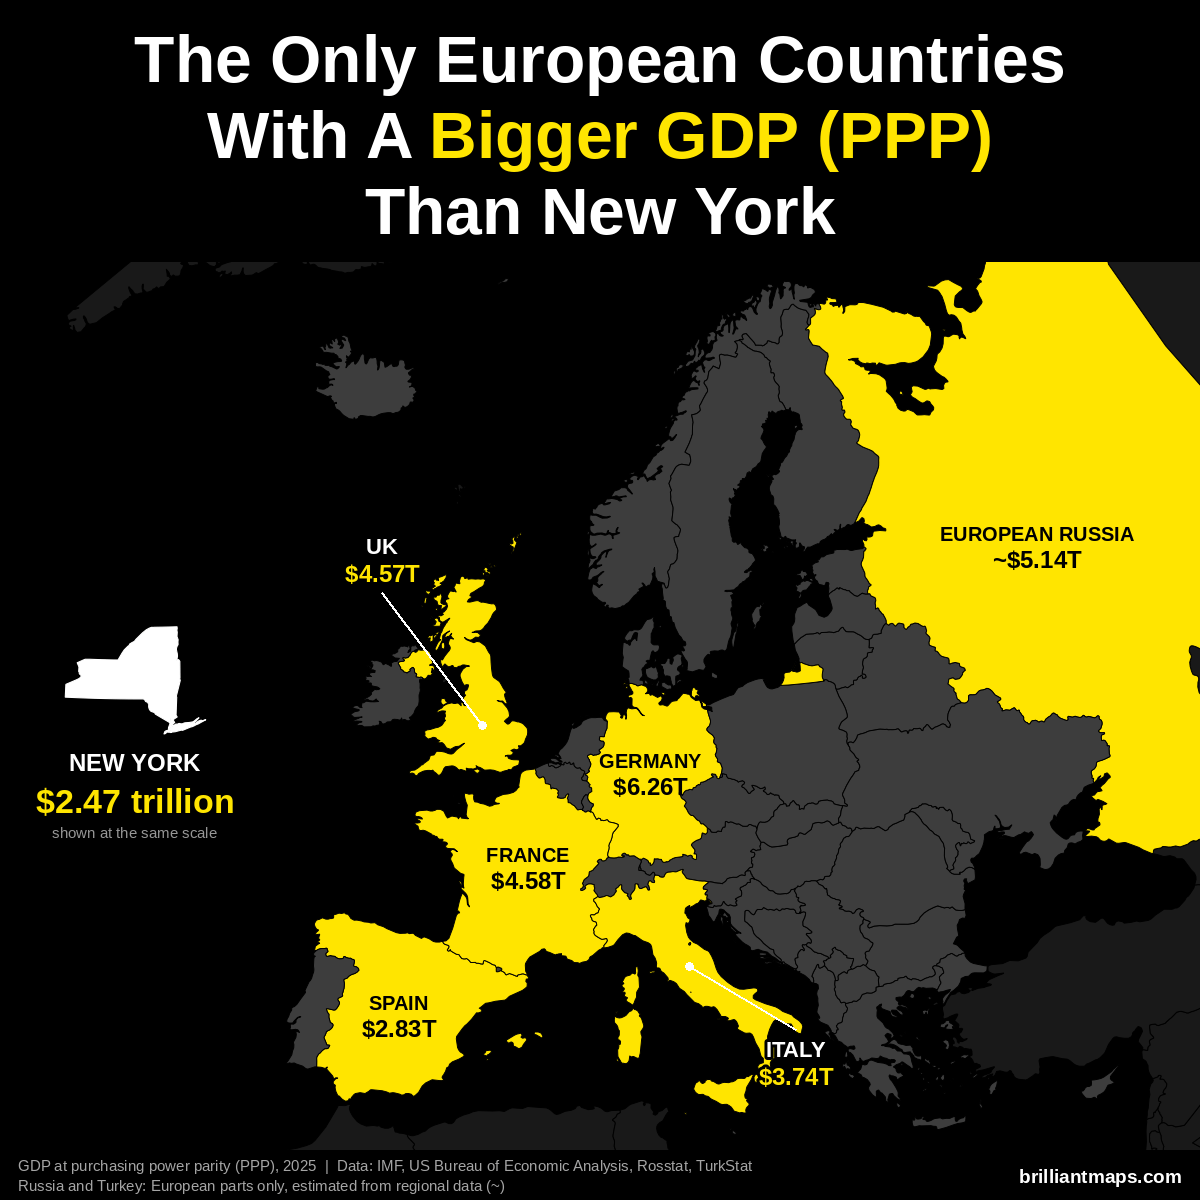
New York has a GDP of $2.47 trillion (2025). US states are already measured in the dollars PPP is based on, so the figure is the same as nominal GDP. Only 6 European countries have a bigger GDP at purchasing power parity:
- Germany: $6.26 trillion
- Russia (European part): ~$5.14 trillion
- France: $4.58 trillion
- United Kingdom: $4.57 trillion
- Italy: $3.74 trillion
- Spain: $2.83 trillion
New York Vs European GDP Per Capita (PPP)
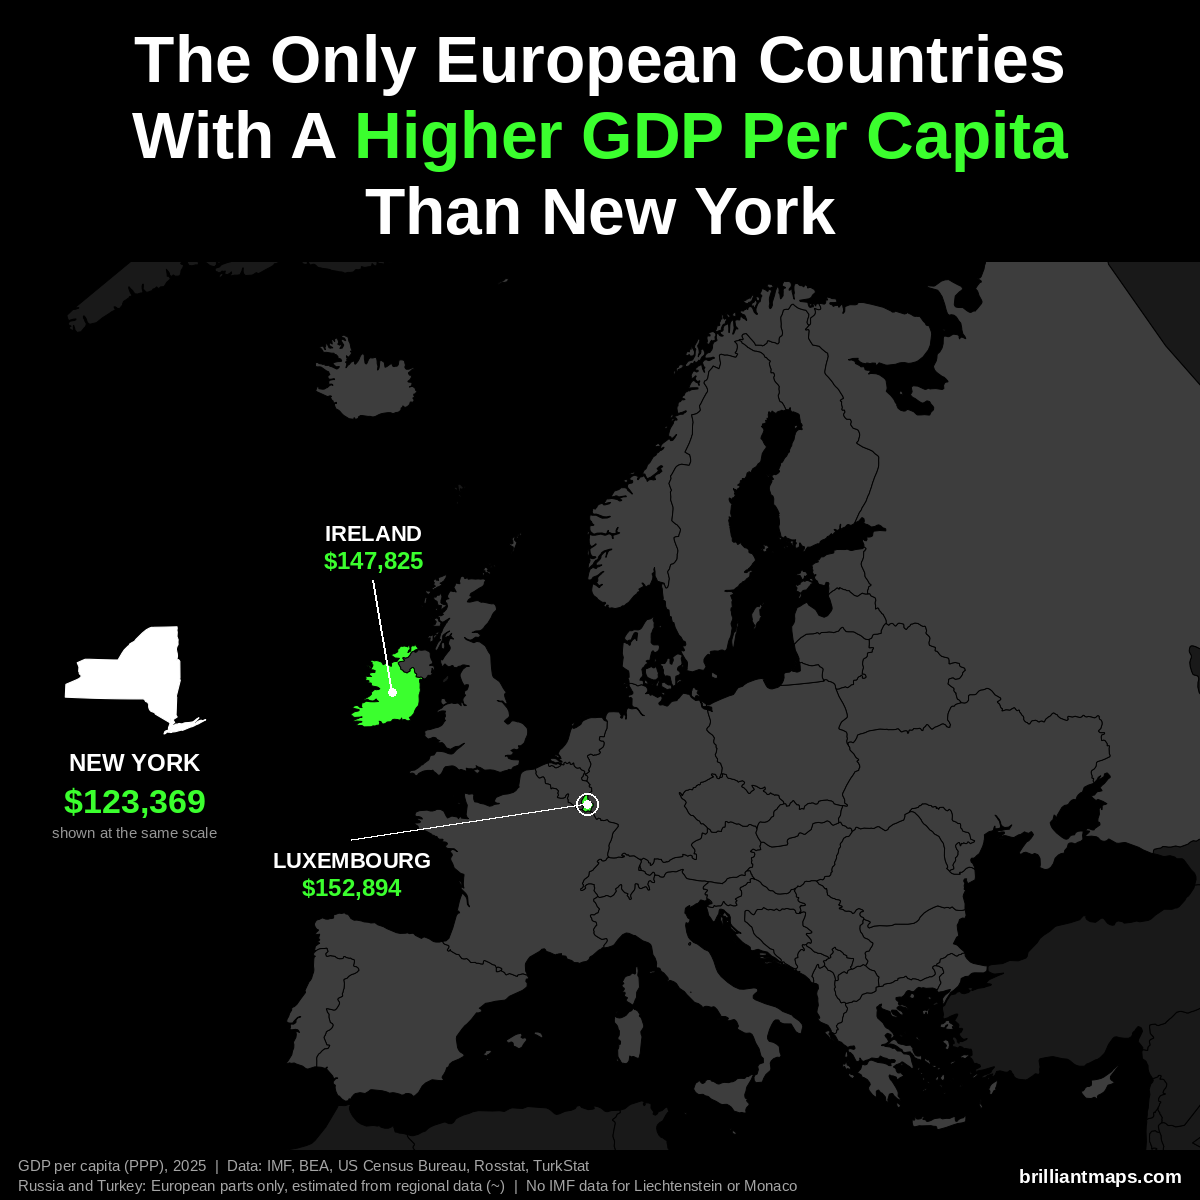
New York has a GDP per capita of $123,369 (2025). Only 2 European countries have a higher GDP per capita at purchasing power parity:
- Luxembourg: $152,894
- Ireland: $147,825
Liechtenstein and Monaco are not covered by the IMF data and are not counted here.
New York Vs European Size
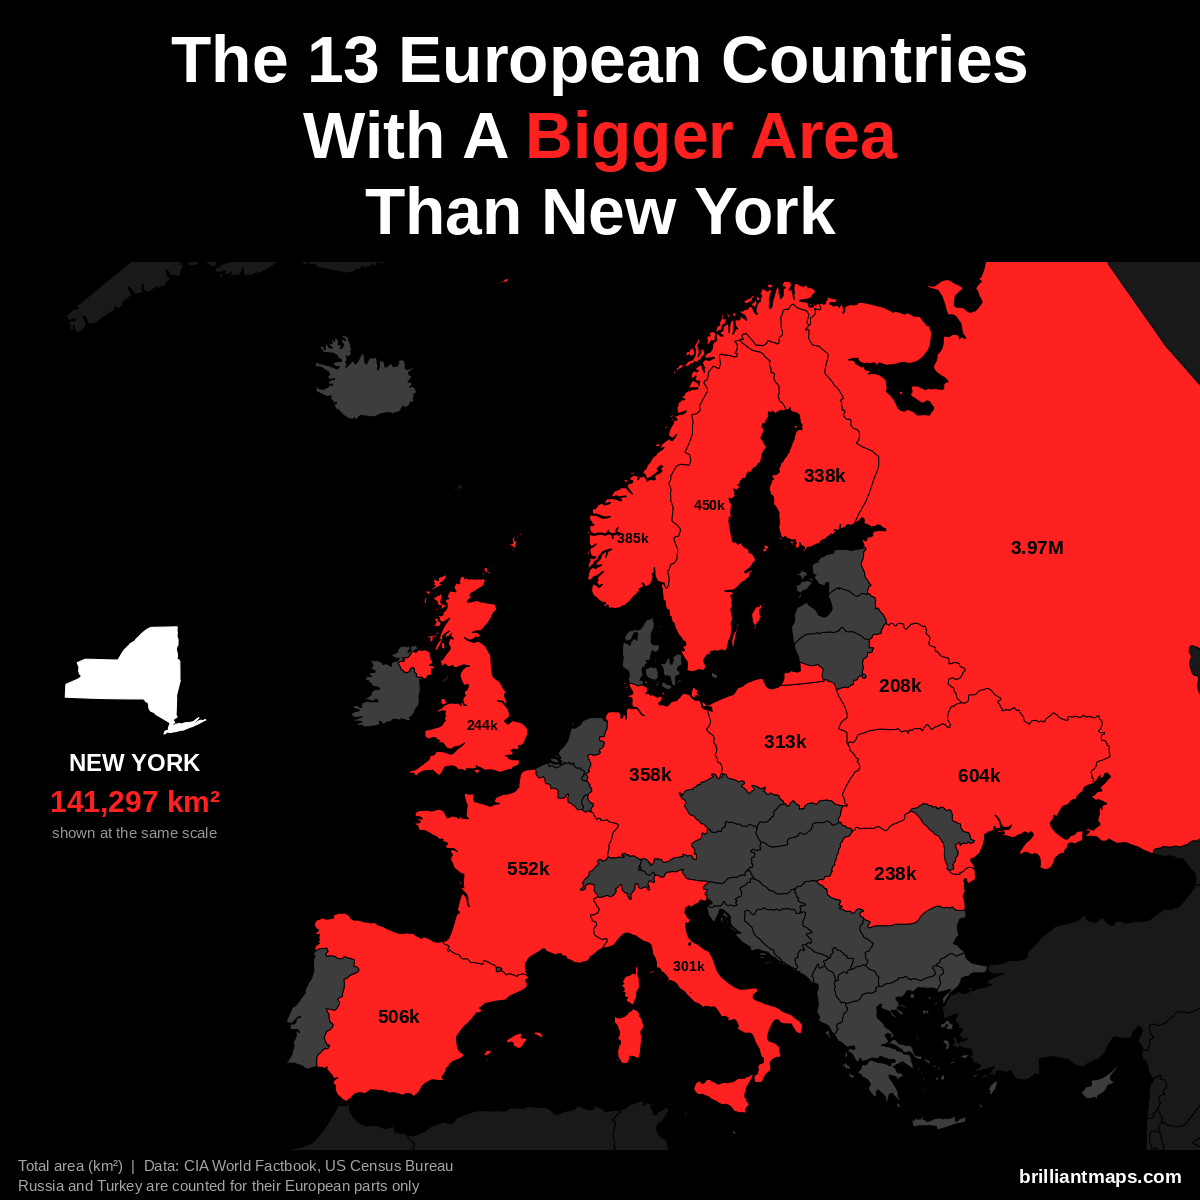
New York has a total area of 141,297 km² (54,555 sq mi). 13 European countries have a bigger area:
- Russia (European part): 3,969,100 km² (1,532,477 sq mi)
- Ukraine: 603,550 km² (233,032 sq mi)
- France: 551,695 km² (213,010 sq mi)
- Spain: 505,990 km² (195,364 sq mi)
- Sweden: 450,295 km² (173,860 sq mi)
- Norway: 385,207 km² (148,729 sq mi)
- Germany: 357,588 km² (138,065 sq mi)
- Finland: 338,455 km² (130,678 sq mi)
- Poland: 312,696 km² (120,733 sq mi)
- Italy: 301,340 km² (116,348 sq mi)
- United Kingdom: 243,610 km² (94,058 sq mi)
- Romania: 238,397 km² (92,046 sq mi)
- Belarus: 207,600 km² (80,155 sq mi)
New York Vs European Life Expectancy
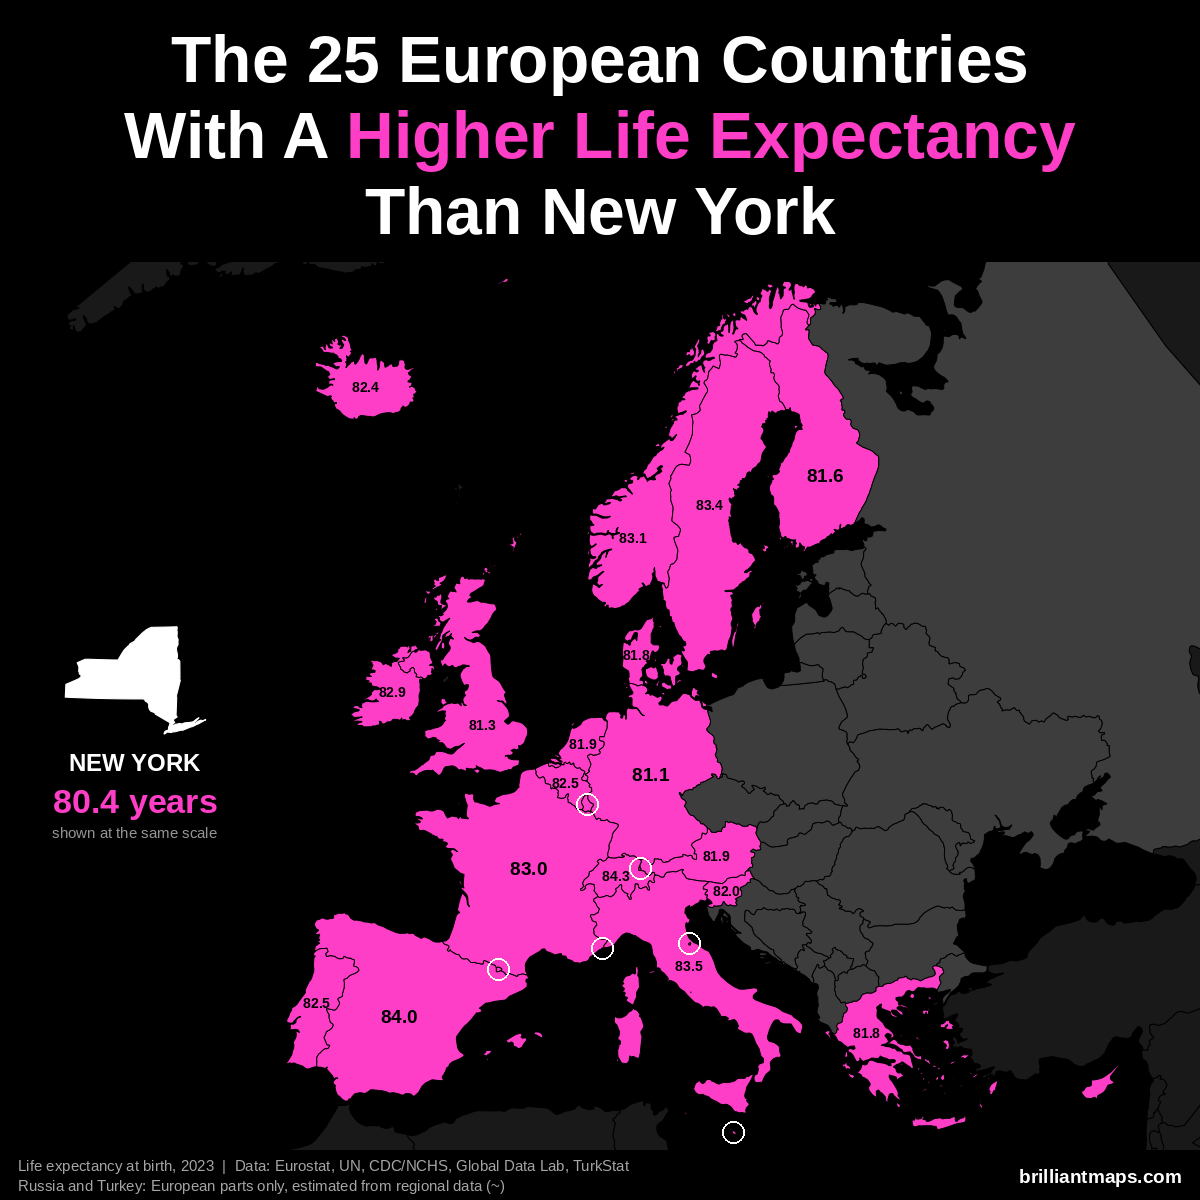
New York has a life expectancy at birth of 80.4 years (2023). 25 European countries have a higher life expectancy:
- Monaco: 86.4 years
- San Marino: 85.7 years
- Liechtenstein: 84.6 years
- Switzerland: 84.3 years
- Andorra: 84.0 years
- Spain: 84.0 years
- Italy: 83.5 years
- Luxembourg: 83.4 years
- Malta: 83.4 years
- Sweden: 83.4 years
- Norway: 83.1 years
- France: 83.0 years
- Cyprus: 82.9 years
- Ireland: 82.9 years
- Belgium: 82.5 years
- Portugal: 82.5 years
- Iceland: 82.4 years
- Slovenia: 82.0 years
- Austria: 81.9 years
- Netherlands: 81.9 years
- Denmark: 81.8 years
- Greece: 81.8 years
- Finland: 81.6 years
- United Kingdom: 81.3 years
- Germany: 81.1 years
North Carolina vs Europe
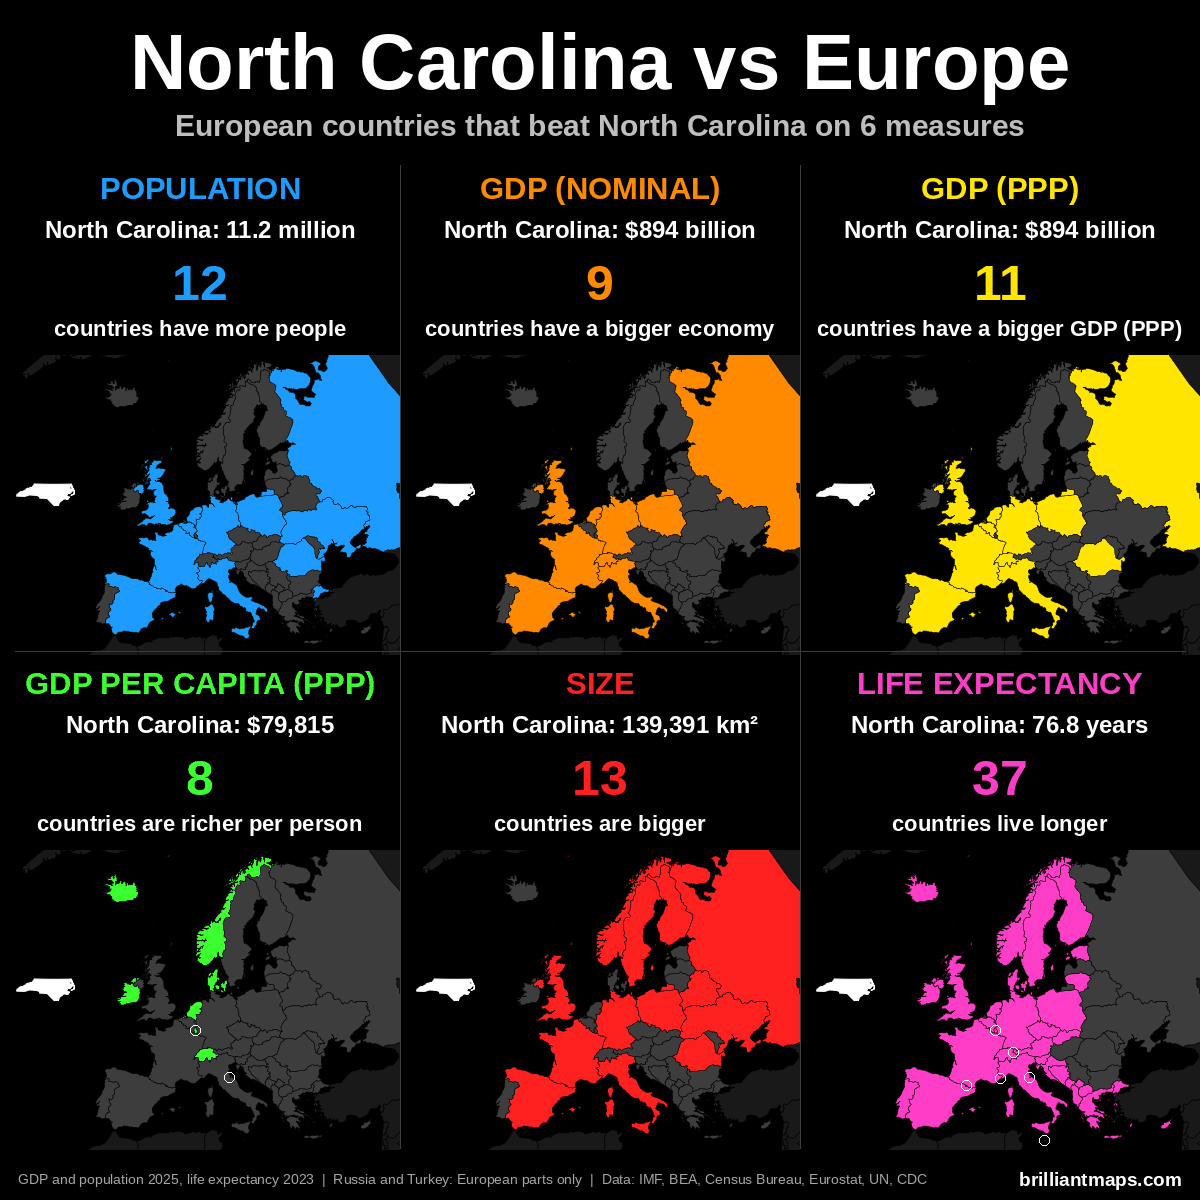
North Carolina Vs European Population
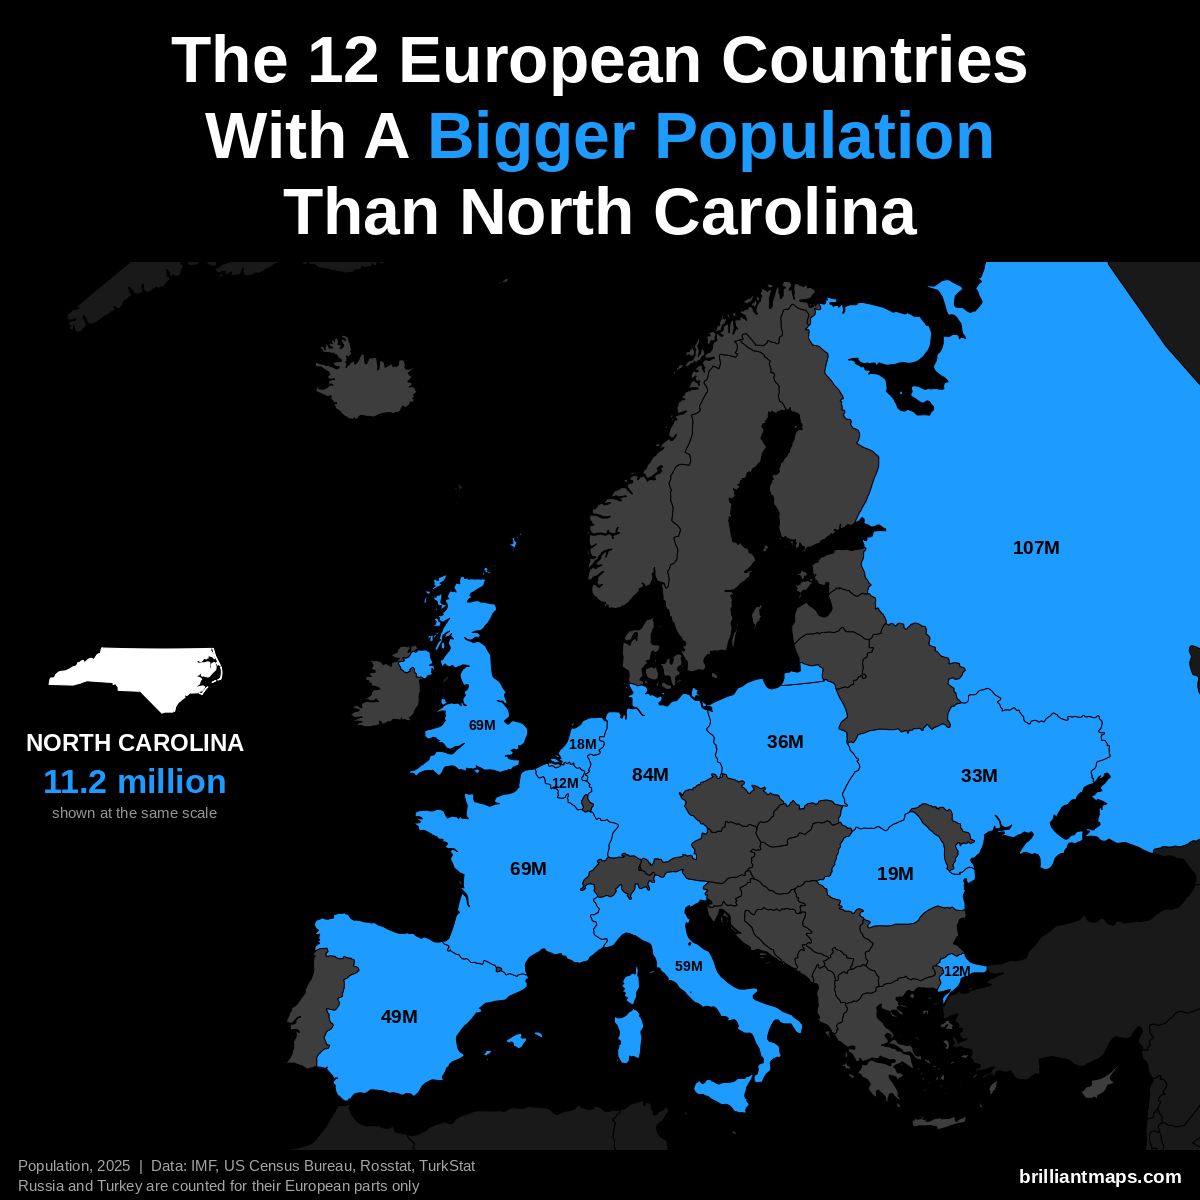
North Carolina has a population of 11.2 million (2025). 12 European countries have a bigger population:
- Russia (European part): 107.0 million
- Germany: 83.5 million
- United Kingdom: 69.5 million
- France: 68.9 million
- Italy: 58.9 million
- Spain: 49.5 million
- Poland: 36.5 million
- Ukraine: 32.9 million
- Romania: 19.0 million
- Netherlands: 18.0 million
- Turkey (European part): 12.2 million
- Belgium: 11.9 million
North Carolina Vs European GDP (Nominal)
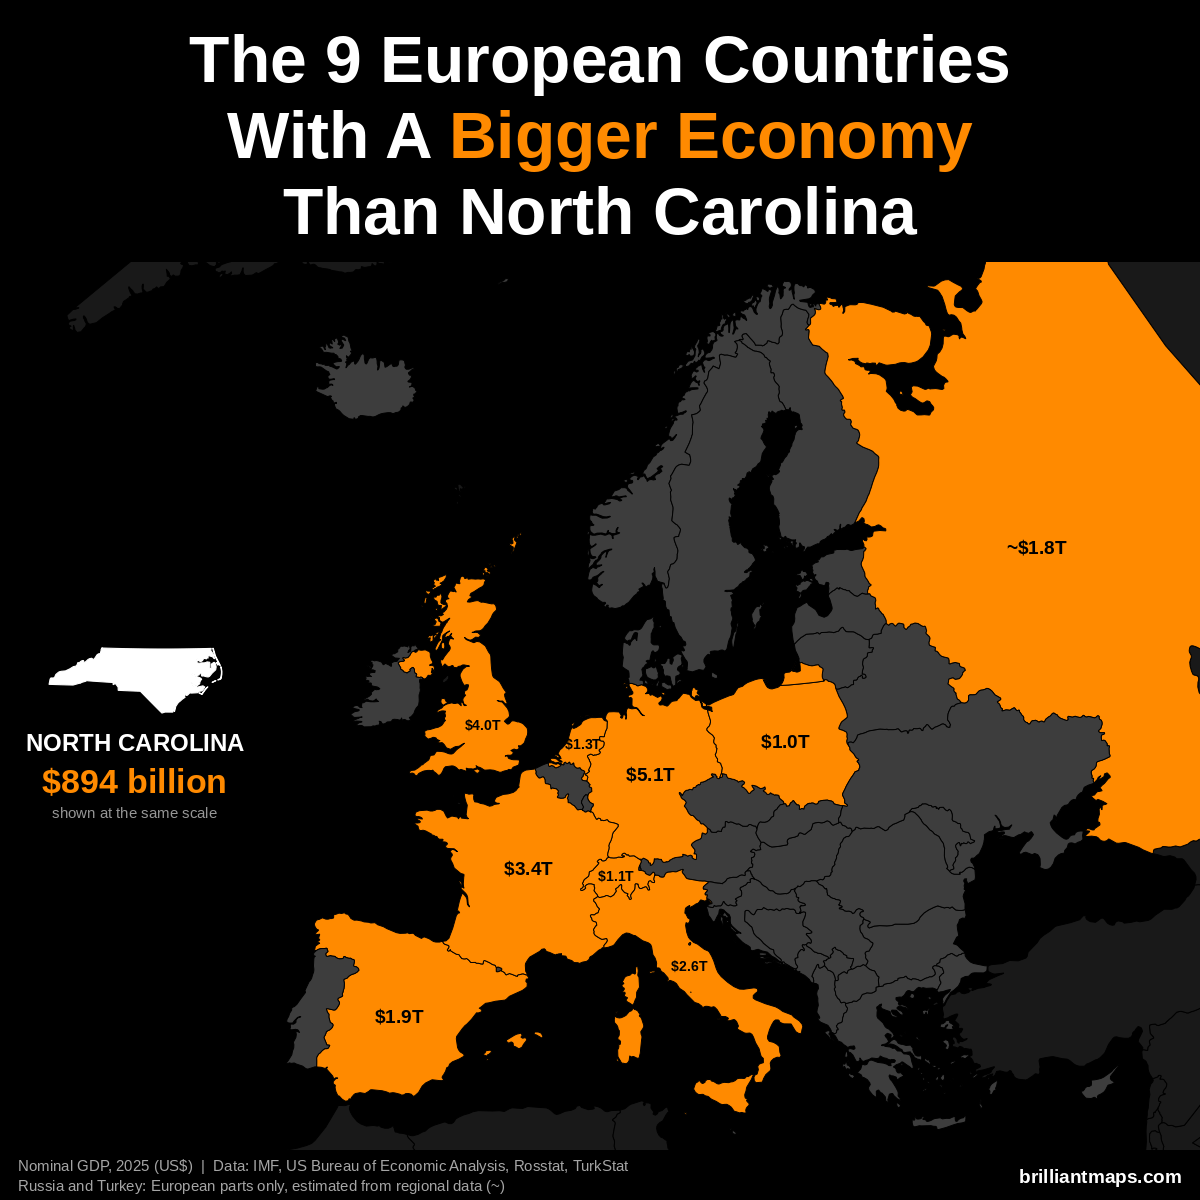
North Carolina has a nominal GDP of $894 billion (2025). 9 European countries have a bigger economy:
- Germany: $5.12 trillion
- United Kingdom: $4.01 trillion
- France: $3.38 trillion
- Italy: $2.55 trillion
- Spain: $1.91 trillion
- Russia (European part): ~$1.83 trillion
- Netherlands: $1.32 trillion
- Switzerland: $1.06 trillion
- Poland: $1.04 trillion
North Carolina Vs European GDP (PPP)
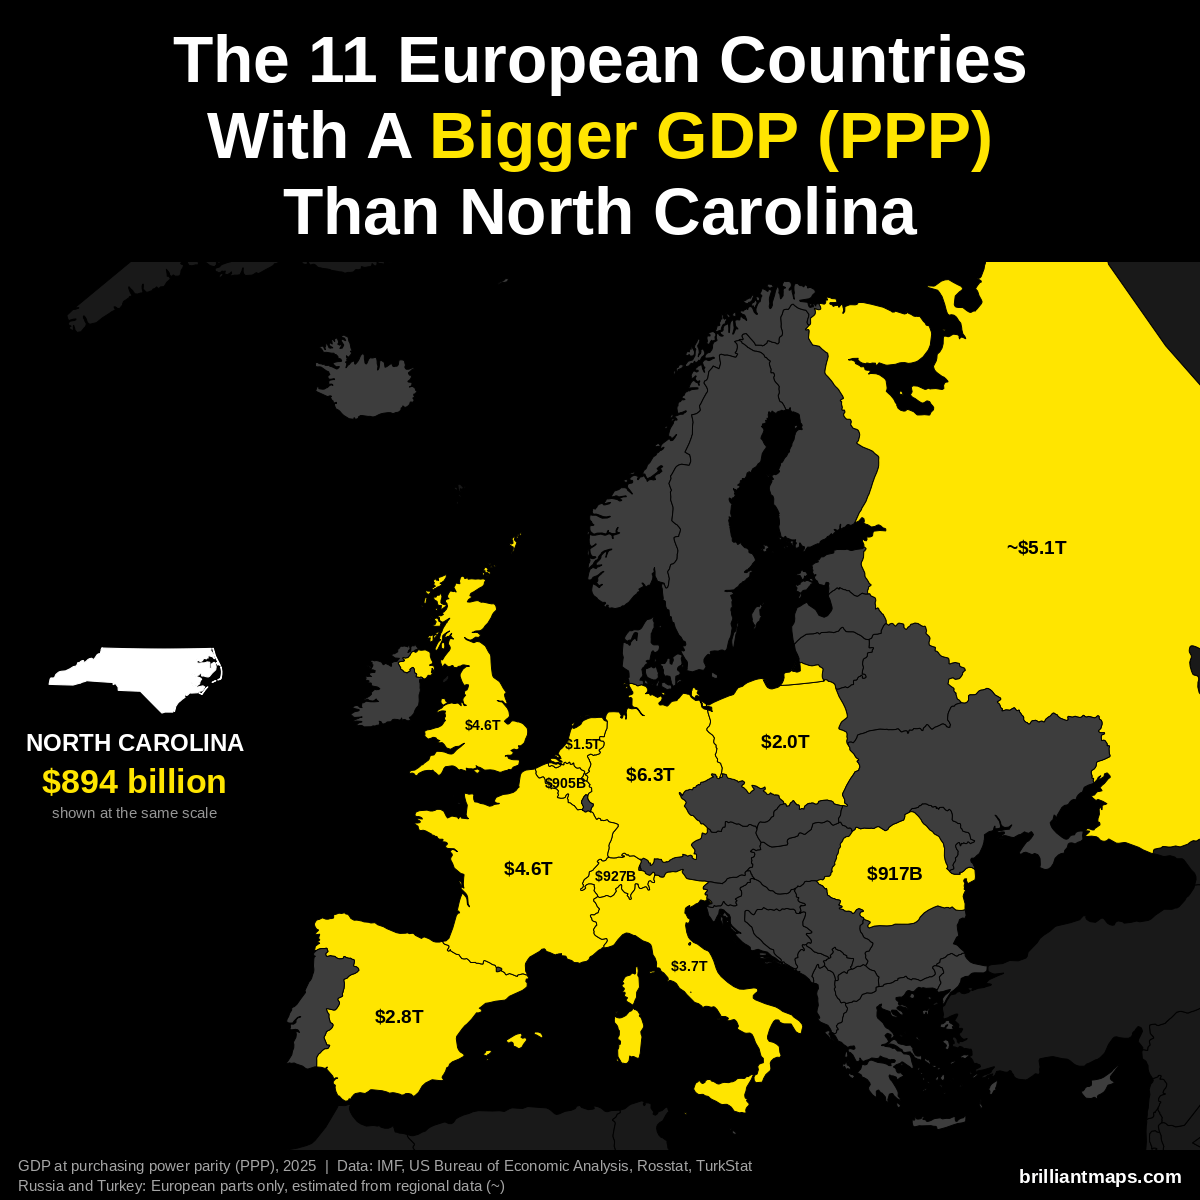
North Carolina has a GDP of $894 billion (2025). US states are already measured in the dollars PPP is based on, so the figure is the same as nominal GDP. 11 European countries have a bigger GDP at purchasing power parity:
- Germany: $6.26 trillion
- Russia (European part): ~$5.14 trillion
- France: $4.58 trillion
- United Kingdom: $4.57 trillion
- Italy: $3.74 trillion
- Spain: $2.83 trillion
- Poland: $2.04 trillion
- Netherlands: $1.52 trillion
- Switzerland: $927 billion
- Romania: $917 billion
- Belgium: $905 billion
North Carolina Vs European GDP Per Capita (PPP)
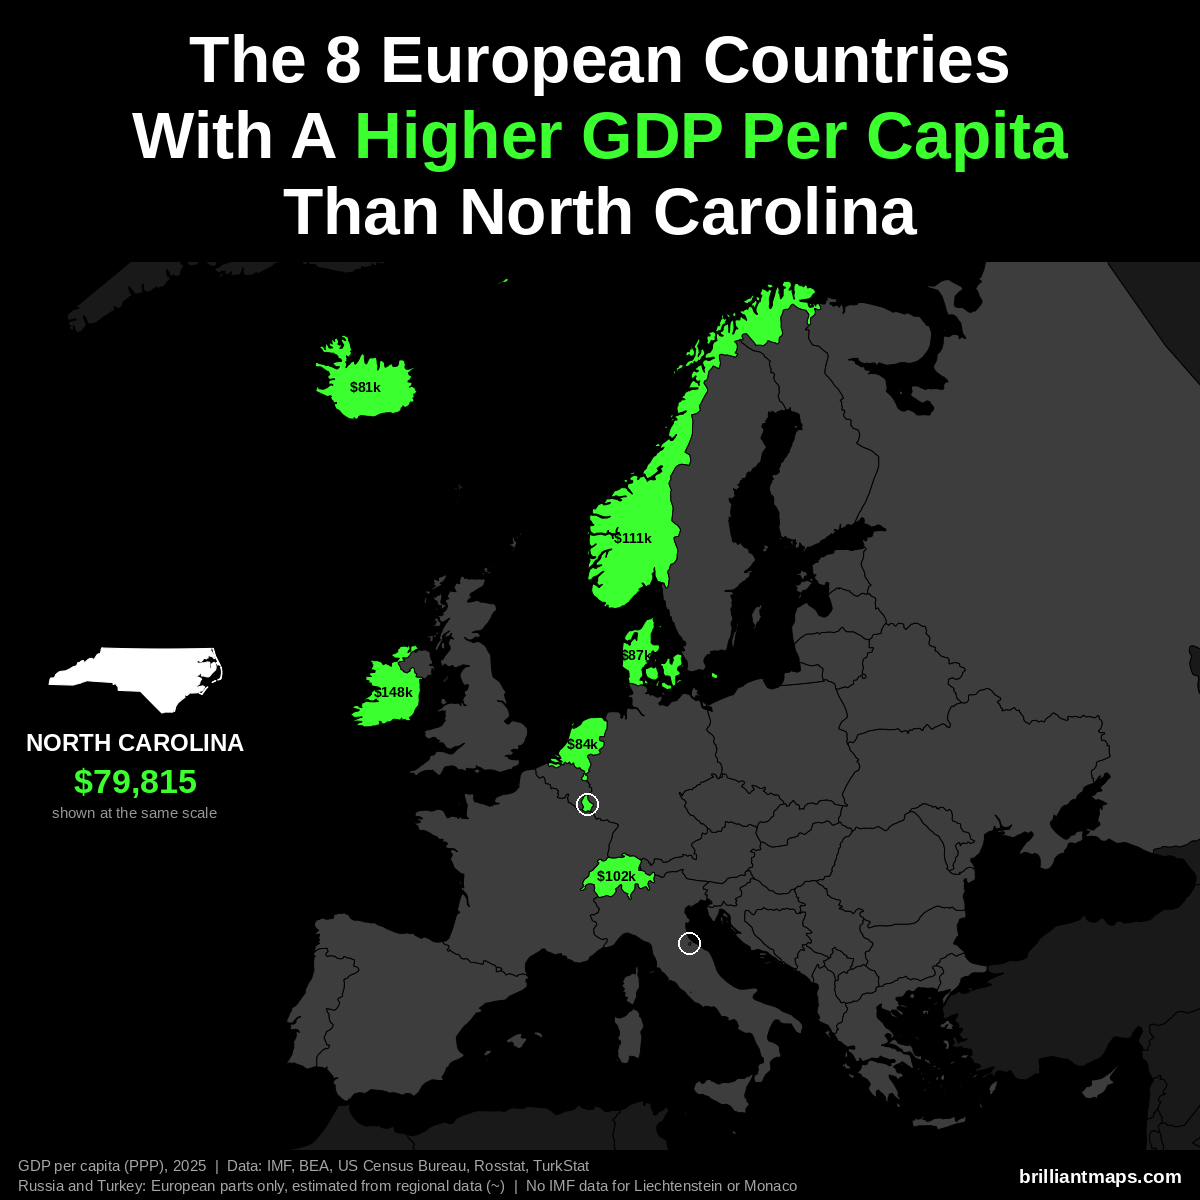
North Carolina has a GDP per capita of $79,815 (2025). 8 European countries have a higher GDP per capita at purchasing power parity:
- Luxembourg: $152,894
- Ireland: $147,825
- Norway: $111,462
- Switzerland: $102,397
- Denmark: $87,303
- Netherlands: $84,445
- San Marino: $83,838
- Iceland: $80,915
Liechtenstein and Monaco are not covered by the IMF data and are not counted here.
North Carolina Vs European Size
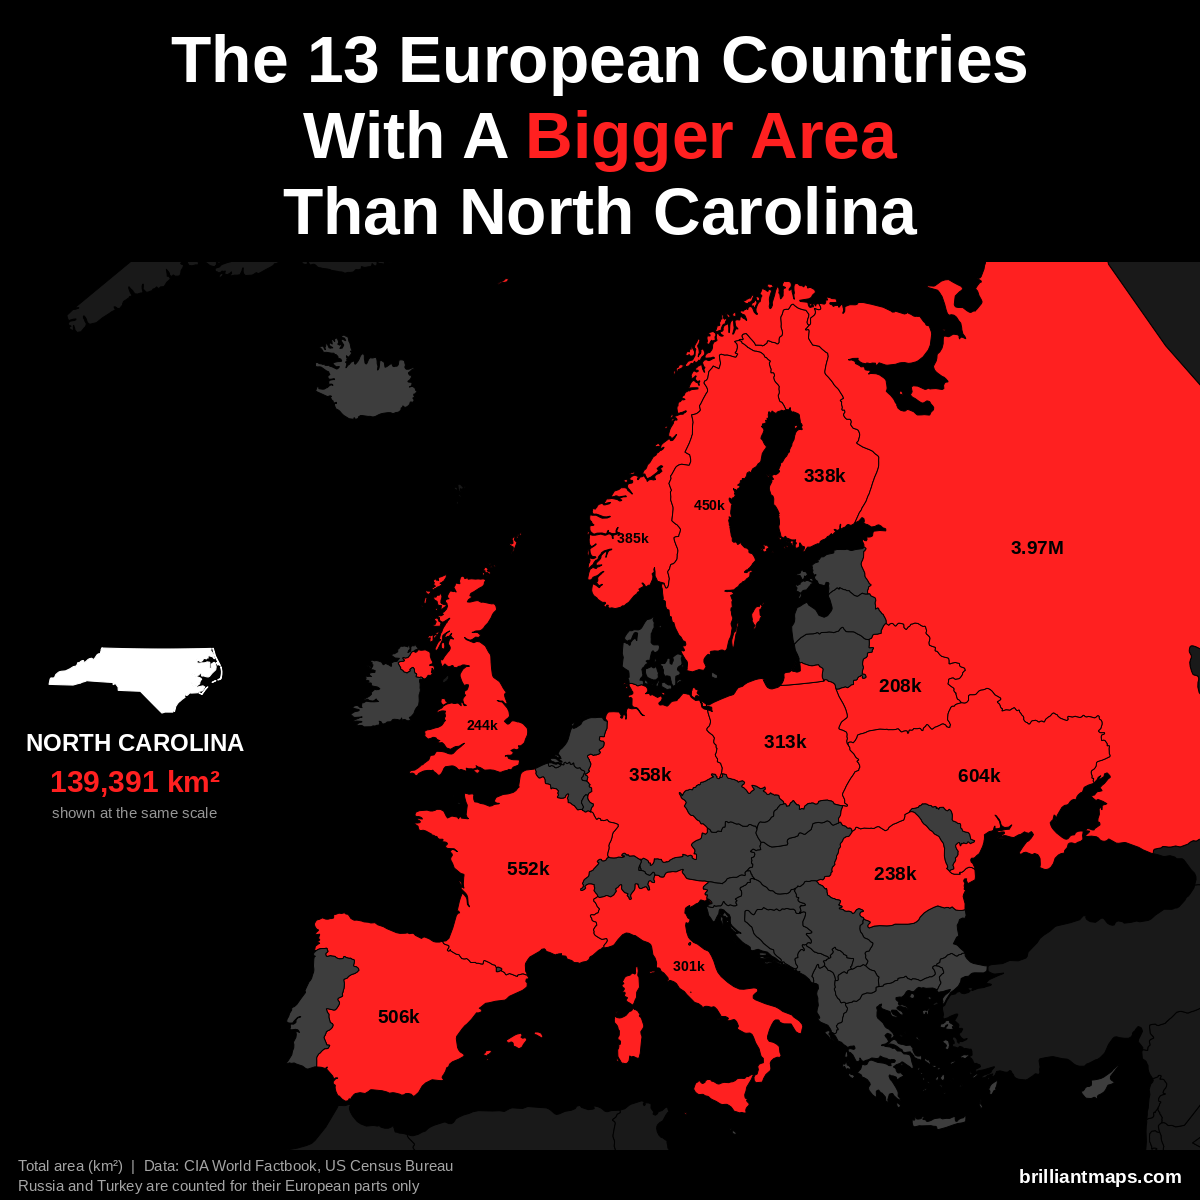
North Carolina has a total area of 139,391 km² (53,819 sq mi). 13 European countries have a bigger area:
- Russia (European part): 3,969,100 km² (1,532,477 sq mi)
- Ukraine: 603,550 km² (233,032 sq mi)
- France: 551,695 km² (213,010 sq mi)
- Spain: 505,990 km² (195,364 sq mi)
- Sweden: 450,295 km² (173,860 sq mi)
- Norway: 385,207 km² (148,729 sq mi)
- Germany: 357,588 km² (138,065 sq mi)
- Finland: 338,455 km² (130,678 sq mi)
- Poland: 312,696 km² (120,733 sq mi)
- Italy: 301,340 km² (116,348 sq mi)
- United Kingdom: 243,610 km² (94,058 sq mi)
- Romania: 238,397 km² (92,046 sq mi)
- Belarus: 207,600 km² (80,155 sq mi)
North Carolina Vs European Life Expectancy
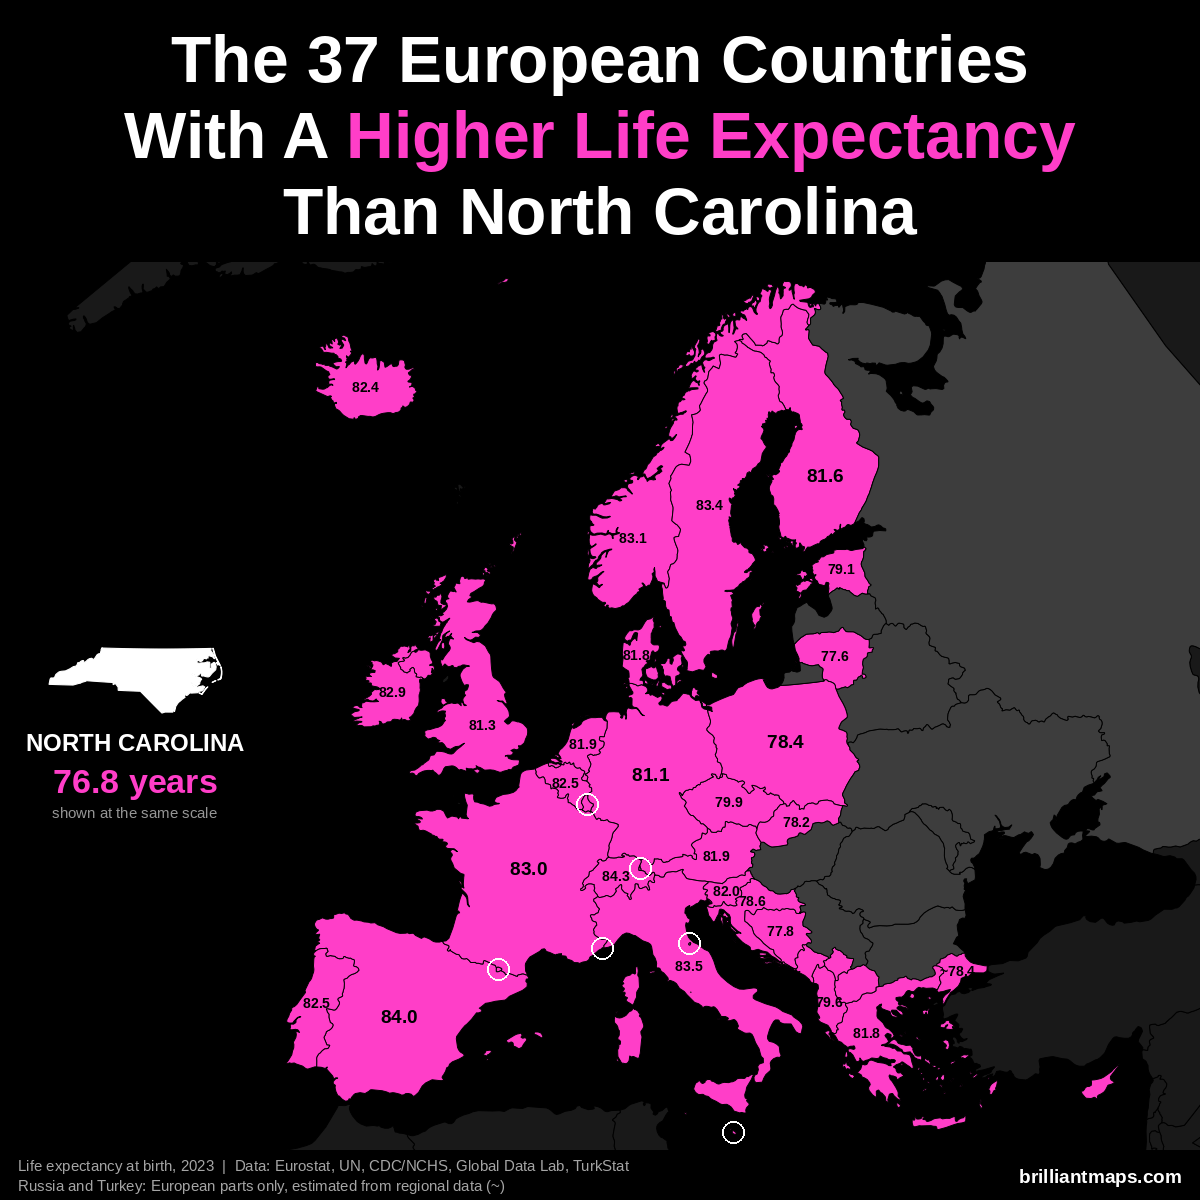
North Carolina has a life expectancy at birth of 76.8 years (2023). 37 European countries have a higher life expectancy:
- Monaco: 86.4 years
- San Marino: 85.7 years
- Liechtenstein: 84.6 years
- Switzerland: 84.3 years
- Andorra: 84.0 years
- Spain: 84.0 years
- Italy: 83.5 years
- Luxembourg: 83.4 years
- Malta: 83.4 years
- Sweden: 83.4 years
- Norway: 83.1 years
- France: 83.0 years
- Cyprus: 82.9 years
- Ireland: 82.9 years
- Belgium: 82.5 years
- Portugal: 82.5 years
- Iceland: 82.4 years
- Slovenia: 82.0 years
- Austria: 81.9 years
- Netherlands: 81.9 years
- Denmark: 81.8 years
- Greece: 81.8 years
- Finland: 81.6 years
- United Kingdom: 81.3 years
- Germany: 81.1 years
- Czechia: 79.9 years
- Albania: 79.6 years
- Estonia: 79.1 years
- Croatia: 78.6 years
- Poland: 78.4 years
- Turkey (European part): ~78.4 years
- Slovakia: 78.2 years
- Kosovo: 78.0 years
- Bosnia and Herzegovina: 77.8 years
- Lithuania: 77.6 years
- Montenegro: 77.6 years
- North Macedonia: 77.4 years
North Dakota vs Europe
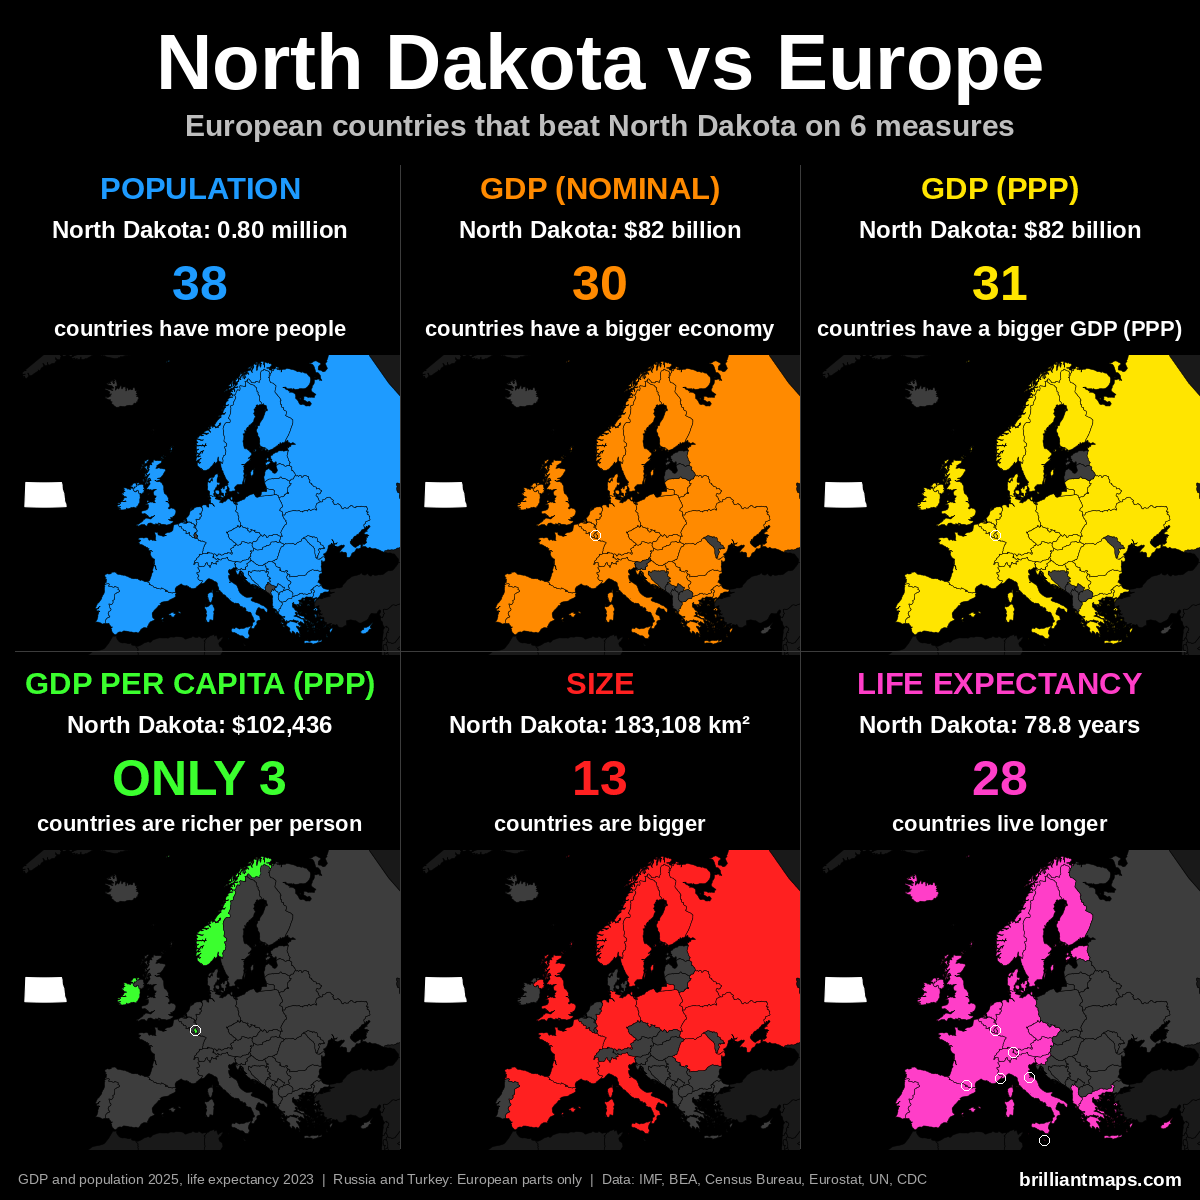
North Dakota Vs European Population
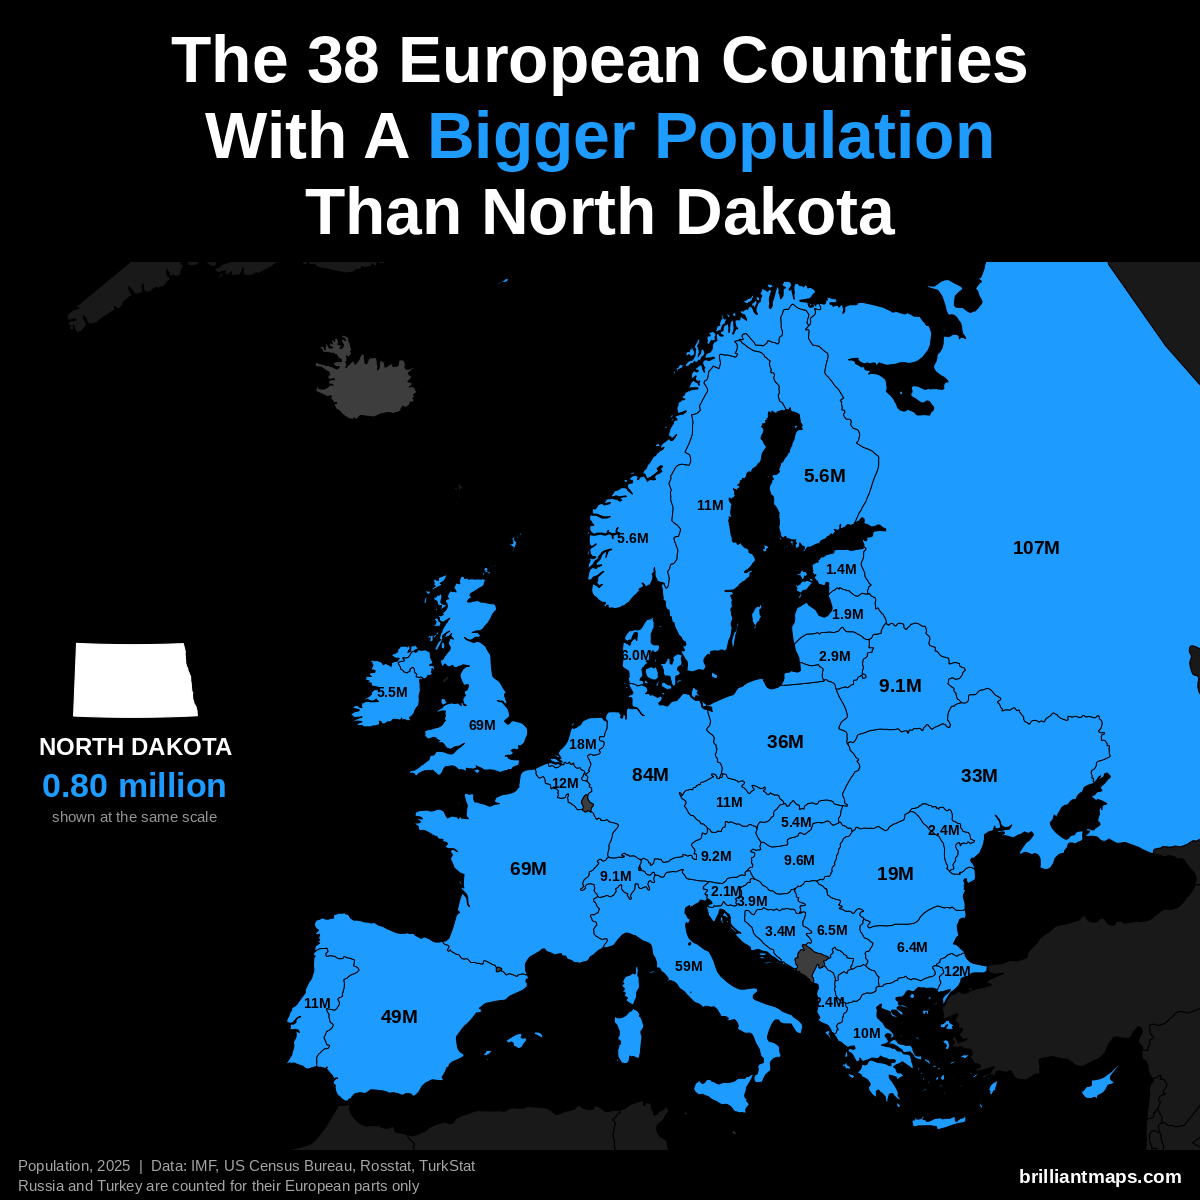
North Dakota has a population of 799,358 (2025). 38 European countries have a bigger population:
- Russia (European part): 107.0 million
- Germany: 83.5 million
- United Kingdom: 69.5 million
- France: 68.9 million
- Italy: 58.9 million
- Spain: 49.5 million
- Poland: 36.5 million
- Ukraine: 32.9 million
- Romania: 19.0 million
- Netherlands: 18.0 million
- Turkey (European part): 12.2 million
- Belgium: 11.9 million
- Portugal: 10.8 million
- Czechia: 10.8 million
- Sweden: 10.7 million
- Greece: 10.4 million
- Hungary: 9.6 million
- Austria: 9.2 million
- Belarus: 9.1 million
- Switzerland: 9.1 million
- Serbia: 6.5 million
- Bulgaria: 6.4 million
- Denmark: 6.0 million
- Norway: 5.6 million
- Finland: 5.6 million
- Ireland: 5.5 million
- Slovakia: 5.4 million
- Croatia: 3.9 million
- Bosnia and Herzegovina: 3.4 million
- Lithuania: 2.9 million
- Moldova: 2.4 million
- Albania: 2.4 million
- Slovenia: 2.1 million
- Latvia: 1.9 million
- North Macedonia: 1.8 million
- Kosovo: 1.6 million
- Estonia: 1.4 million
- Cyprus: 983,000
North Dakota Vs European GDP (Nominal)
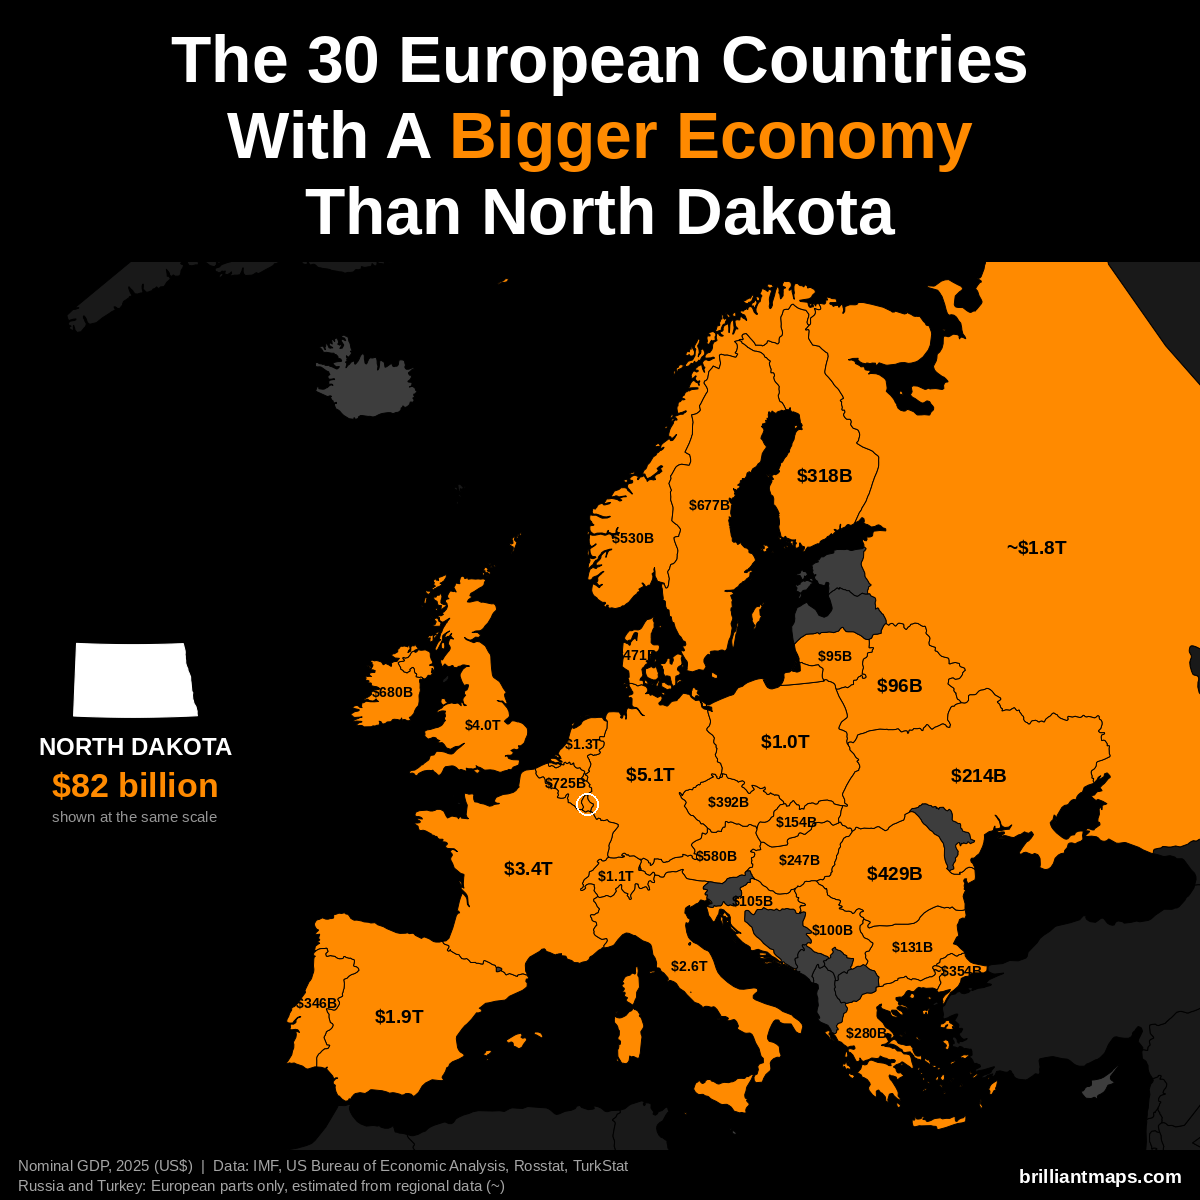
North Dakota has a nominal GDP of $82 billion (2025). 30 European countries have a bigger economy:
- Germany: $5.12 trillion
- United Kingdom: $4.01 trillion
- France: $3.38 trillion
- Italy: $2.55 trillion
- Spain: $1.91 trillion
- Russia (European part): ~$1.83 trillion
- Netherlands: $1.32 trillion
- Switzerland: $1.06 trillion
- Poland: $1.04 trillion
- Belgium: $725 billion
- Ireland: $680 billion
- Sweden: $677 billion
- Austria: $580 billion
- Norway: $530 billion
- Denmark: $471 billion
- Romania: $429 billion
- Czechia: $392 billion
- Turkey (European part): ~$354 billion
- Portugal: $346 billion
- Finland: $318 billion
- Greece: $280 billion
- Hungary: $247 billion
- Ukraine: $214 billion
- Slovakia: $154 billion
- Bulgaria: $131 billion
- Croatia: $105 billion
- Luxembourg: $101 billion
- Serbia: $100 billion
- Belarus: $96 billion
- Lithuania: $95 billion
North Dakota Vs European GDP (PPP)
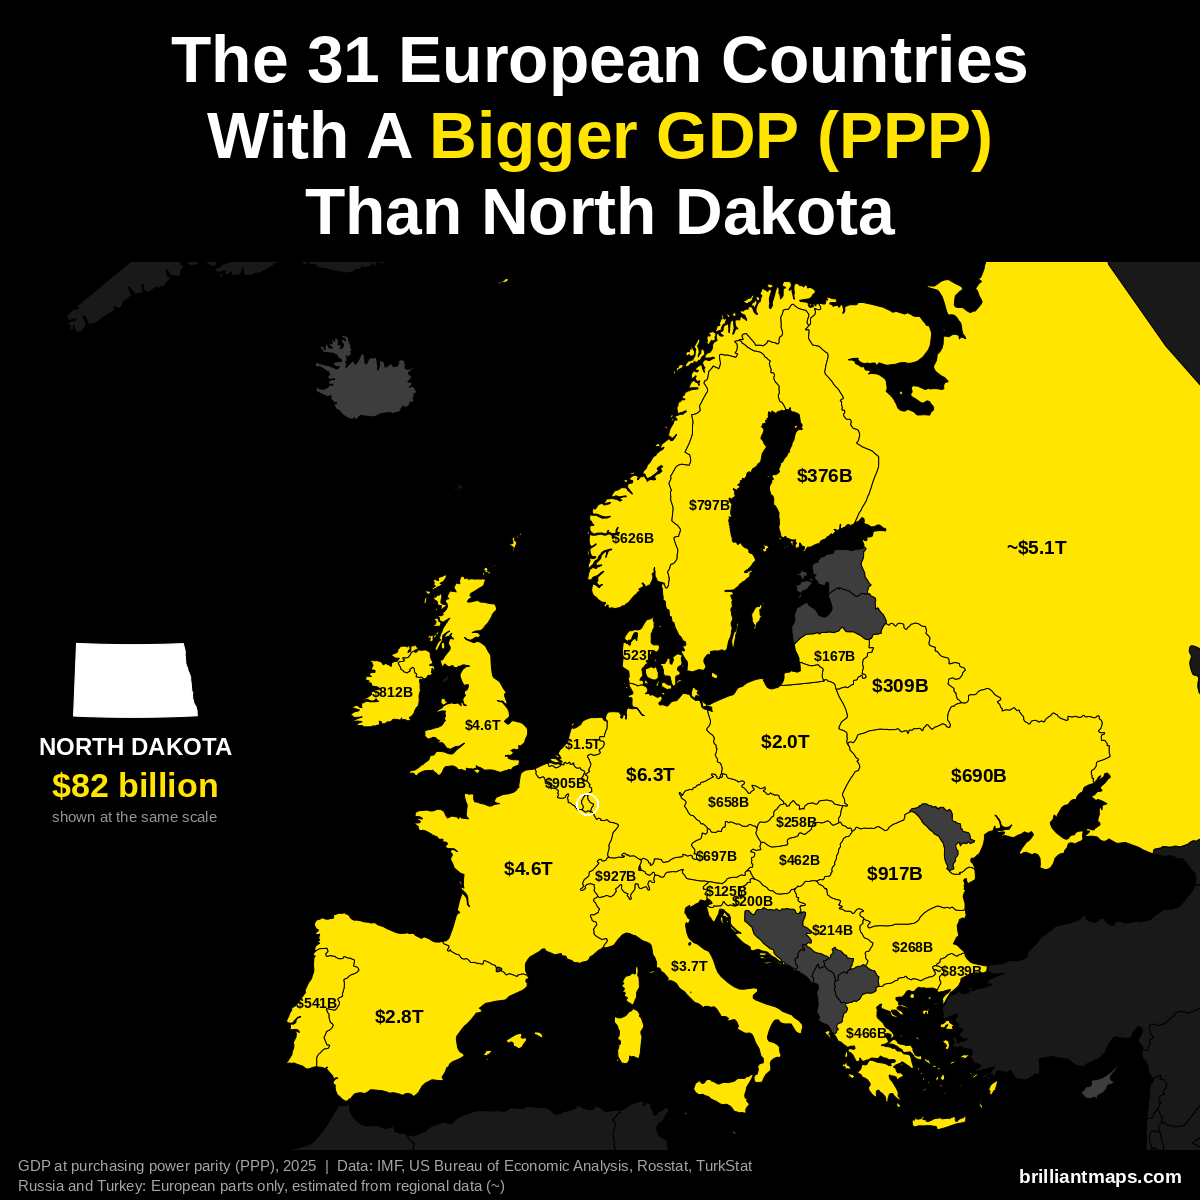
North Dakota has a GDP of $82 billion (2025). US states are already measured in the dollars PPP is based on, so the figure is the same as nominal GDP. 31 European countries have a bigger GDP at purchasing power parity:
- Germany: $6.26 trillion
- Russia (European part): ~$5.14 trillion
- France: $4.58 trillion
- United Kingdom: $4.57 trillion
- Italy: $3.74 trillion
- Spain: $2.83 trillion
- Poland: $2.04 trillion
- Netherlands: $1.52 trillion
- Switzerland: $927 billion
- Romania: $917 billion
- Belgium: $905 billion
- Turkey (European part): ~$839 billion
- Ireland: $812 billion
- Sweden: $797 billion
- Austria: $697 billion
- Ukraine: $690 billion
- Czechia: $658 billion
- Norway: $626 billion
- Portugal: $541 billion
- Denmark: $523 billion
- Greece: $466 billion
- Hungary: $462 billion
- Finland: $376 billion
- Belarus: $309 billion
- Bulgaria: $268 billion
- Slovakia: $258 billion
- Serbia: $214 billion
- Croatia: $200 billion
- Lithuania: $167 billion
- Slovenia: $125 billion
- Luxembourg: $104 billion
North Dakota Vs European GDP Per Capita (PPP)
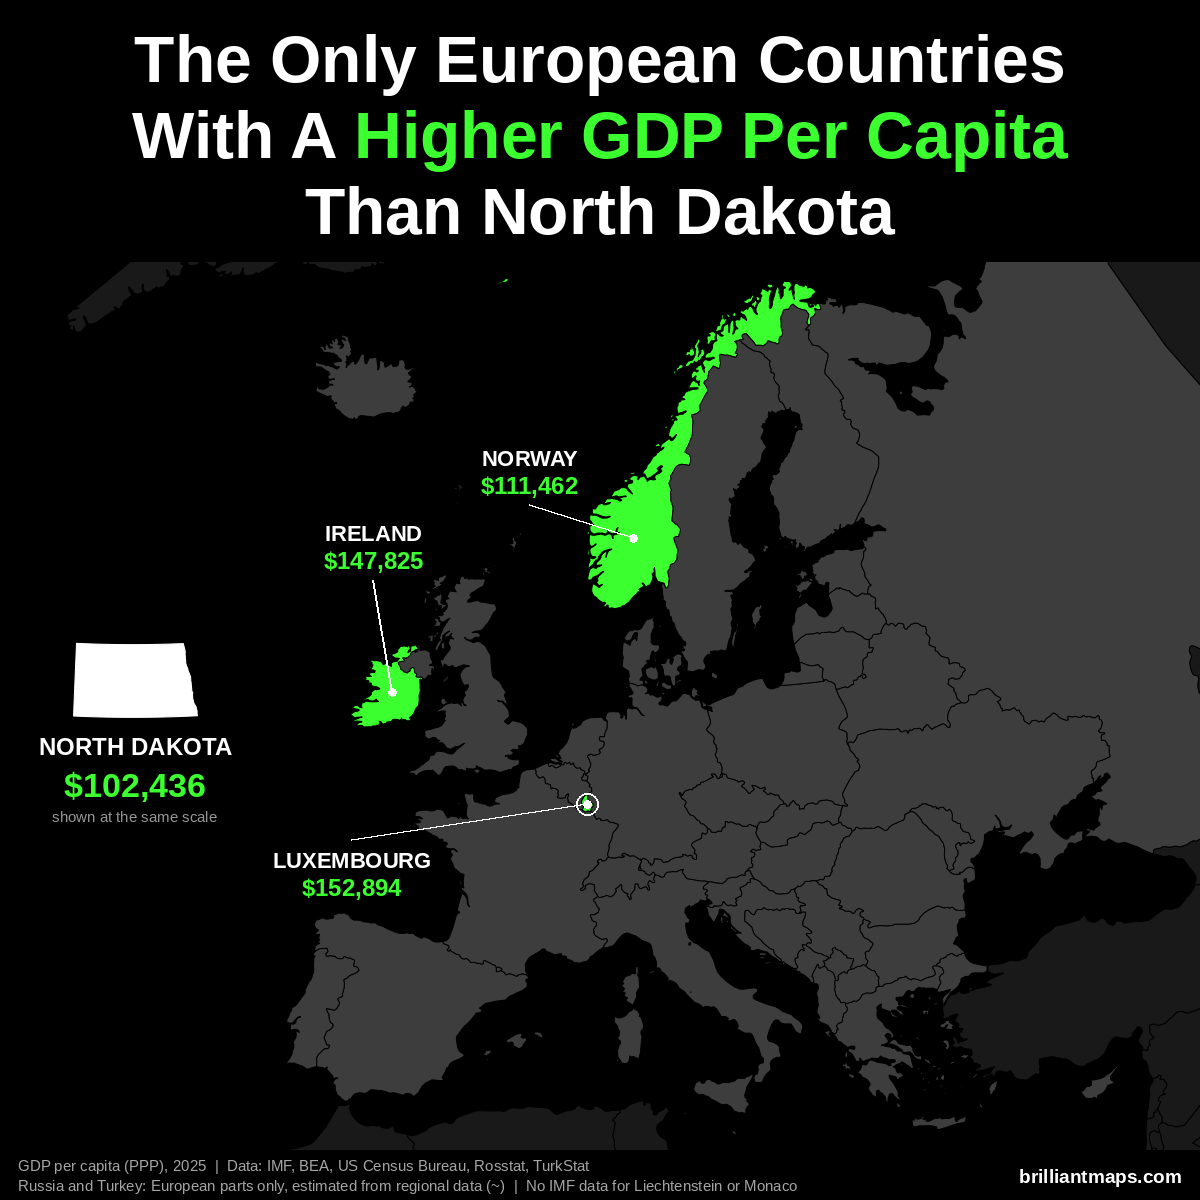
North Dakota has a GDP per capita of $102,436 (2025). Only 3 European countries have a higher GDP per capita at purchasing power parity:
- Luxembourg: $152,894
- Ireland: $147,825
- Norway: $111,462
Liechtenstein and Monaco are not covered by the IMF data and are not counted here.
North Dakota Vs European Size
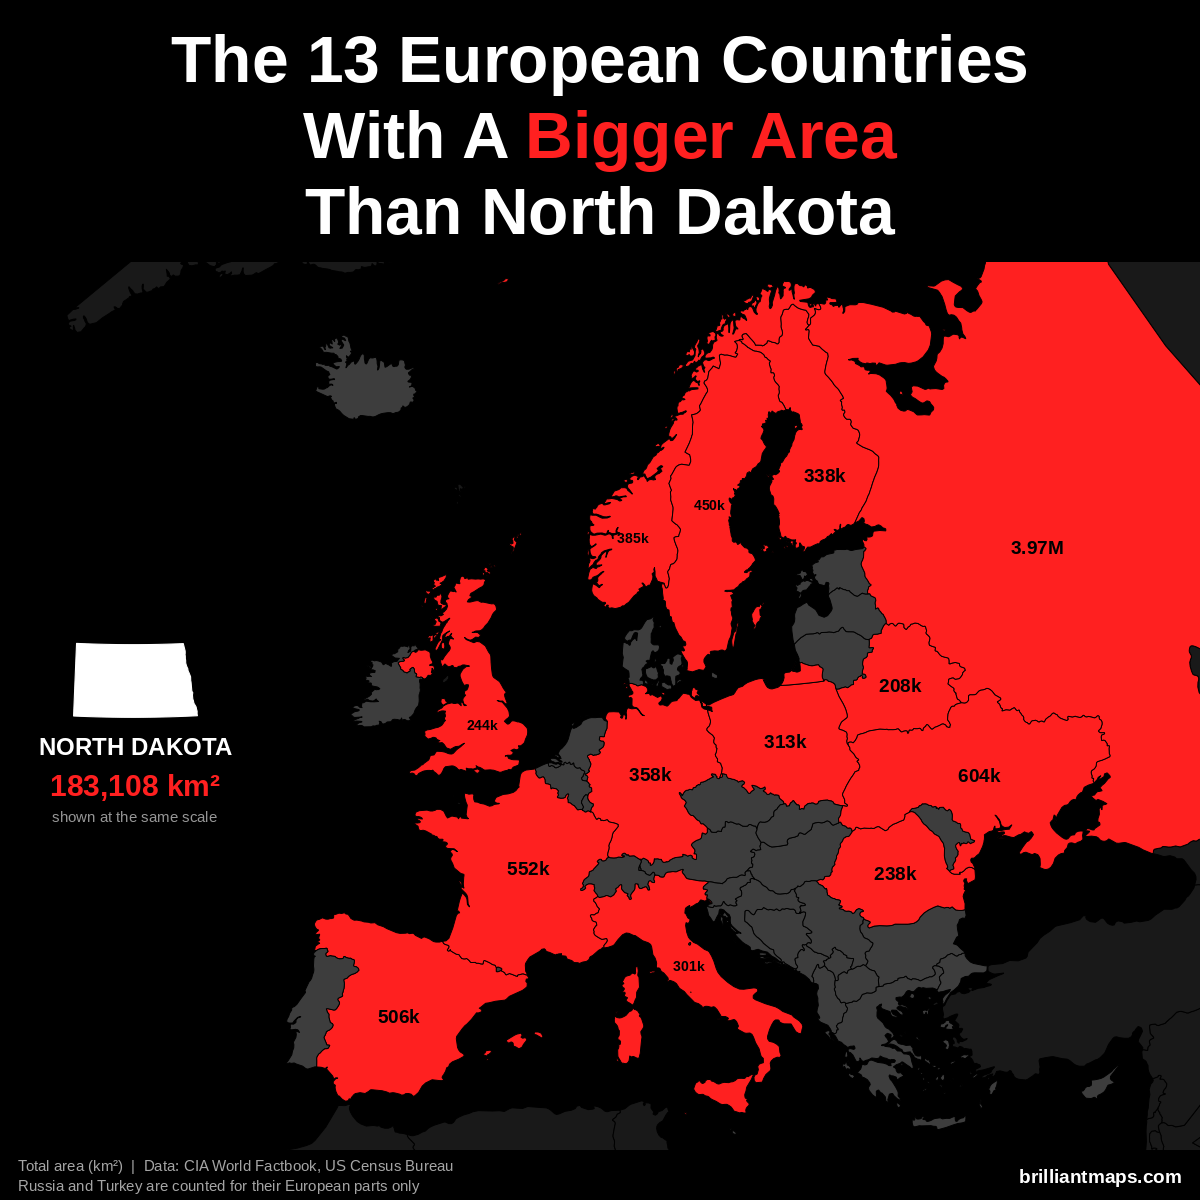
North Dakota has a total area of 183,108 km² (70,698 sq mi). 13 European countries have a bigger area:
- Russia (European part): 3,969,100 km² (1,532,477 sq mi)
- Ukraine: 603,550 km² (233,032 sq mi)
- France: 551,695 km² (213,010 sq mi)
- Spain: 505,990 km² (195,364 sq mi)
- Sweden: 450,295 km² (173,860 sq mi)
- Norway: 385,207 km² (148,729 sq mi)
- Germany: 357,588 km² (138,065 sq mi)
- Finland: 338,455 km² (130,678 sq mi)
- Poland: 312,696 km² (120,733 sq mi)
- Italy: 301,340 km² (116,348 sq mi)
- United Kingdom: 243,610 km² (94,058 sq mi)
- Romania: 238,397 km² (92,046 sq mi)
- Belarus: 207,600 km² (80,155 sq mi)
North Dakota Vs European Life Expectancy
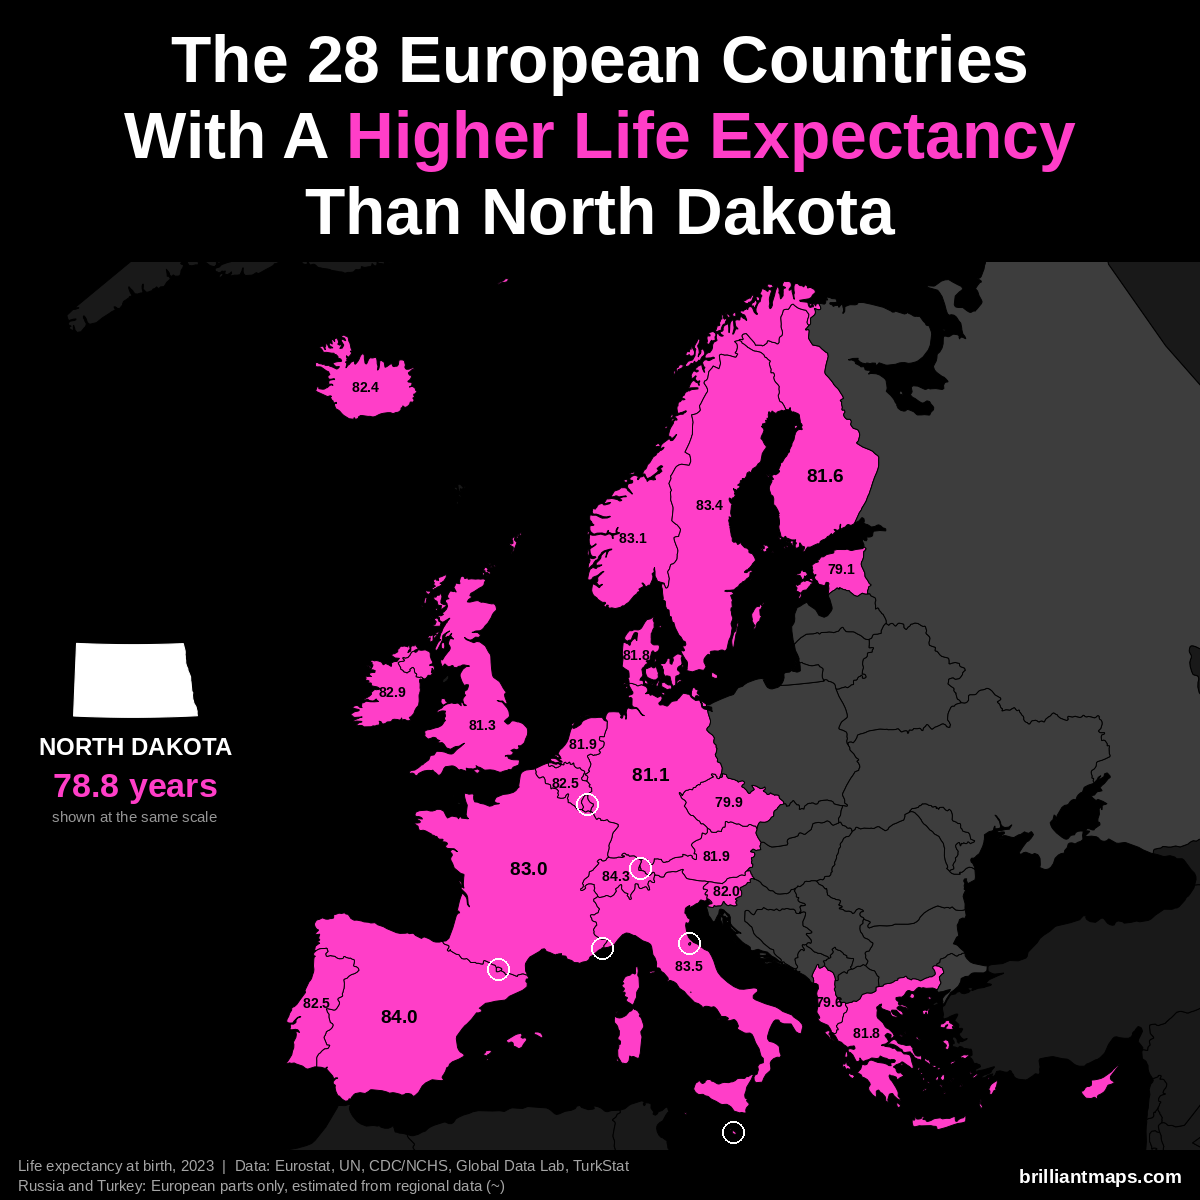
North Dakota has a life expectancy at birth of 78.8 years (2023). 28 European countries have a higher life expectancy:
- Monaco: 86.4 years
- San Marino: 85.7 years
- Liechtenstein: 84.6 years
- Switzerland: 84.3 years
- Andorra: 84.0 years
- Spain: 84.0 years
- Italy: 83.5 years
- Luxembourg: 83.4 years
- Malta: 83.4 years
- Sweden: 83.4 years
- Norway: 83.1 years
- France: 83.0 years
- Cyprus: 82.9 years
- Ireland: 82.9 years
- Belgium: 82.5 years
- Portugal: 82.5 years
- Iceland: 82.4 years
- Slovenia: 82.0 years
- Austria: 81.9 years
- Netherlands: 81.9 years
- Denmark: 81.8 years
- Greece: 81.8 years
- Finland: 81.6 years
- United Kingdom: 81.3 years
- Germany: 81.1 years
- Czechia: 79.9 years
- Albania: 79.6 years
- Estonia: 79.1 years
Ohio vs Europe
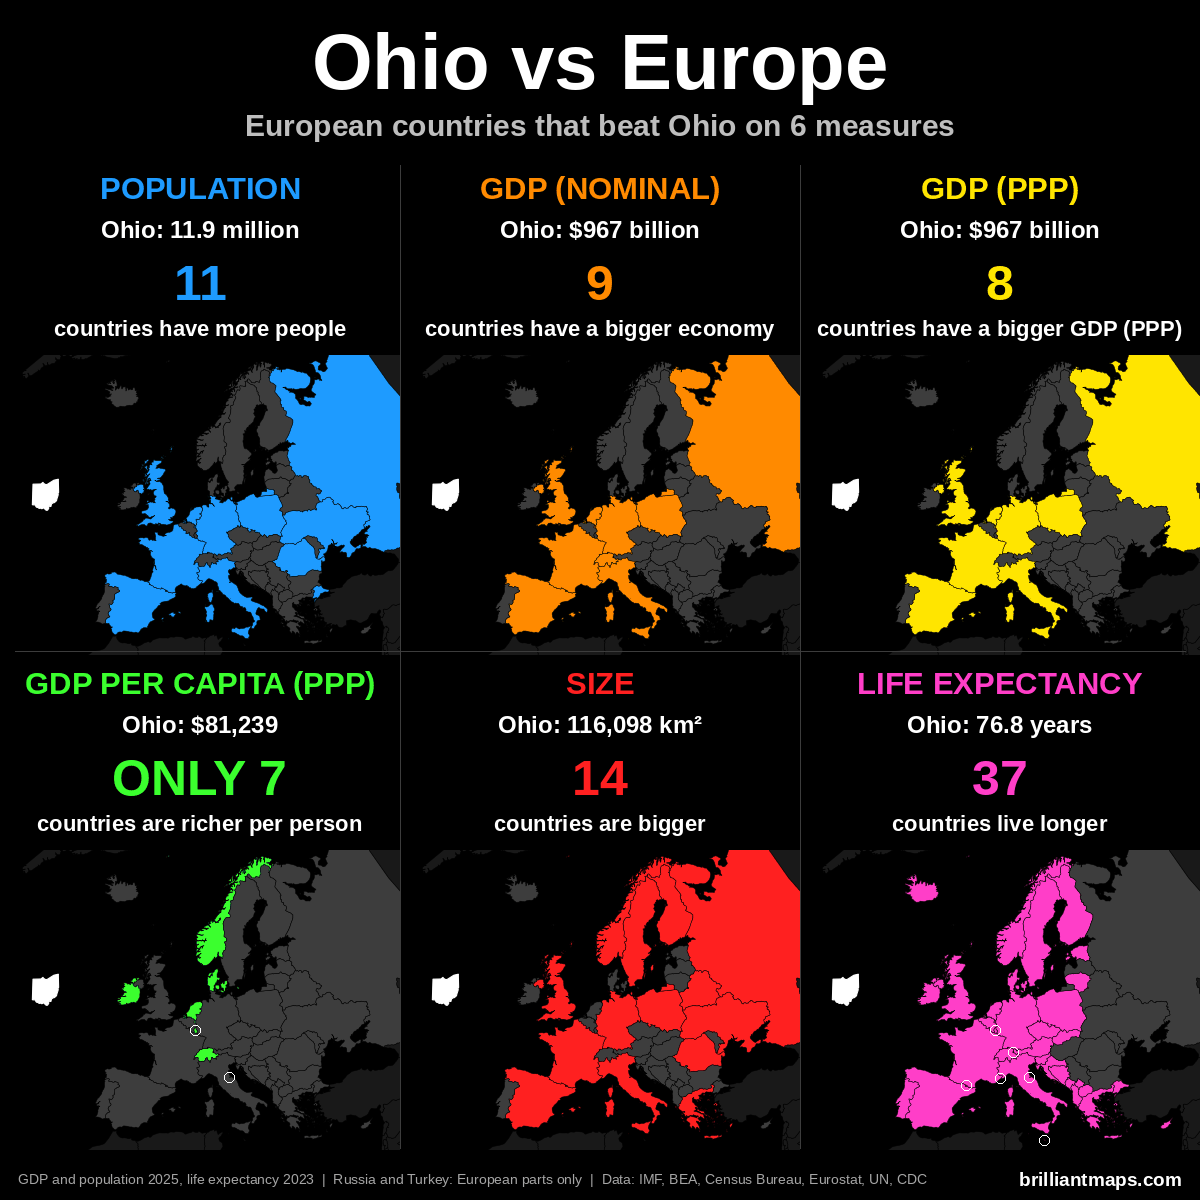
Ohio Vs European Population
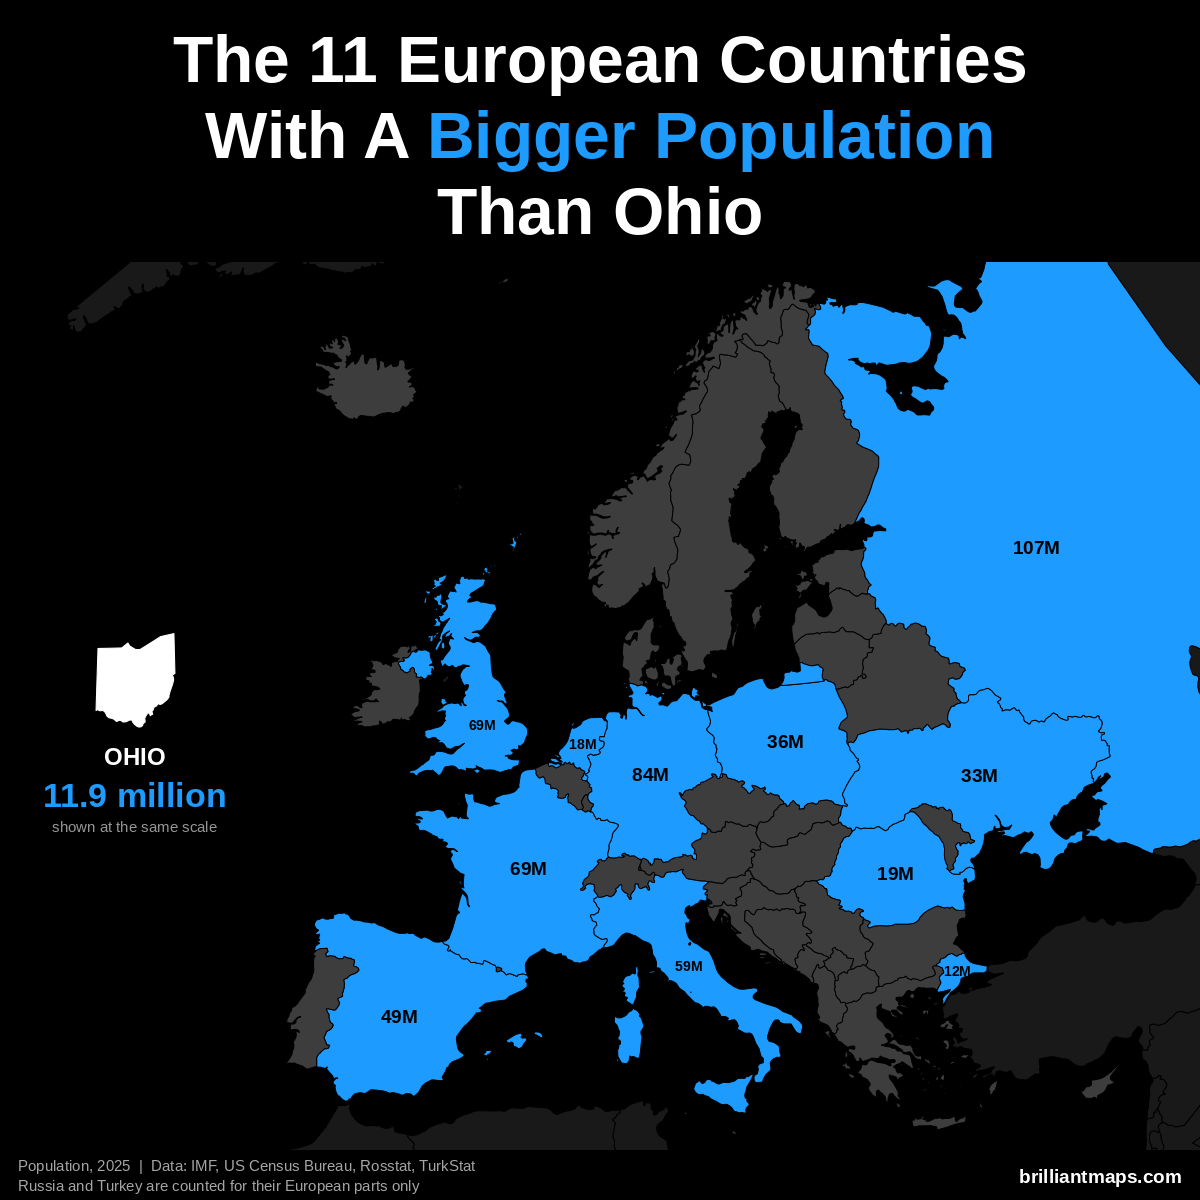
Ohio has a population of 11.9 million (2025). 11 European countries have a bigger population:
- Russia (European part): 107.0 million
- Germany: 83.5 million
- United Kingdom: 69.5 million
- France: 68.9 million
- Italy: 58.9 million
- Spain: 49.5 million
- Poland: 36.5 million
- Ukraine: 32.9 million
- Romania: 19.0 million
- Netherlands: 18.0 million
- Turkey (European part): 12.2 million
Ohio Vs European GDP (Nominal)
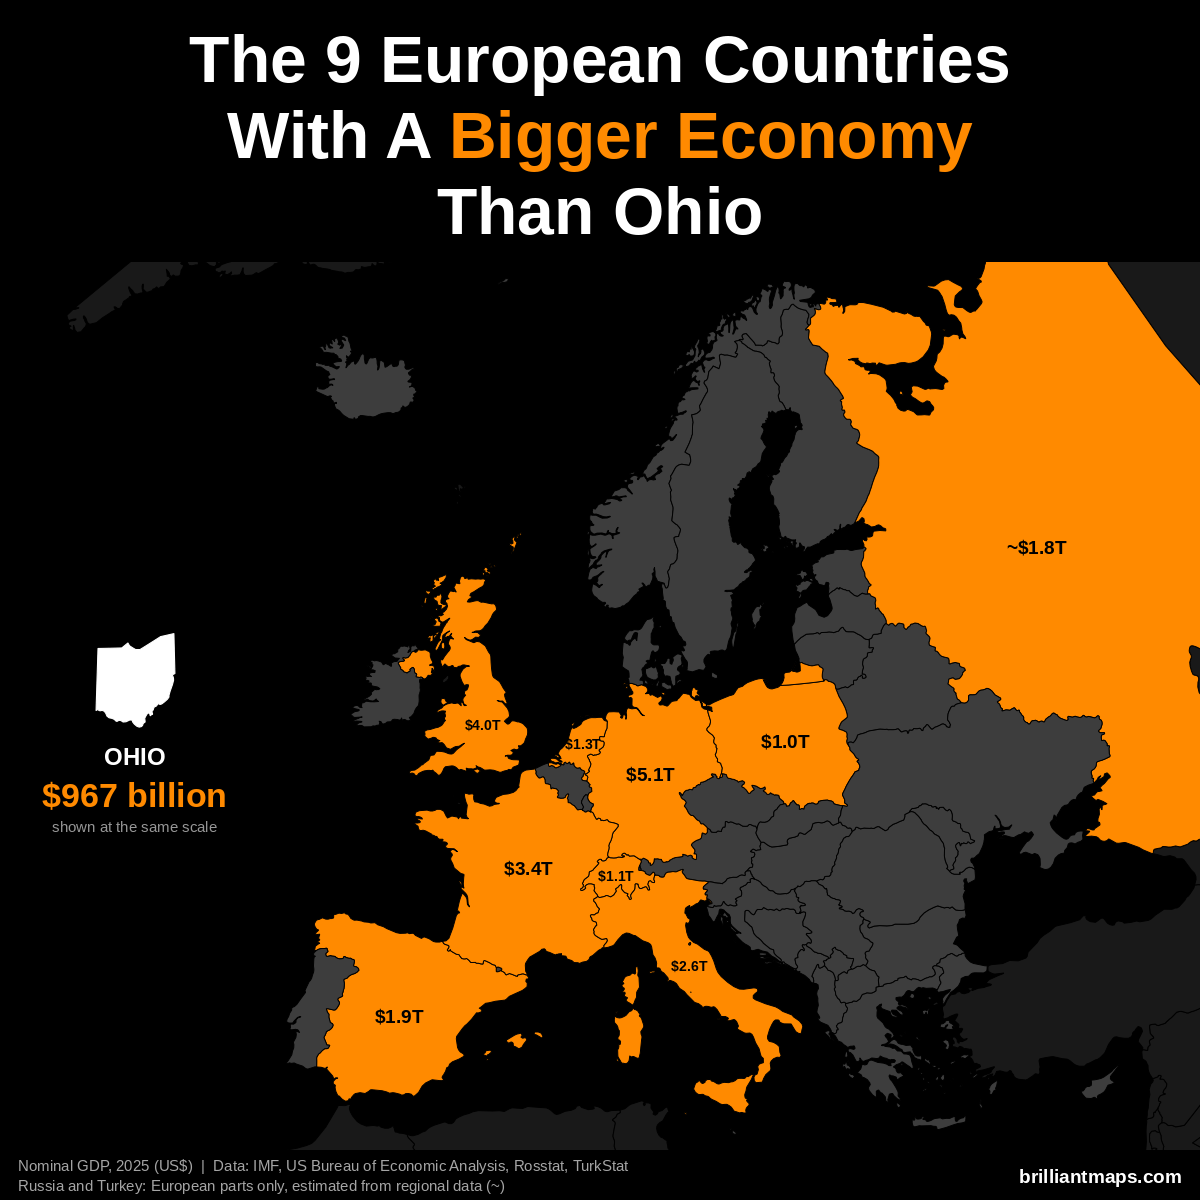
Ohio has a nominal GDP of $967 billion (2025). 9 European countries have a bigger economy:
- Germany: $5.12 trillion
- United Kingdom: $4.01 trillion
- France: $3.38 trillion
- Italy: $2.55 trillion
- Spain: $1.91 trillion
- Russia (European part): ~$1.83 trillion
- Netherlands: $1.32 trillion
- Switzerland: $1.06 trillion
- Poland: $1.04 trillion
Ohio Vs European GDP (PPP)
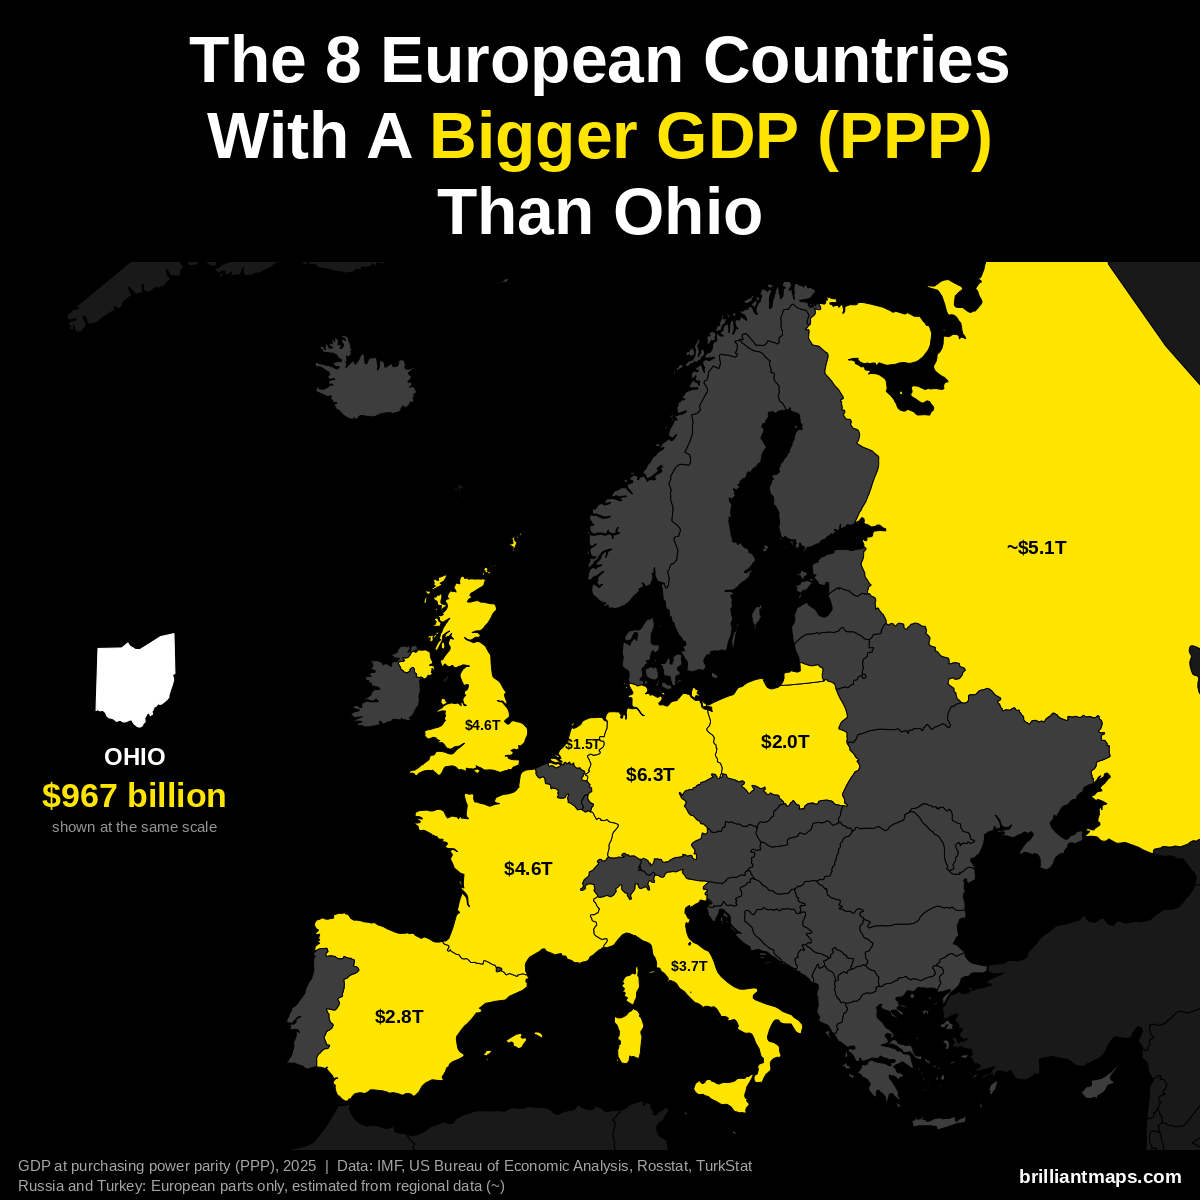
Ohio has a GDP of $967 billion (2025). US states are already measured in the dollars PPP is based on, so the figure is the same as nominal GDP. 8 European countries have a bigger GDP at purchasing power parity:
- Germany: $6.26 trillion
- Russia (European part): ~$5.14 trillion
- France: $4.58 trillion
- United Kingdom: $4.57 trillion
- Italy: $3.74 trillion
- Spain: $2.83 trillion
- Poland: $2.04 trillion
- Netherlands: $1.52 trillion
Ohio Vs European GDP Per Capita (PPP)
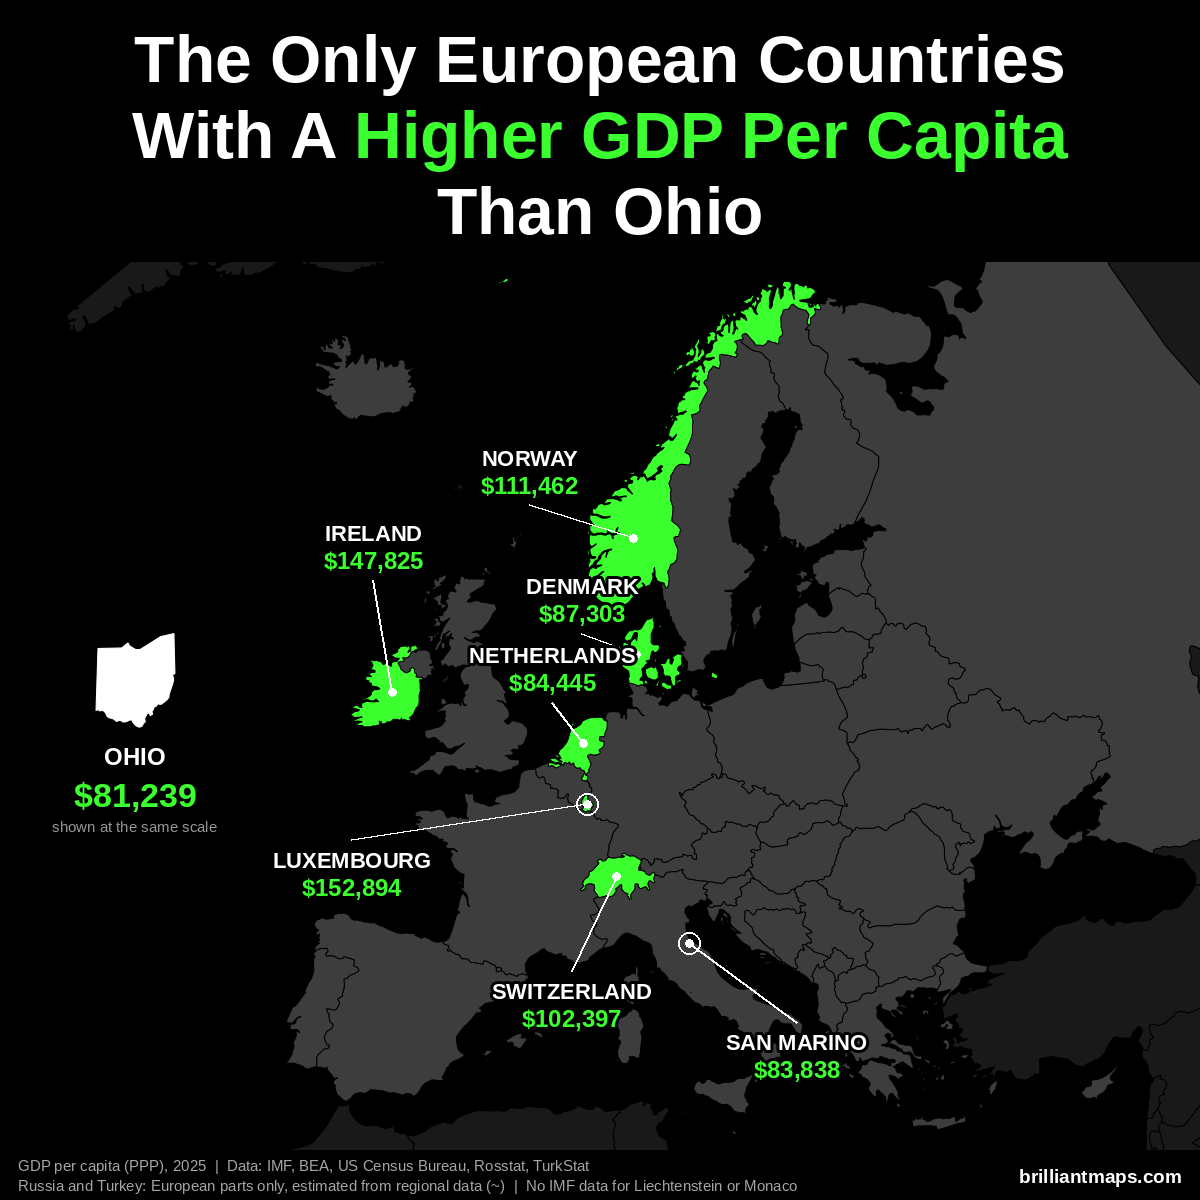
Ohio has a GDP per capita of $81,239 (2025). Only 7 European countries have a higher GDP per capita at purchasing power parity:
- Luxembourg: $152,894
- Ireland: $147,825
- Norway: $111,462
- Switzerland: $102,397
- Denmark: $87,303
- Netherlands: $84,445
- San Marino: $83,838
Liechtenstein and Monaco are not covered by the IMF data and are not counted here.
Ohio Vs European Size
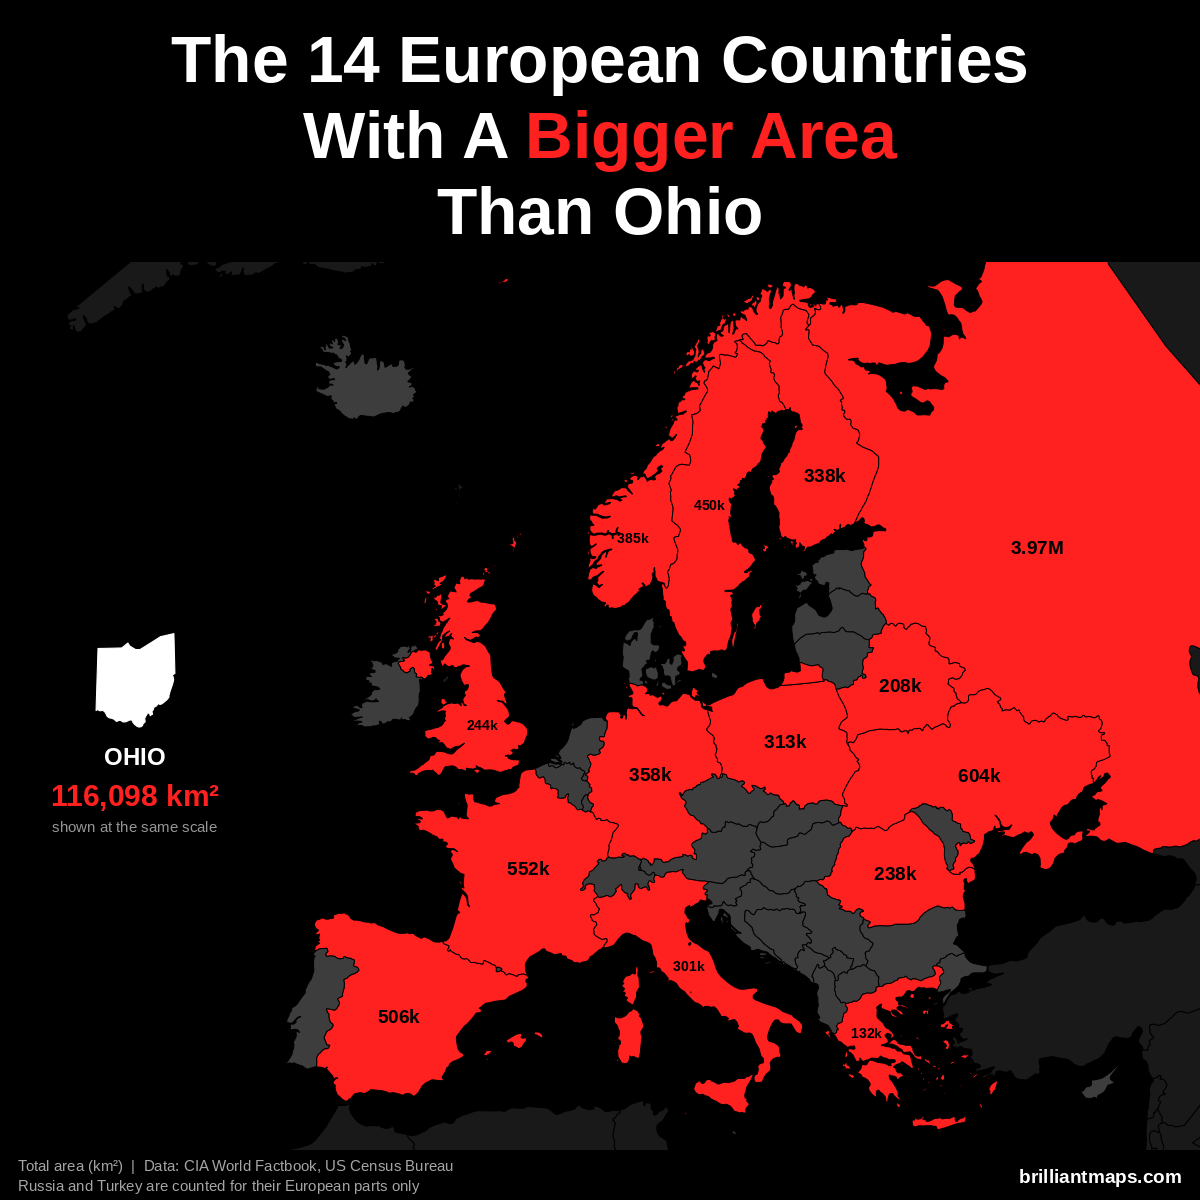
Ohio has a total area of 116,098 km² (44,826 sq mi). 14 European countries have a bigger area:
- Russia (European part): 3,969,100 km² (1,532,477 sq mi)
- Ukraine: 603,550 km² (233,032 sq mi)
- France: 551,695 km² (213,010 sq mi)
- Spain: 505,990 km² (195,364 sq mi)
- Sweden: 450,295 km² (173,860 sq mi)
- Norway: 385,207 km² (148,729 sq mi)
- Germany: 357,588 km² (138,065 sq mi)
- Finland: 338,455 km² (130,678 sq mi)
- Poland: 312,696 km² (120,733 sq mi)
- Italy: 301,340 km² (116,348 sq mi)
- United Kingdom: 243,610 km² (94,058 sq mi)
- Romania: 238,397 km² (92,046 sq mi)
- Belarus: 207,600 km² (80,155 sq mi)
- Greece: 131,957 km² (50,949 sq mi)
Ohio Vs European Life Expectancy
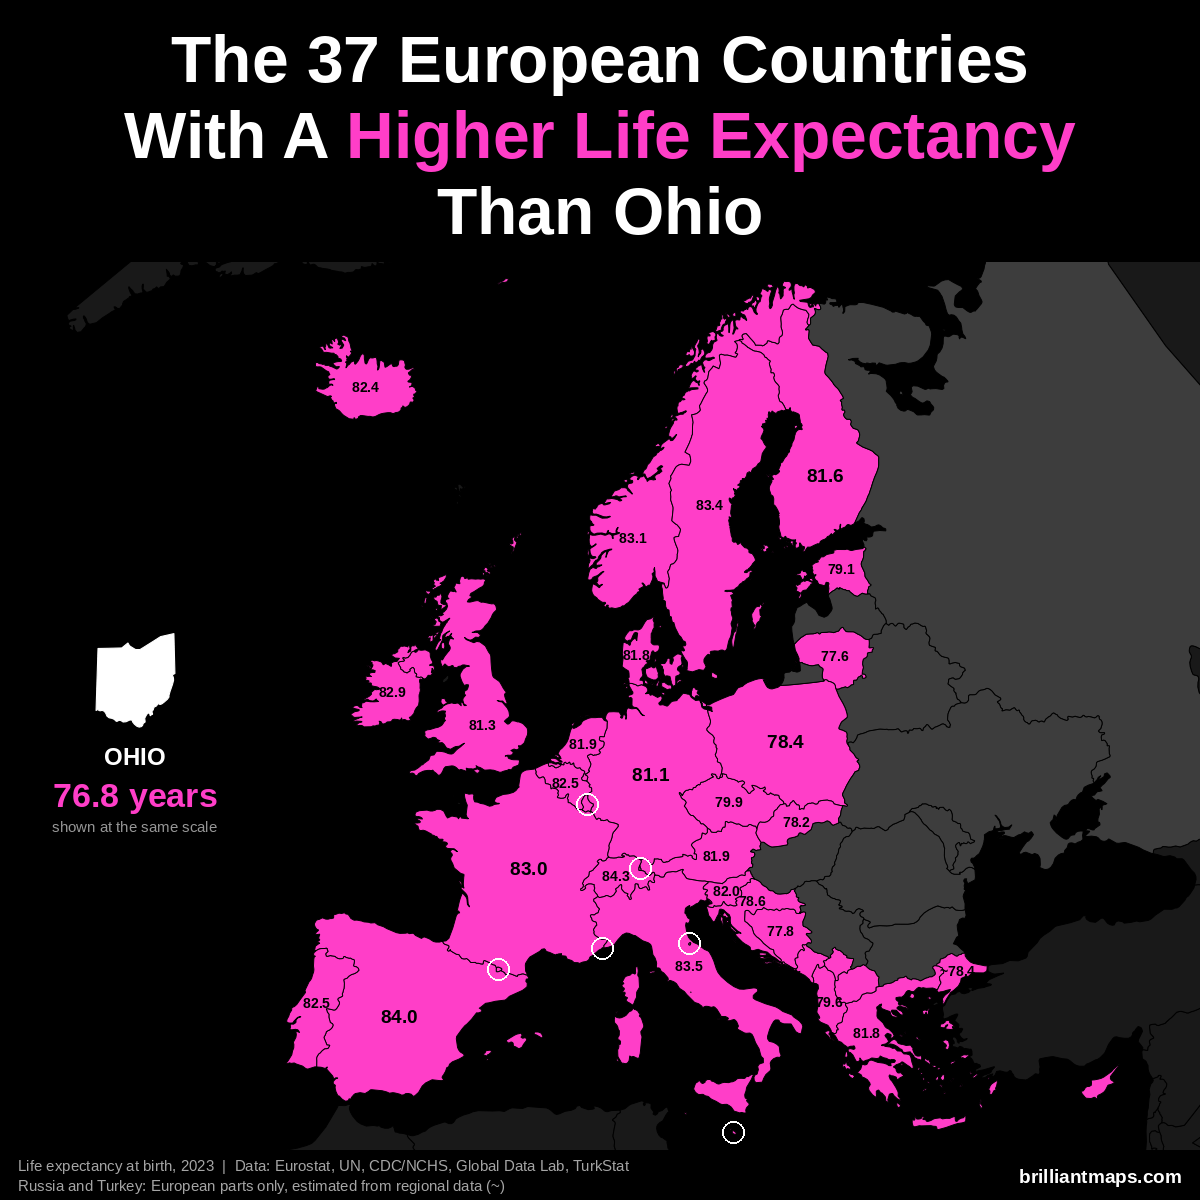
Ohio has a life expectancy at birth of 76.8 years (2023). 37 European countries have a higher life expectancy:
- Monaco: 86.4 years
- San Marino: 85.7 years
- Liechtenstein: 84.6 years
- Switzerland: 84.3 years
- Andorra: 84.0 years
- Spain: 84.0 years
- Italy: 83.5 years
- Luxembourg: 83.4 years
- Malta: 83.4 years
- Sweden: 83.4 years
- Norway: 83.1 years
- France: 83.0 years
- Cyprus: 82.9 years
- Ireland: 82.9 years
- Belgium: 82.5 years
- Portugal: 82.5 years
- Iceland: 82.4 years
- Slovenia: 82.0 years
- Austria: 81.9 years
- Netherlands: 81.9 years
- Denmark: 81.8 years
- Greece: 81.8 years
- Finland: 81.6 years
- United Kingdom: 81.3 years
- Germany: 81.1 years
- Czechia: 79.9 years
- Albania: 79.6 years
- Estonia: 79.1 years
- Croatia: 78.6 years
- Poland: 78.4 years
- Turkey (European part): ~78.4 years
- Slovakia: 78.2 years
- Kosovo: 78.0 years
- Bosnia and Herzegovina: 77.8 years
- Lithuania: 77.6 years
- Montenegro: 77.6 years
- North Macedonia: 77.4 years
Oklahoma vs Europe
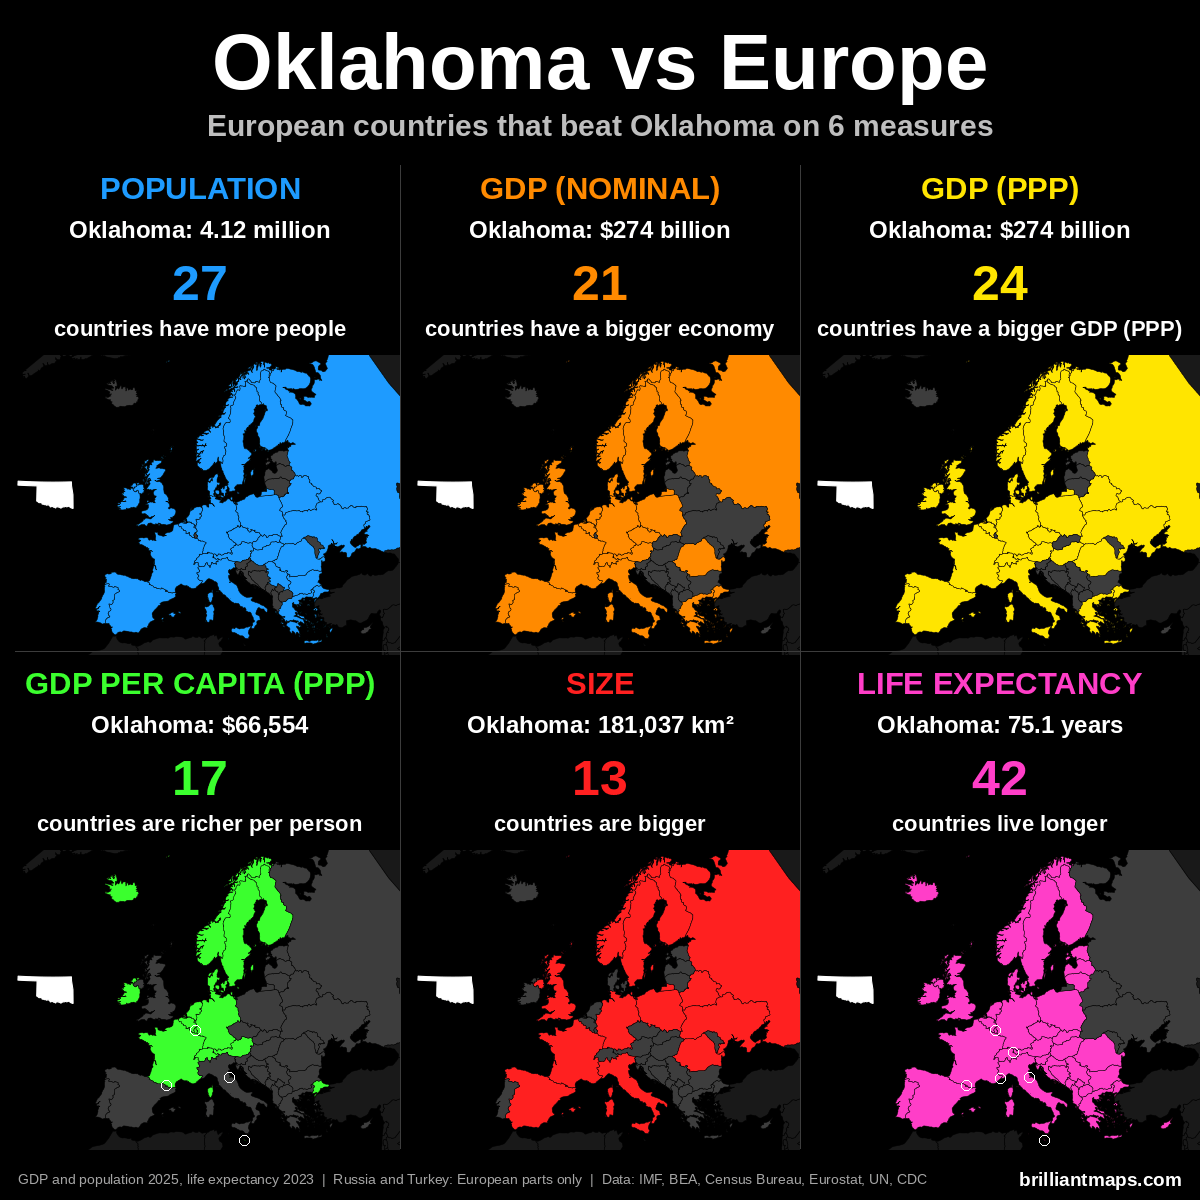
Oklahoma Vs European Population
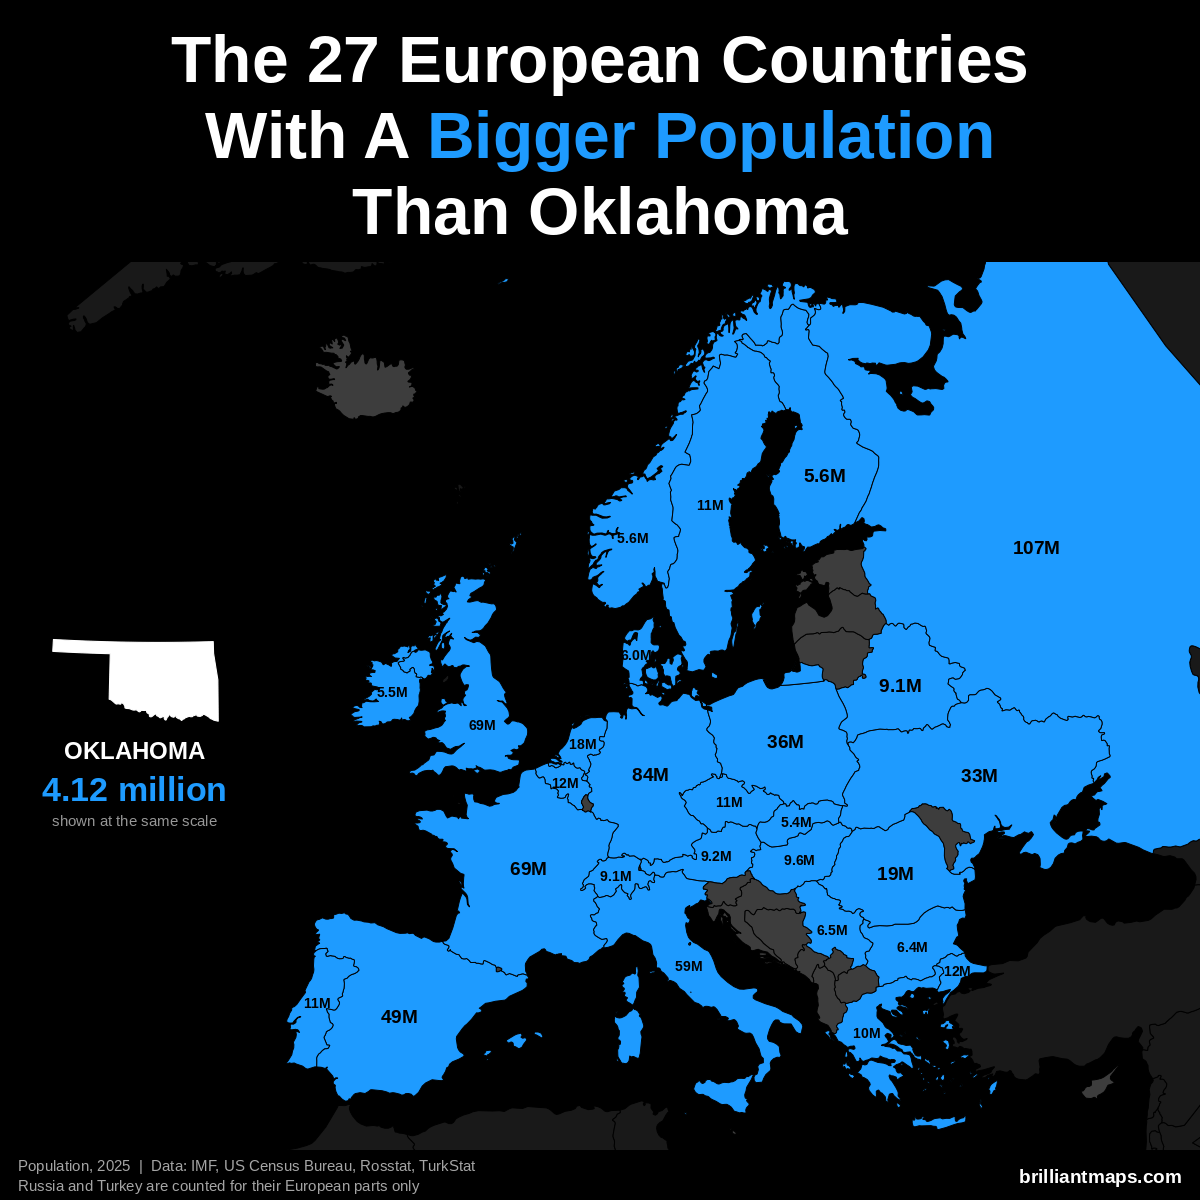
Oklahoma has a population of 4.1 million (2025). 27 European countries have a bigger population:
- Russia (European part): 107.0 million
- Germany: 83.5 million
- United Kingdom: 69.5 million
- France: 68.9 million
- Italy: 58.9 million
- Spain: 49.5 million
- Poland: 36.5 million
- Ukraine: 32.9 million
- Romania: 19.0 million
- Netherlands: 18.0 million
- Turkey (European part): 12.2 million
- Belgium: 11.9 million
- Portugal: 10.8 million
- Czechia: 10.8 million
- Sweden: 10.7 million
- Greece: 10.4 million
- Hungary: 9.6 million
- Austria: 9.2 million
- Belarus: 9.1 million
- Switzerland: 9.1 million
- Serbia: 6.5 million
- Bulgaria: 6.4 million
- Denmark: 6.0 million
- Norway: 5.6 million
- Finland: 5.6 million
- Ireland: 5.5 million
- Slovakia: 5.4 million
Oklahoma Vs European GDP (Nominal)
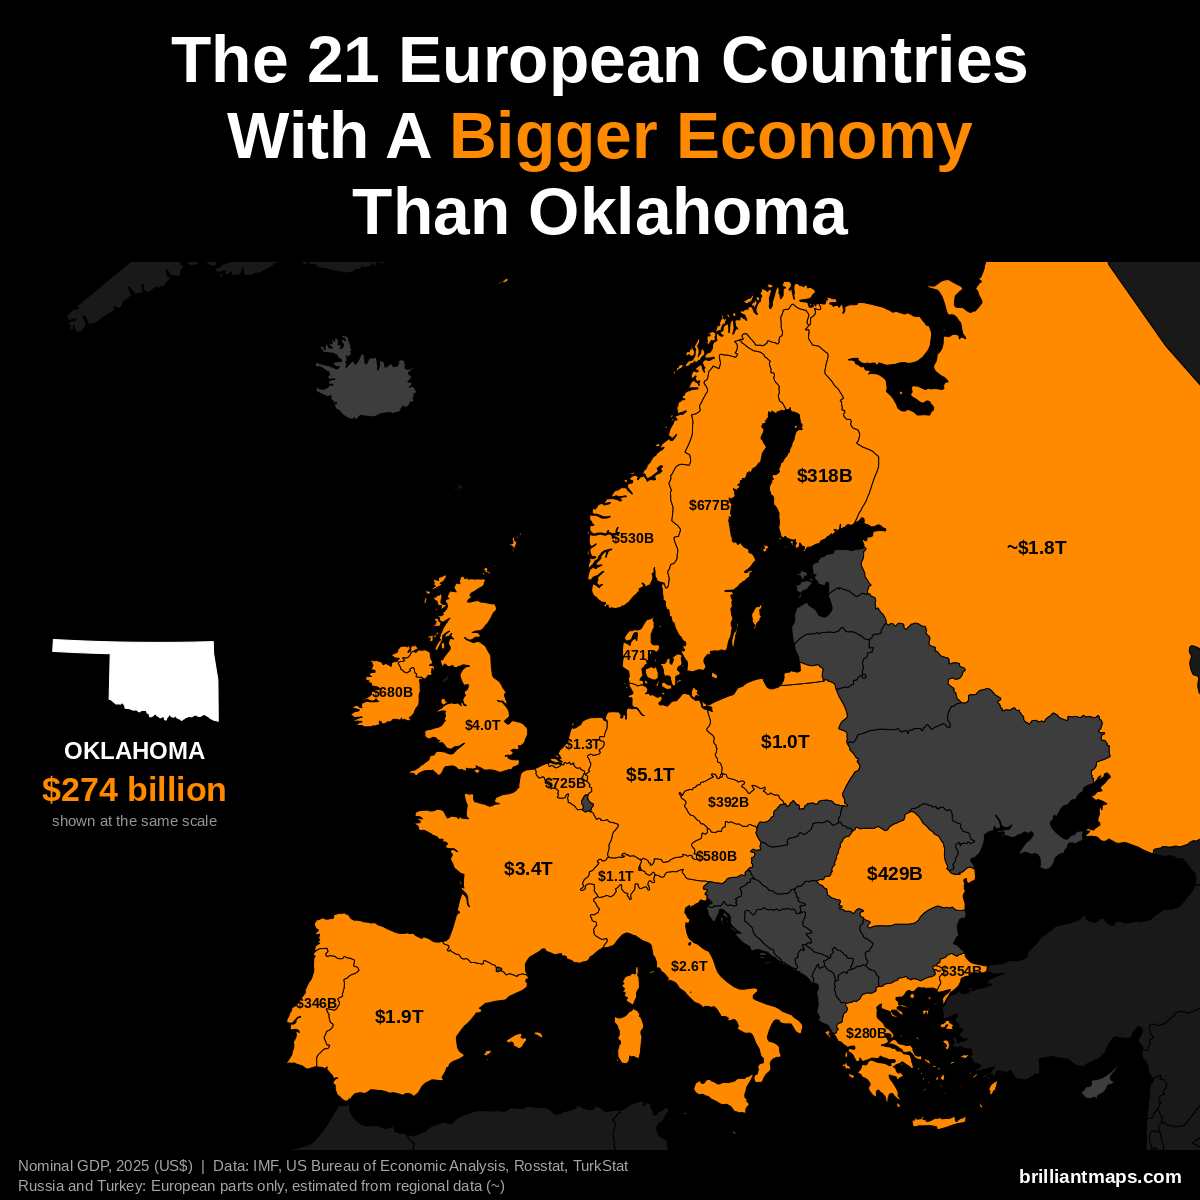
Oklahoma has a nominal GDP of $274 billion (2025). 21 European countries have a bigger economy:
- Germany: $5.12 trillion
- United Kingdom: $4.01 trillion
- France: $3.38 trillion
- Italy: $2.55 trillion
- Spain: $1.91 trillion
- Russia (European part): ~$1.83 trillion
- Netherlands: $1.32 trillion
- Switzerland: $1.06 trillion
- Poland: $1.04 trillion
- Belgium: $725 billion
- Ireland: $680 billion
- Sweden: $677 billion
- Austria: $580 billion
- Norway: $530 billion
- Denmark: $471 billion
- Romania: $429 billion
- Czechia: $392 billion
- Turkey (European part): ~$354 billion
- Portugal: $346 billion
- Finland: $318 billion
- Greece: $280 billion
Oklahoma Vs European GDP (PPP)
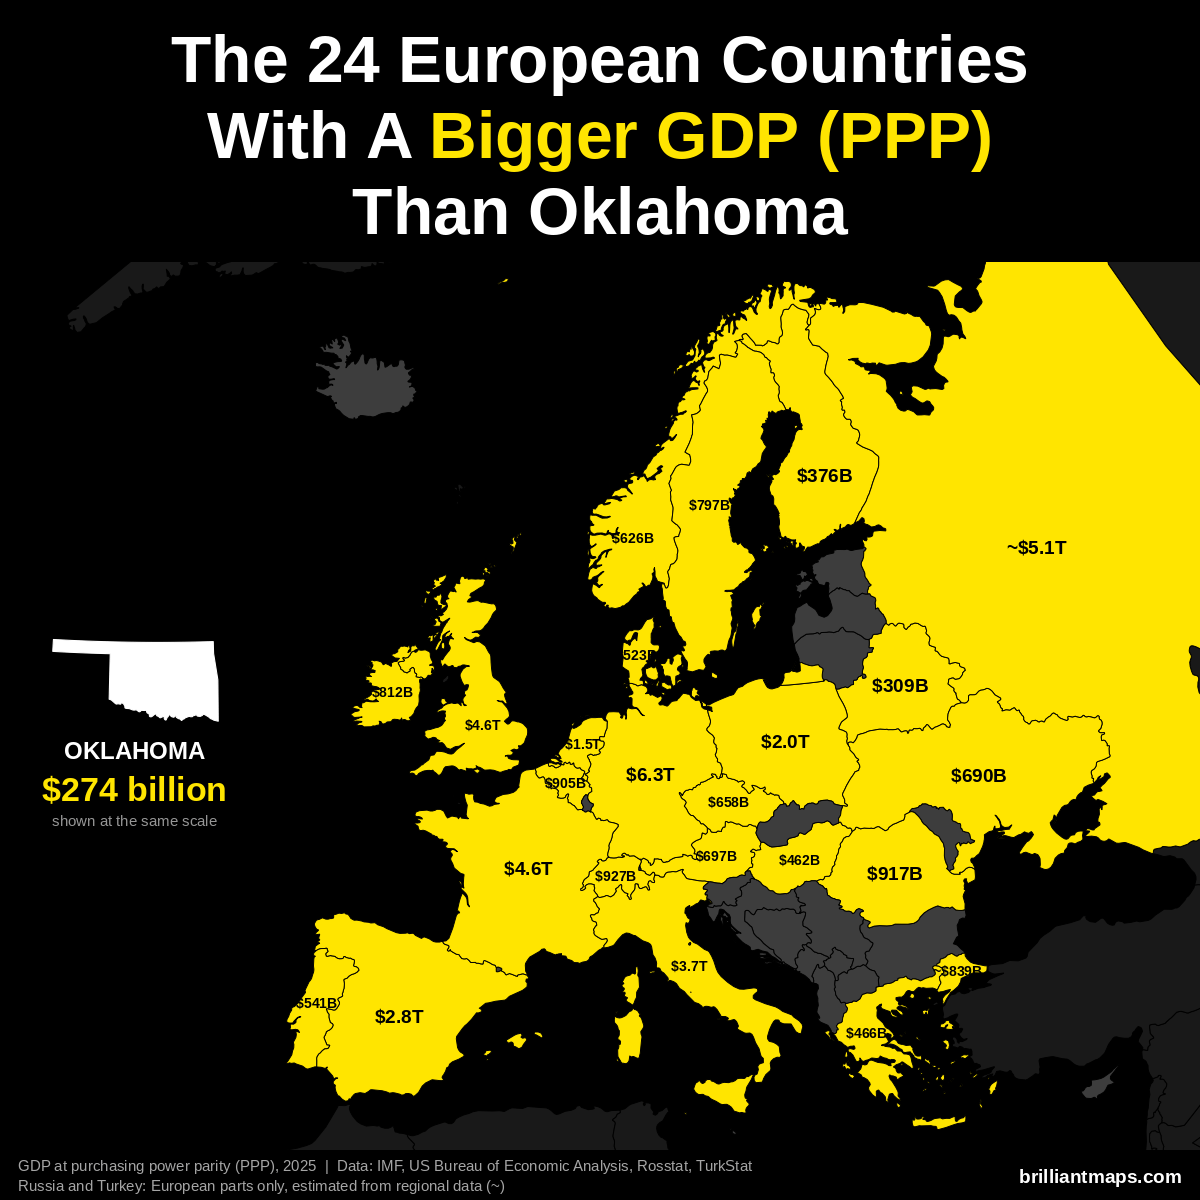
Oklahoma has a GDP of $274 billion (2025). US states are already measured in the dollars PPP is based on, so the figure is the same as nominal GDP. 24 European countries have a bigger GDP at purchasing power parity:
- Germany: $6.26 trillion
- Russia (European part): ~$5.14 trillion
- France: $4.58 trillion
- United Kingdom: $4.57 trillion
- Italy: $3.74 trillion
- Spain: $2.83 trillion
- Poland: $2.04 trillion
- Netherlands: $1.52 trillion
- Switzerland: $927 billion
- Romania: $917 billion
- Belgium: $905 billion
- Turkey (European part): ~$839 billion
- Ireland: $812 billion
- Sweden: $797 billion
- Austria: $697 billion
- Ukraine: $690 billion
- Czechia: $658 billion
- Norway: $626 billion
- Portugal: $541 billion
- Denmark: $523 billion
- Greece: $466 billion
- Hungary: $462 billion
- Finland: $376 billion
- Belarus: $309 billion
Oklahoma Vs European GDP Per Capita (PPP)
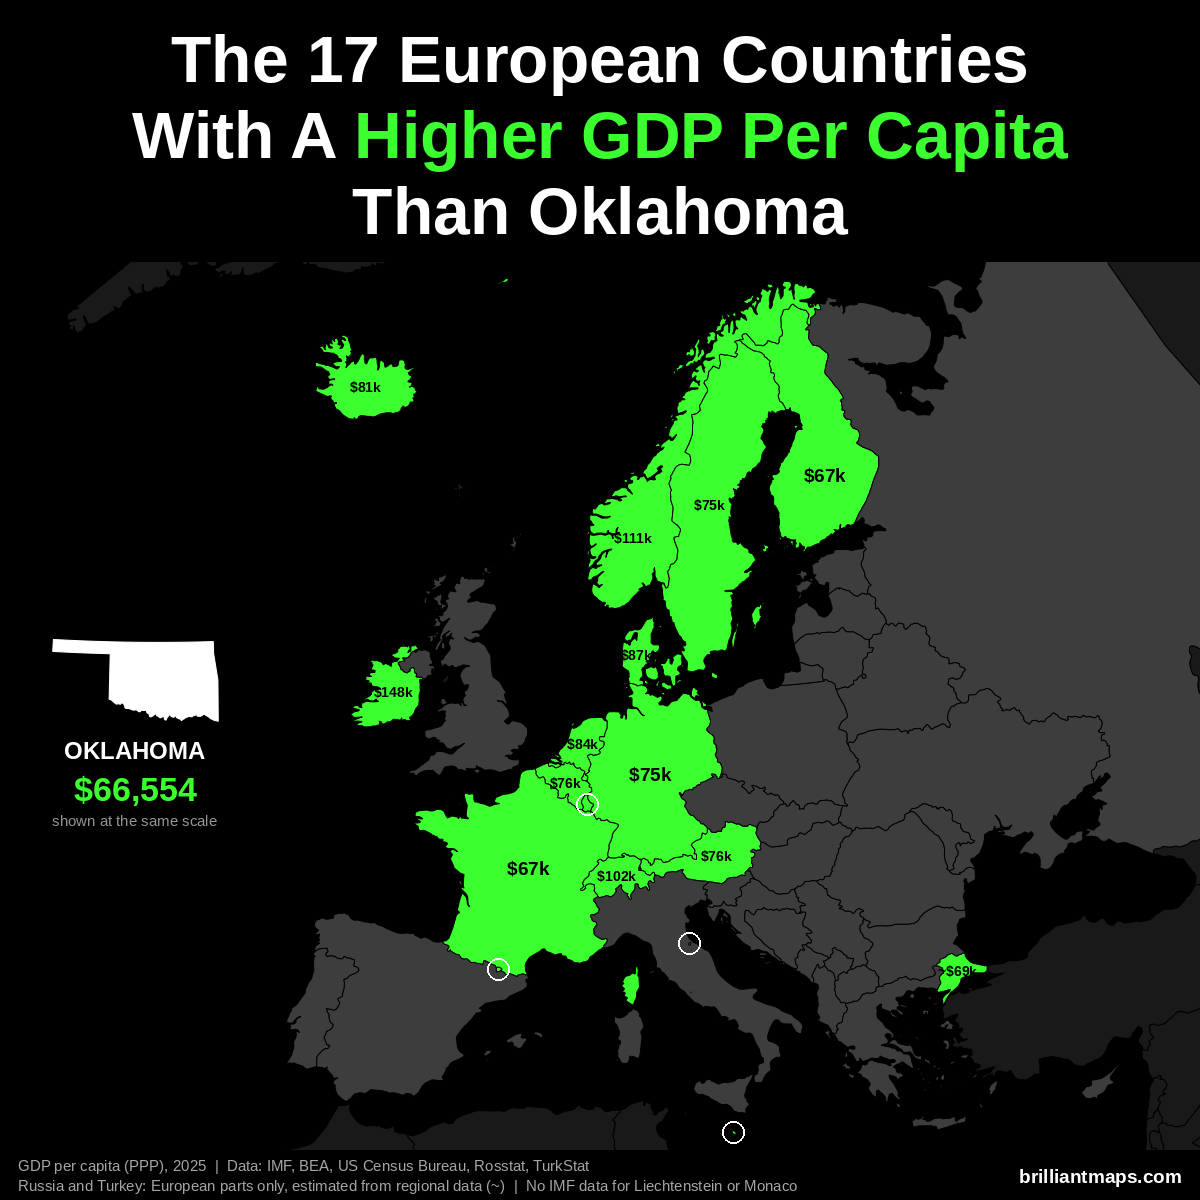
Oklahoma has a GDP per capita of $66,554 (2025). 17 European countries have a higher GDP per capita at purchasing power parity:
- Luxembourg: $152,894
- Ireland: $147,825
- Norway: $111,462
- Switzerland: $102,397
- Denmark: $87,303
- Netherlands: $84,445
- San Marino: $83,838
- Iceland: $80,915
- Belgium: $76,136
- Austria: $75,965
- Malta: $75,687
- Germany: $74,901
- Sweden: $74,651
- Andorra: $74,059
- Turkey (European part): ~$68,800
- Finland: $67,097
- France: $66,559
Liechtenstein and Monaco are not covered by the IMF data and are not counted here.
Oklahoma Vs European Size
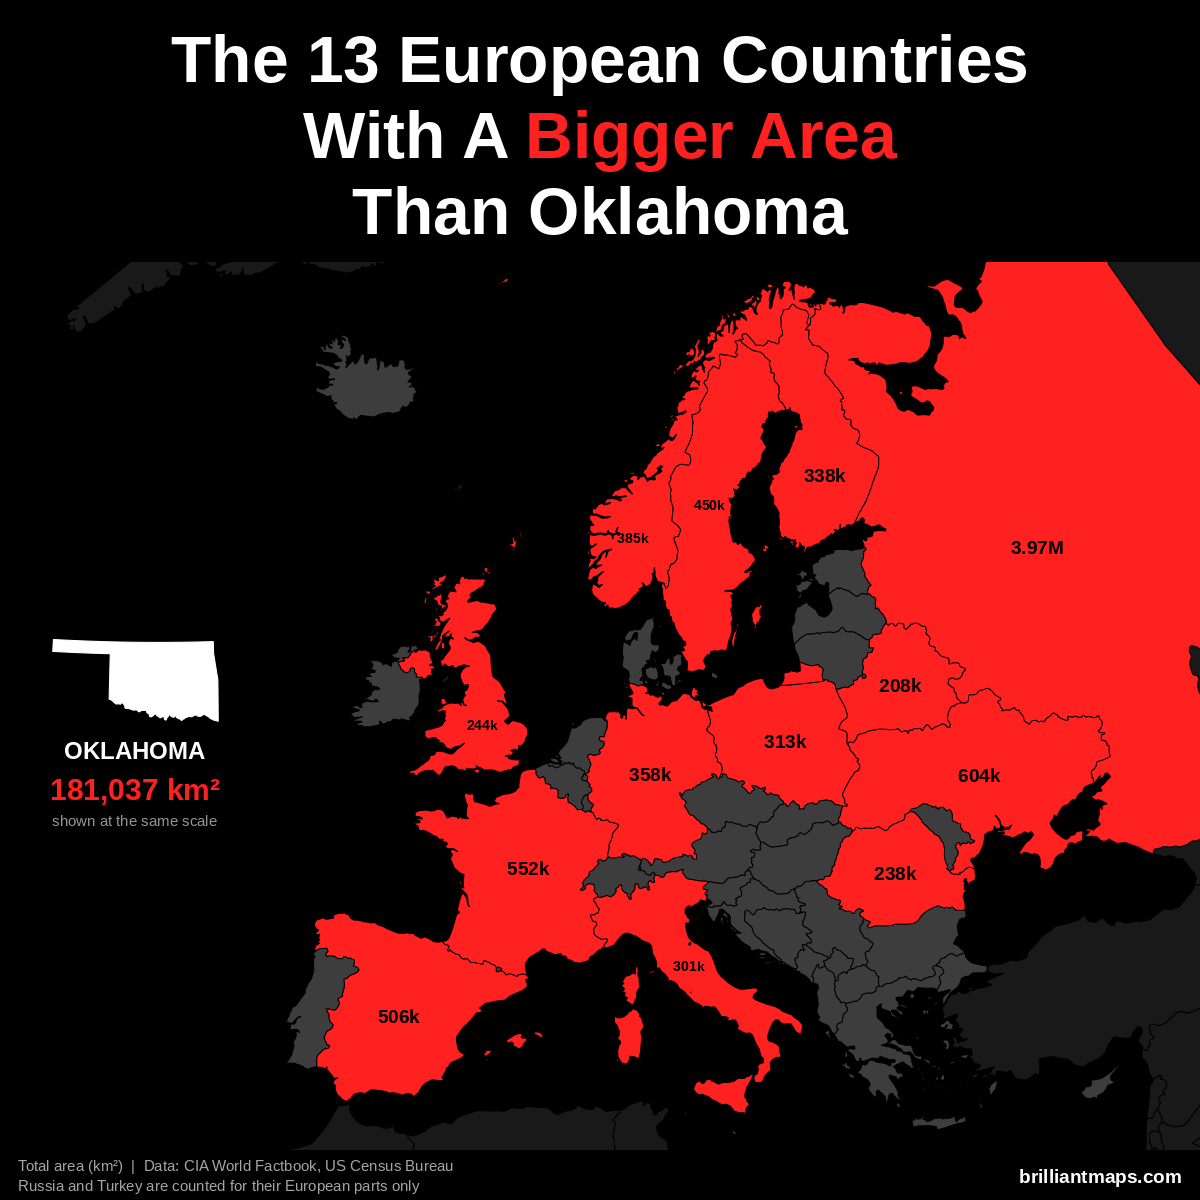
Oklahoma has a total area of 181,037 km² (69,899 sq mi). 13 European countries have a bigger area:
- Russia (European part): 3,969,100 km² (1,532,477 sq mi)
- Ukraine: 603,550 km² (233,032 sq mi)
- France: 551,695 km² (213,010 sq mi)
- Spain: 505,990 km² (195,364 sq mi)
- Sweden: 450,295 km² (173,860 sq mi)
- Norway: 385,207 km² (148,729 sq mi)
- Germany: 357,588 km² (138,065 sq mi)
- Finland: 338,455 km² (130,678 sq mi)
- Poland: 312,696 km² (120,733 sq mi)
- Italy: 301,340 km² (116,348 sq mi)
- United Kingdom: 243,610 km² (94,058 sq mi)
- Romania: 238,397 km² (92,046 sq mi)
- Belarus: 207,600 km² (80,155 sq mi)
Oklahoma Vs European Life Expectancy
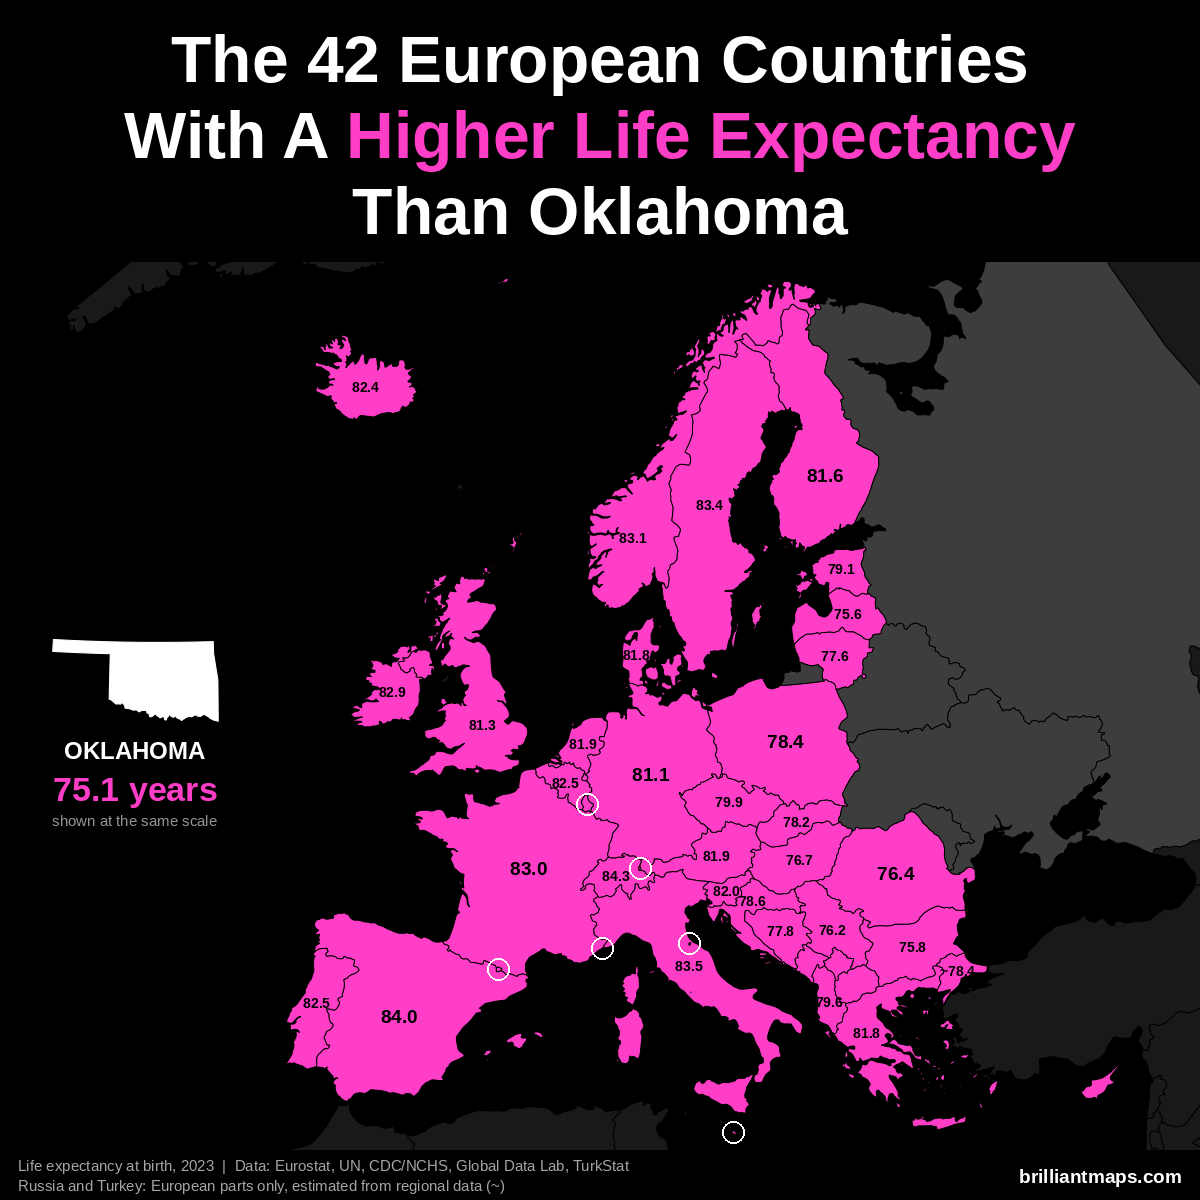
Oklahoma has a life expectancy at birth of 75.1 years (2023). 42 European countries have a higher life expectancy:
- Monaco: 86.4 years
- San Marino: 85.7 years
- Liechtenstein: 84.6 years
- Switzerland: 84.3 years
- Andorra: 84.0 years
- Spain: 84.0 years
- Italy: 83.5 years
- Luxembourg: 83.4 years
- Malta: 83.4 years
- Sweden: 83.4 years
- Norway: 83.1 years
- France: 83.0 years
- Cyprus: 82.9 years
- Ireland: 82.9 years
- Belgium: 82.5 years
- Portugal: 82.5 years
- Iceland: 82.4 years
- Slovenia: 82.0 years
- Austria: 81.9 years
- Netherlands: 81.9 years
- Denmark: 81.8 years
- Greece: 81.8 years
- Finland: 81.6 years
- United Kingdom: 81.3 years
- Germany: 81.1 years
- Czechia: 79.9 years
- Albania: 79.6 years
- Estonia: 79.1 years
- Croatia: 78.6 years
- Poland: 78.4 years
- Turkey (European part): ~78.4 years
- Slovakia: 78.2 years
- Kosovo: 78.0 years
- Bosnia and Herzegovina: 77.8 years
- Lithuania: 77.6 years
- Montenegro: 77.6 years
- North Macedonia: 77.4 years
- Hungary: 76.7 years
- Romania: 76.4 years
- Serbia: 76.2 years
- Bulgaria: 75.8 years
- Latvia: 75.6 years
Oregon vs Europe
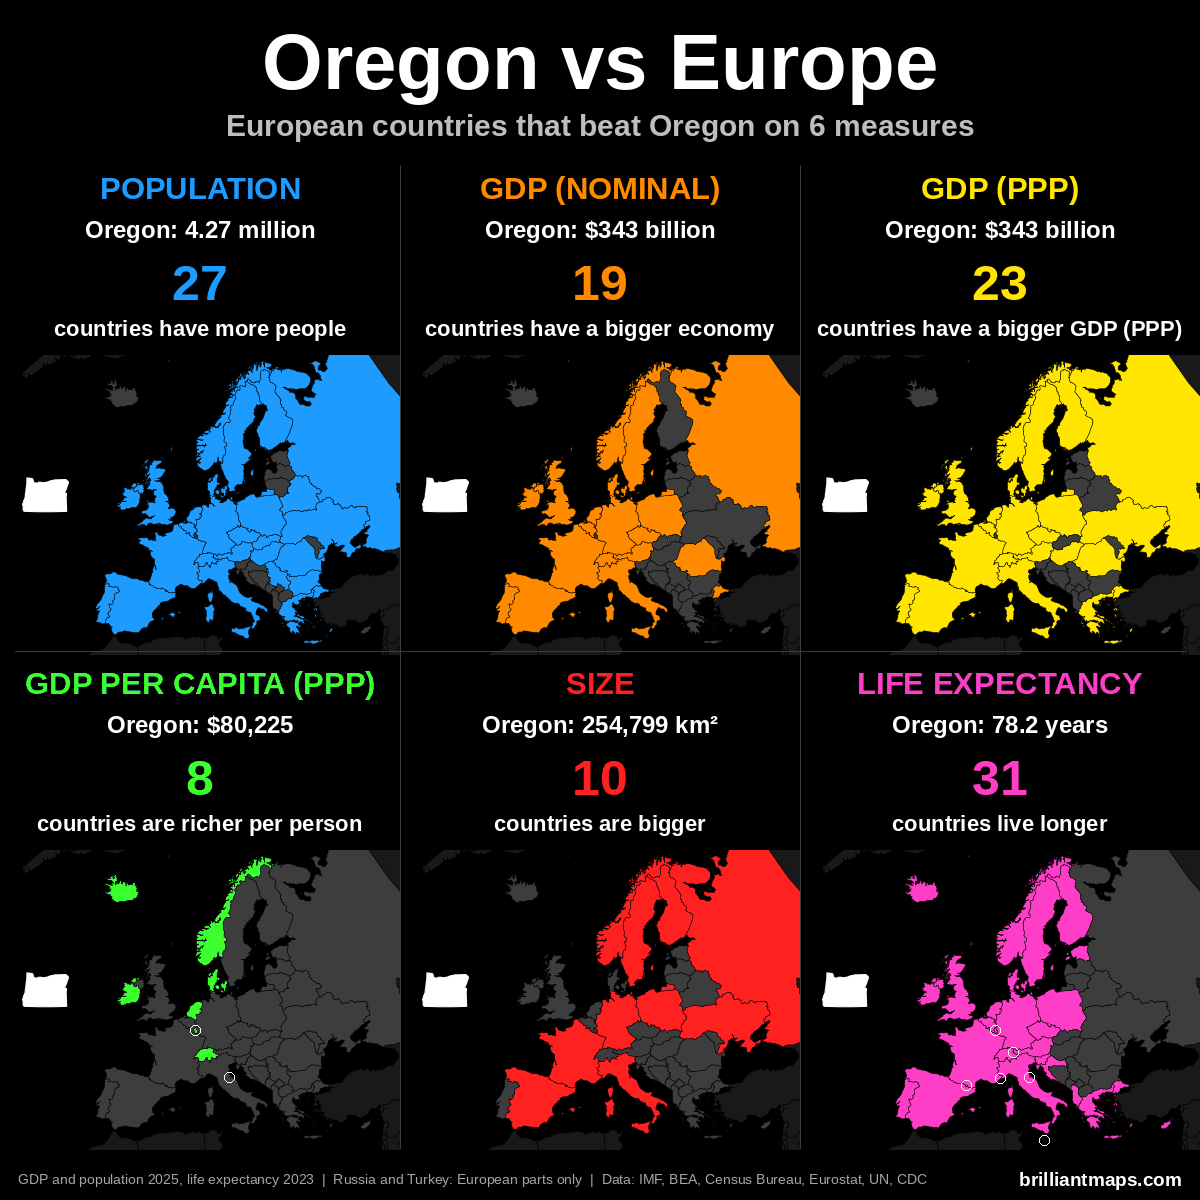
Oregon Vs European Population
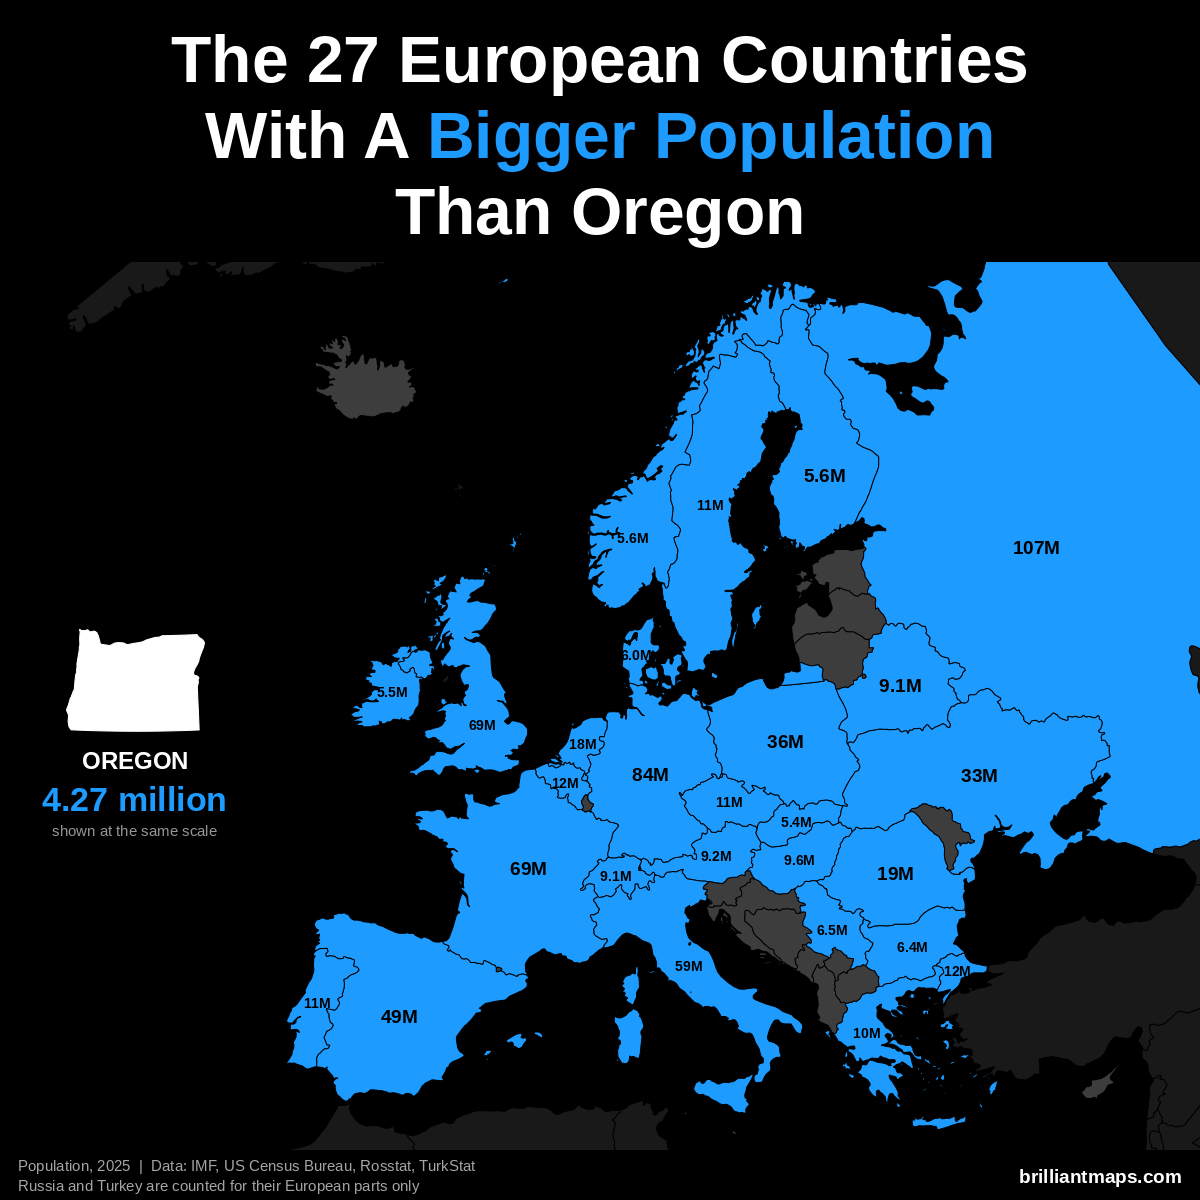
Oregon has a population of 4.3 million (2025). 27 European countries have a bigger population:
- Russia (European part): 107.0 million
- Germany: 83.5 million
- United Kingdom: 69.5 million
- France: 68.9 million
- Italy: 58.9 million
- Spain: 49.5 million
- Poland: 36.5 million
- Ukraine: 32.9 million
- Romania: 19.0 million
- Netherlands: 18.0 million
- Turkey (European part): 12.2 million
- Belgium: 11.9 million
- Portugal: 10.8 million
- Czechia: 10.8 million
- Sweden: 10.7 million
- Greece: 10.4 million
- Hungary: 9.6 million
- Austria: 9.2 million
- Belarus: 9.1 million
- Switzerland: 9.1 million
- Serbia: 6.5 million
- Bulgaria: 6.4 million
- Denmark: 6.0 million
- Norway: 5.6 million
- Finland: 5.6 million
- Ireland: 5.5 million
- Slovakia: 5.4 million
Oregon Vs European GDP (Nominal)
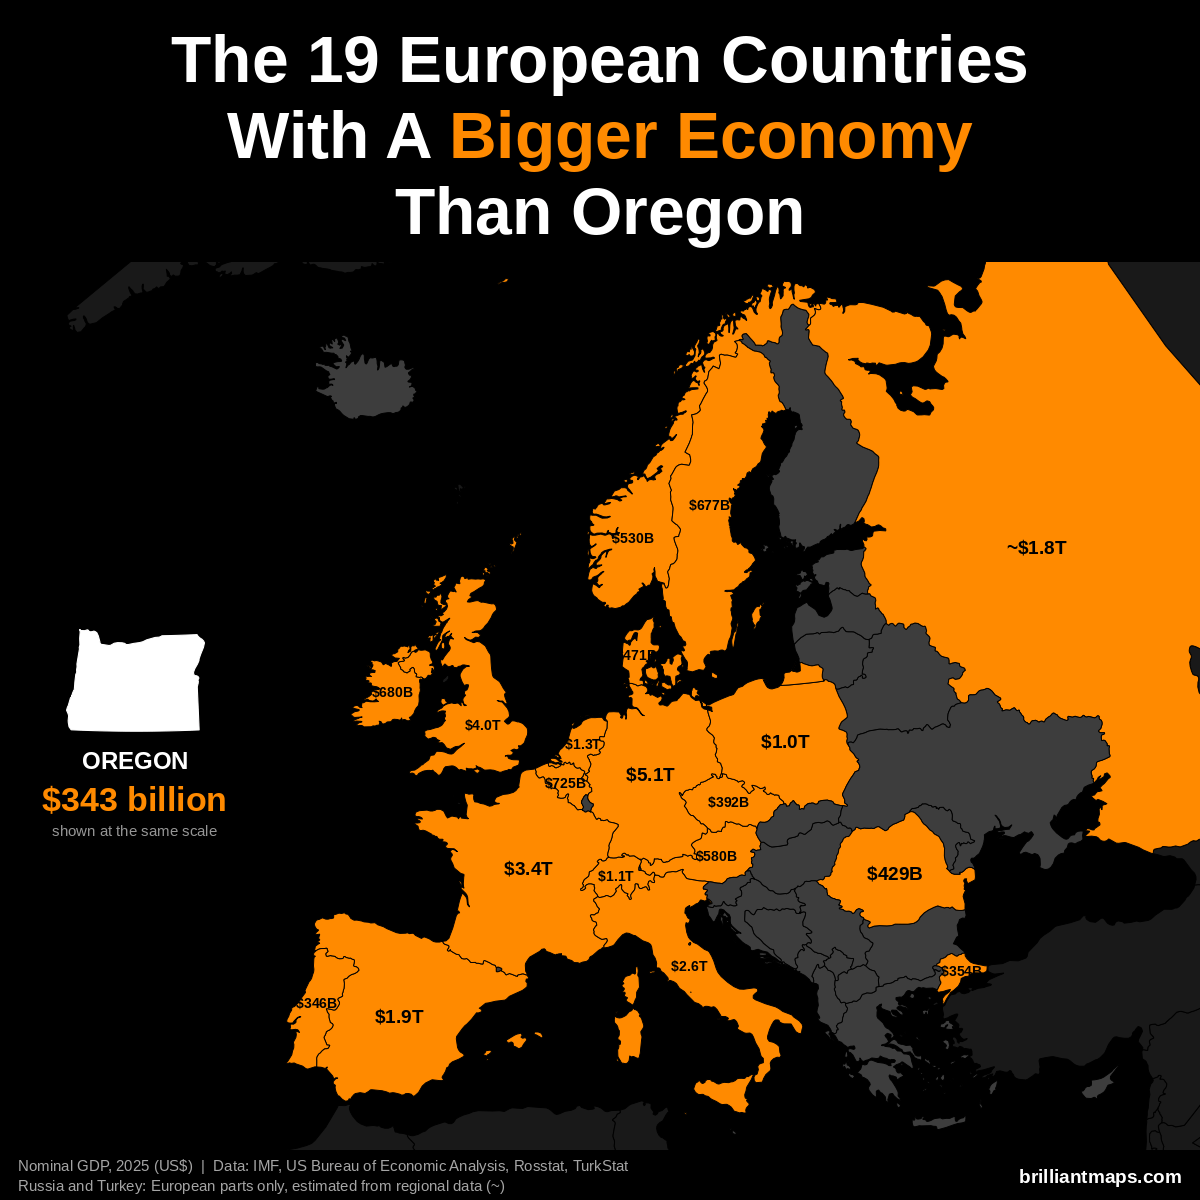
Oregon has a nominal GDP of $343 billion (2025). 19 European countries have a bigger economy:
- Germany: $5.12 trillion
- United Kingdom: $4.01 trillion
- France: $3.38 trillion
- Italy: $2.55 trillion
- Spain: $1.91 trillion
- Russia (European part): ~$1.83 trillion
- Netherlands: $1.32 trillion
- Switzerland: $1.06 trillion
- Poland: $1.04 trillion
- Belgium: $725 billion
- Ireland: $680 billion
- Sweden: $677 billion
- Austria: $580 billion
- Norway: $530 billion
- Denmark: $471 billion
- Romania: $429 billion
- Czechia: $392 billion
- Turkey (European part): ~$354 billion
- Portugal: $346 billion
Oregon Vs European GDP (PPP)
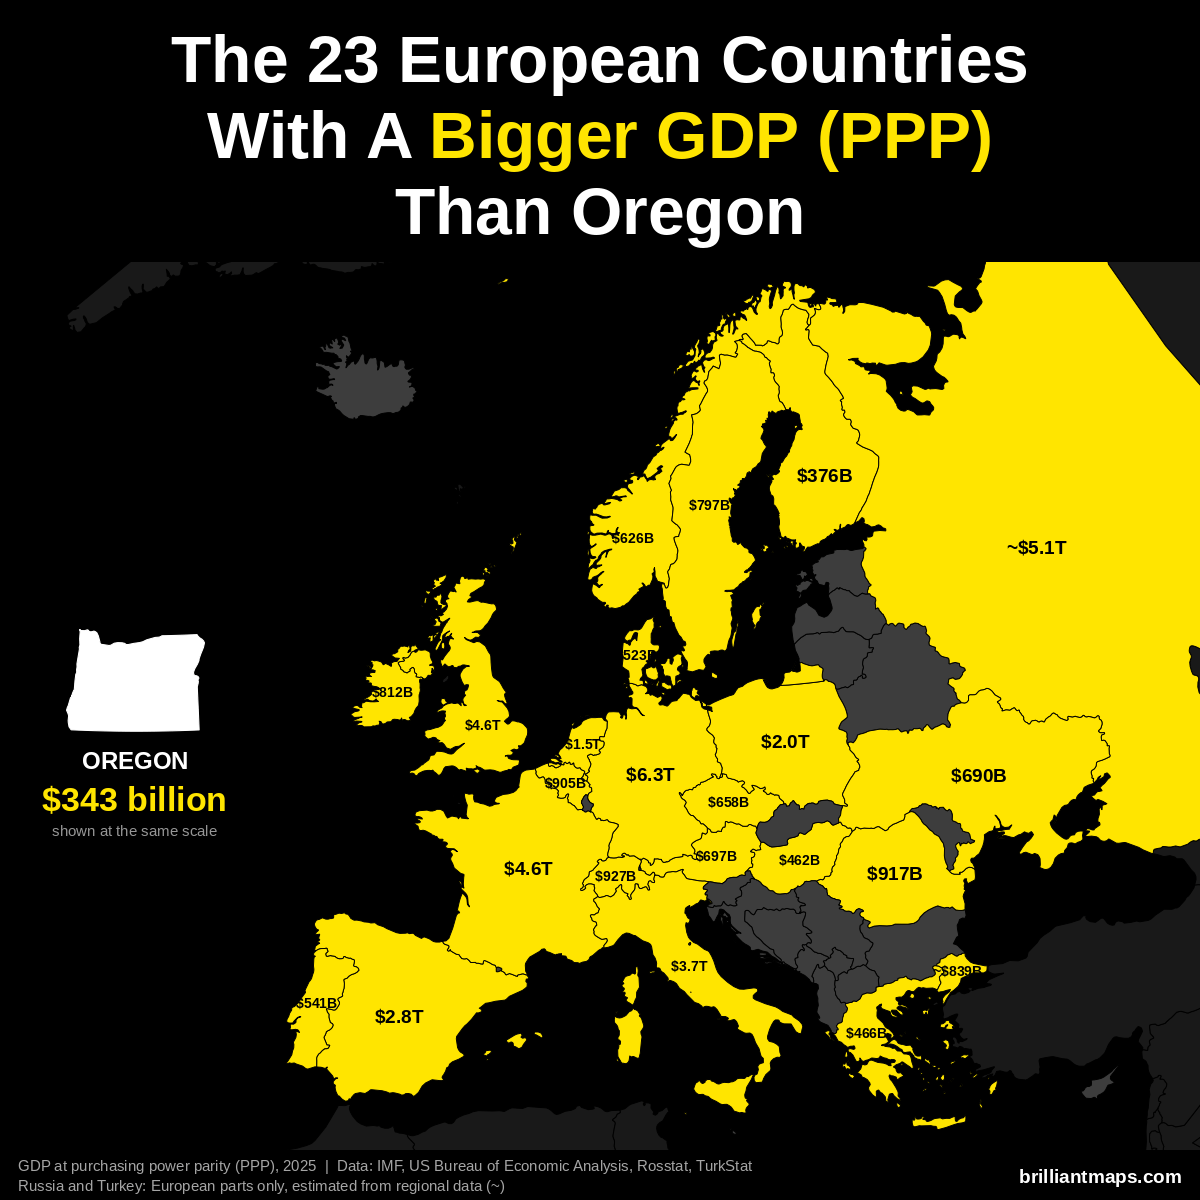
Oregon has a GDP of $343 billion (2025). US states are already measured in the dollars PPP is based on, so the figure is the same as nominal GDP. 23 European countries have a bigger GDP at purchasing power parity:
- Germany: $6.26 trillion
- Russia (European part): ~$5.14 trillion
- France: $4.58 trillion
- United Kingdom: $4.57 trillion
- Italy: $3.74 trillion
- Spain: $2.83 trillion
- Poland: $2.04 trillion
- Netherlands: $1.52 trillion
- Switzerland: $927 billion
- Romania: $917 billion
- Belgium: $905 billion
- Turkey (European part): ~$839 billion
- Ireland: $812 billion
- Sweden: $797 billion
- Austria: $697 billion
- Ukraine: $690 billion
- Czechia: $658 billion
- Norway: $626 billion
- Portugal: $541 billion
- Denmark: $523 billion
- Greece: $466 billion
- Hungary: $462 billion
- Finland: $376 billion
Oregon Vs European GDP Per Capita (PPP)
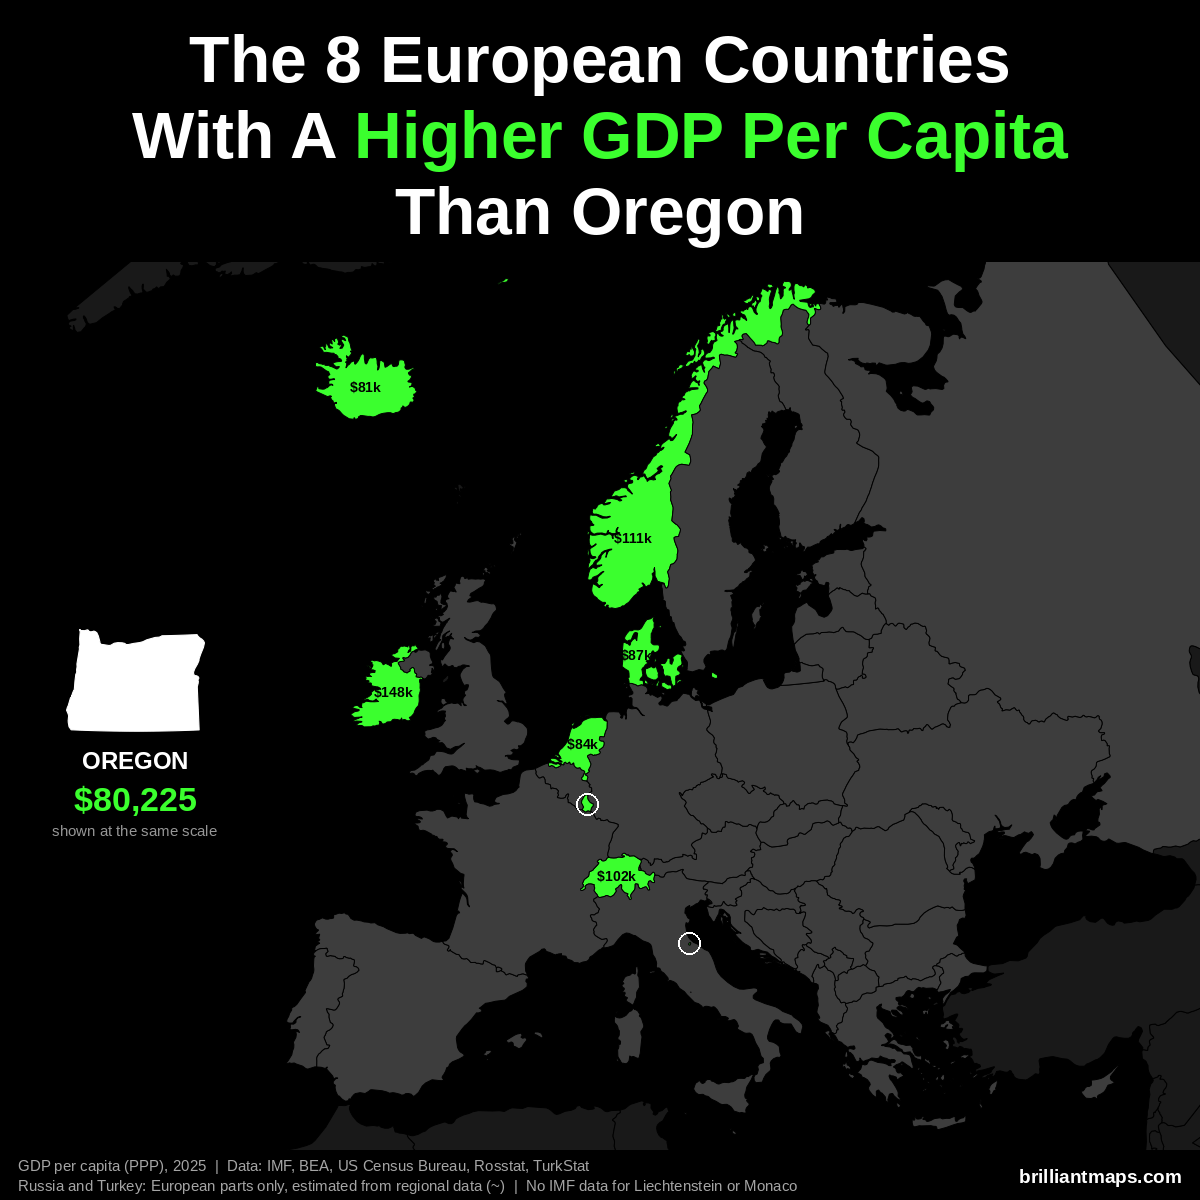
Oregon has a GDP per capita of $80,225 (2025). 8 European countries have a higher GDP per capita at purchasing power parity:
- Luxembourg: $152,894
- Ireland: $147,825
- Norway: $111,462
- Switzerland: $102,397
- Denmark: $87,303
- Netherlands: $84,445
- San Marino: $83,838
- Iceland: $80,915
Liechtenstein and Monaco are not covered by the IMF data and are not counted here.
Oregon Vs European Size
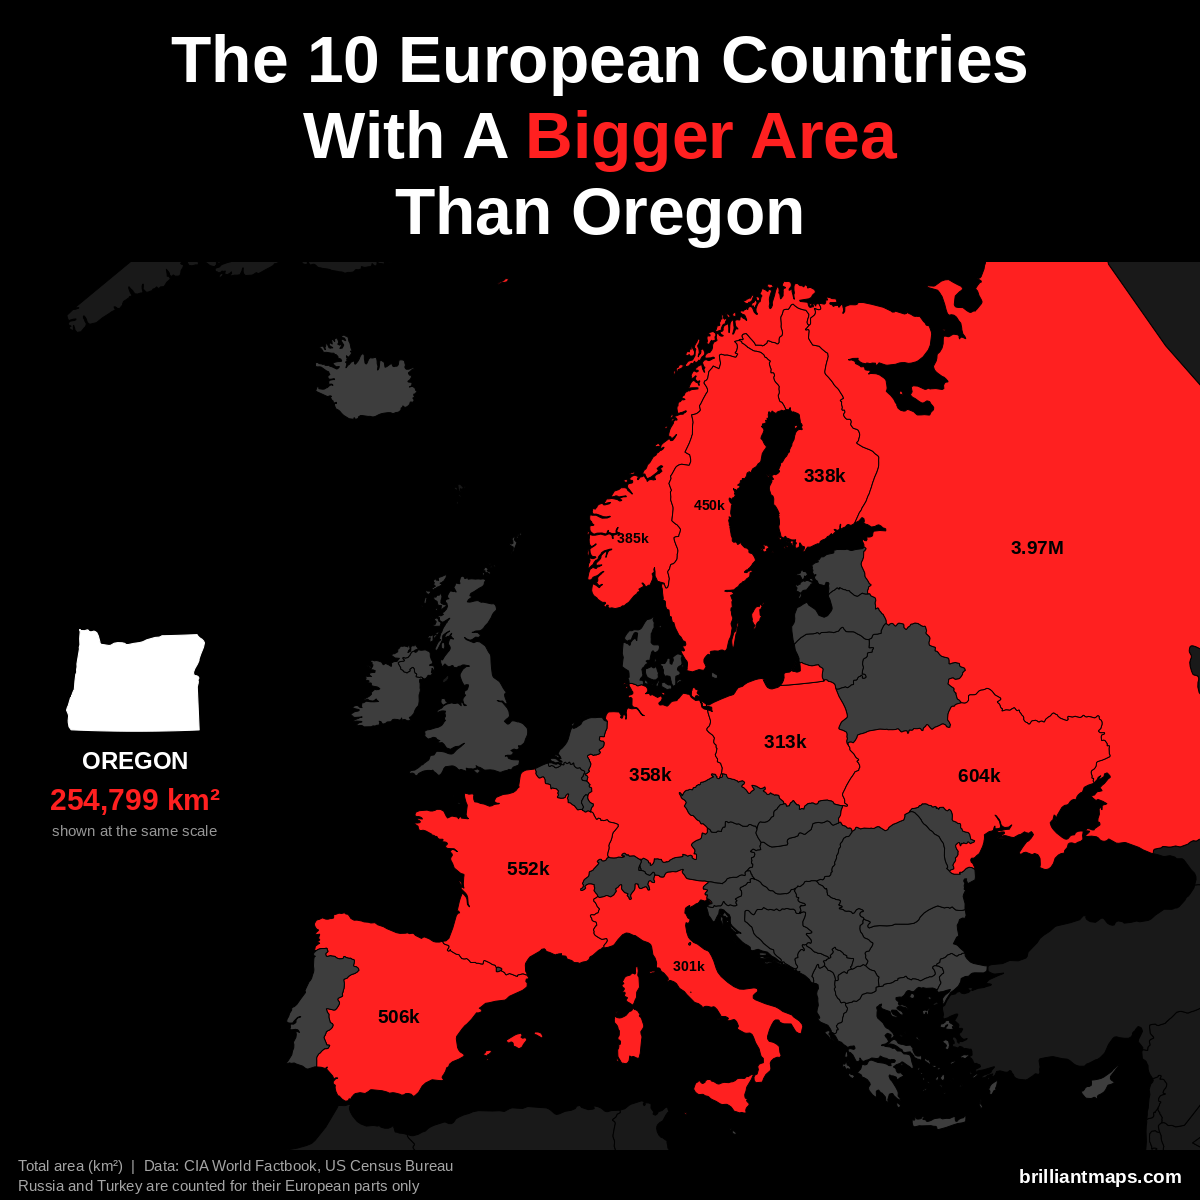
Oregon has a total area of 254,799 km² (98,378 sq mi). 10 European countries have a bigger area:
- Russia (European part): 3,969,100 km² (1,532,477 sq mi)
- Ukraine: 603,550 km² (233,032 sq mi)
- France: 551,695 km² (213,010 sq mi)
- Spain: 505,990 km² (195,364 sq mi)
- Sweden: 450,295 km² (173,860 sq mi)
- Norway: 385,207 km² (148,729 sq mi)
- Germany: 357,588 km² (138,065 sq mi)
- Finland: 338,455 km² (130,678 sq mi)
- Poland: 312,696 km² (120,733 sq mi)
- Italy: 301,340 km² (116,348 sq mi)
Oregon Vs European Life Expectancy
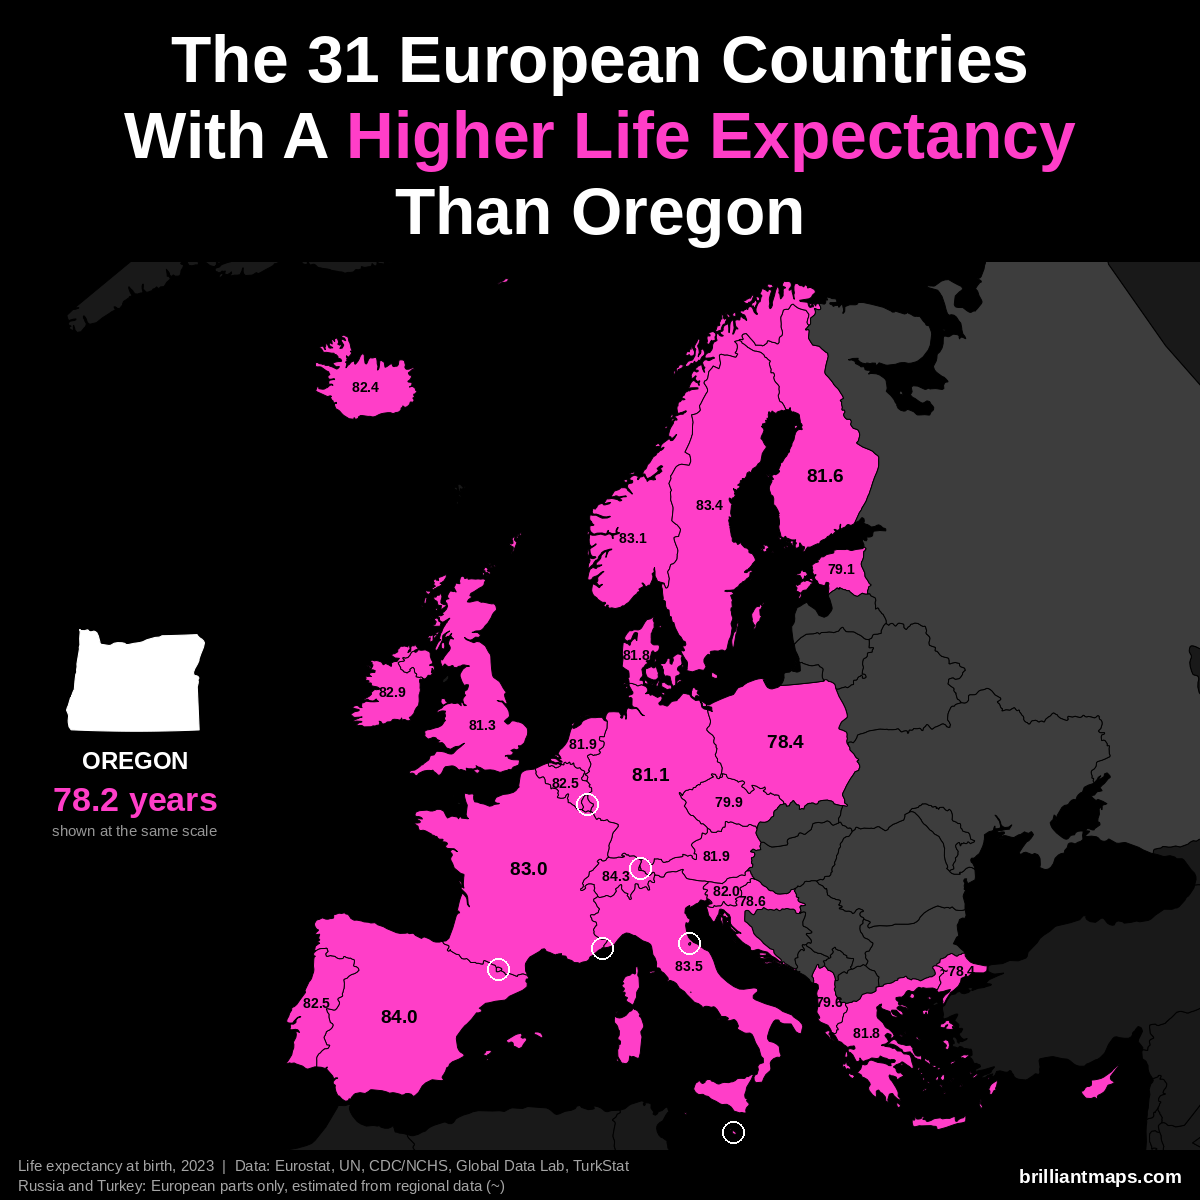
Oregon has a life expectancy at birth of 78.2 years (2023). 31 European countries have a higher life expectancy:
- Monaco: 86.4 years
- San Marino: 85.7 years
- Liechtenstein: 84.6 years
- Switzerland: 84.3 years
- Andorra: 84.0 years
- Spain: 84.0 years
- Italy: 83.5 years
- Luxembourg: 83.4 years
- Malta: 83.4 years
- Sweden: 83.4 years
- Norway: 83.1 years
- France: 83.0 years
- Cyprus: 82.9 years
- Ireland: 82.9 years
- Belgium: 82.5 years
- Portugal: 82.5 years
- Iceland: 82.4 years
- Slovenia: 82.0 years
- Austria: 81.9 years
- Netherlands: 81.9 years
- Denmark: 81.8 years
- Greece: 81.8 years
- Finland: 81.6 years
- United Kingdom: 81.3 years
- Germany: 81.1 years
- Czechia: 79.9 years
- Albania: 79.6 years
- Estonia: 79.1 years
- Croatia: 78.6 years
- Poland: 78.4 years
- Turkey (European part): ~78.4 years
Pennsylvania vs Europe
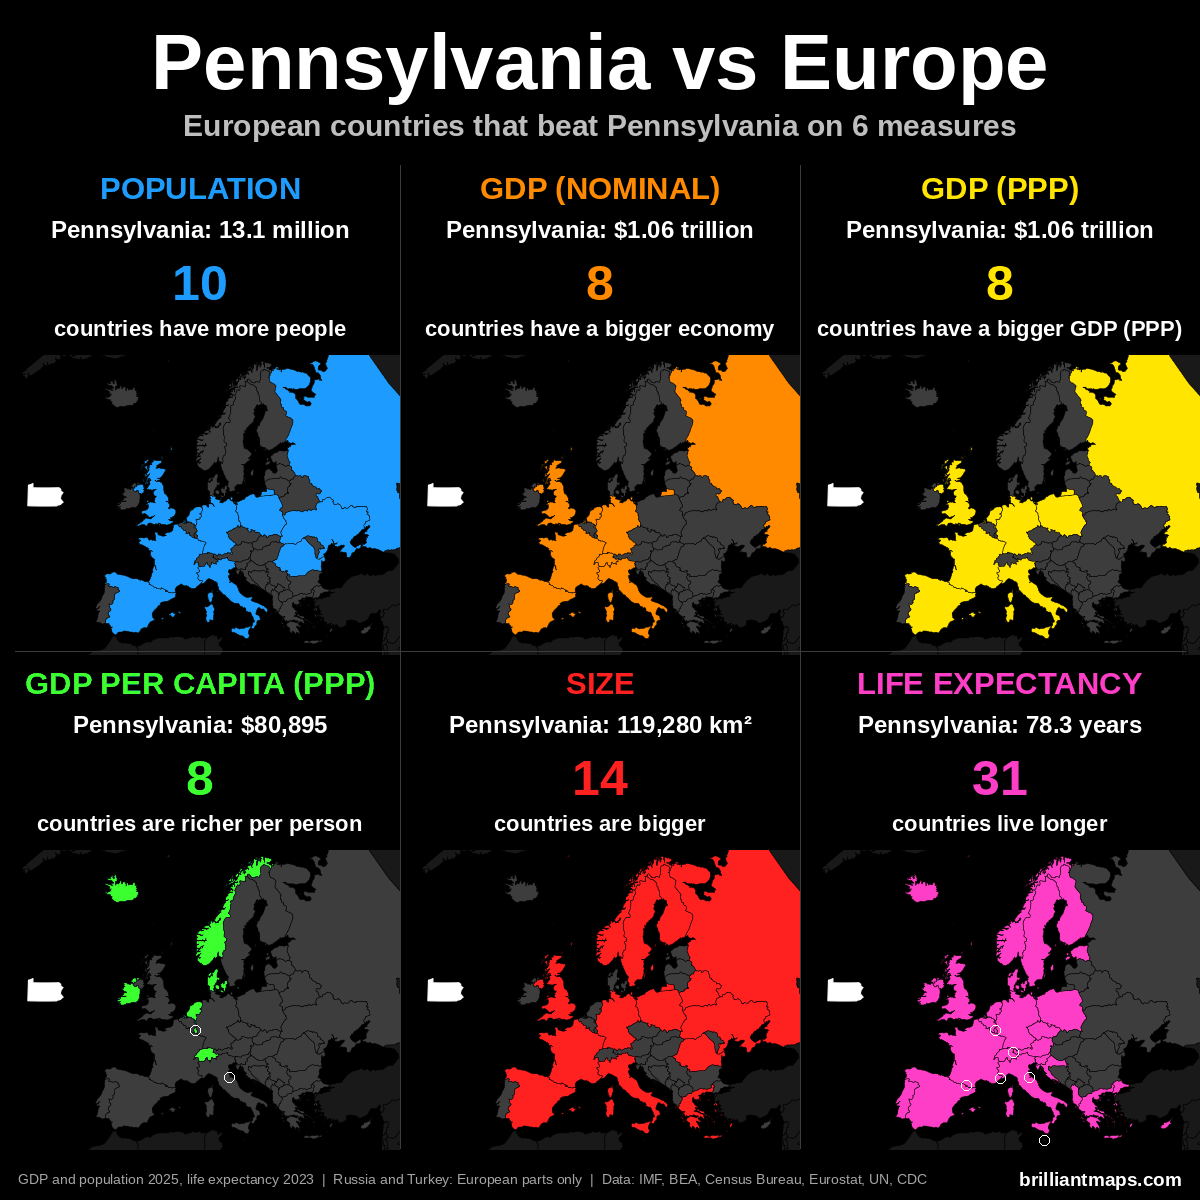
Pennsylvania Vs European Population
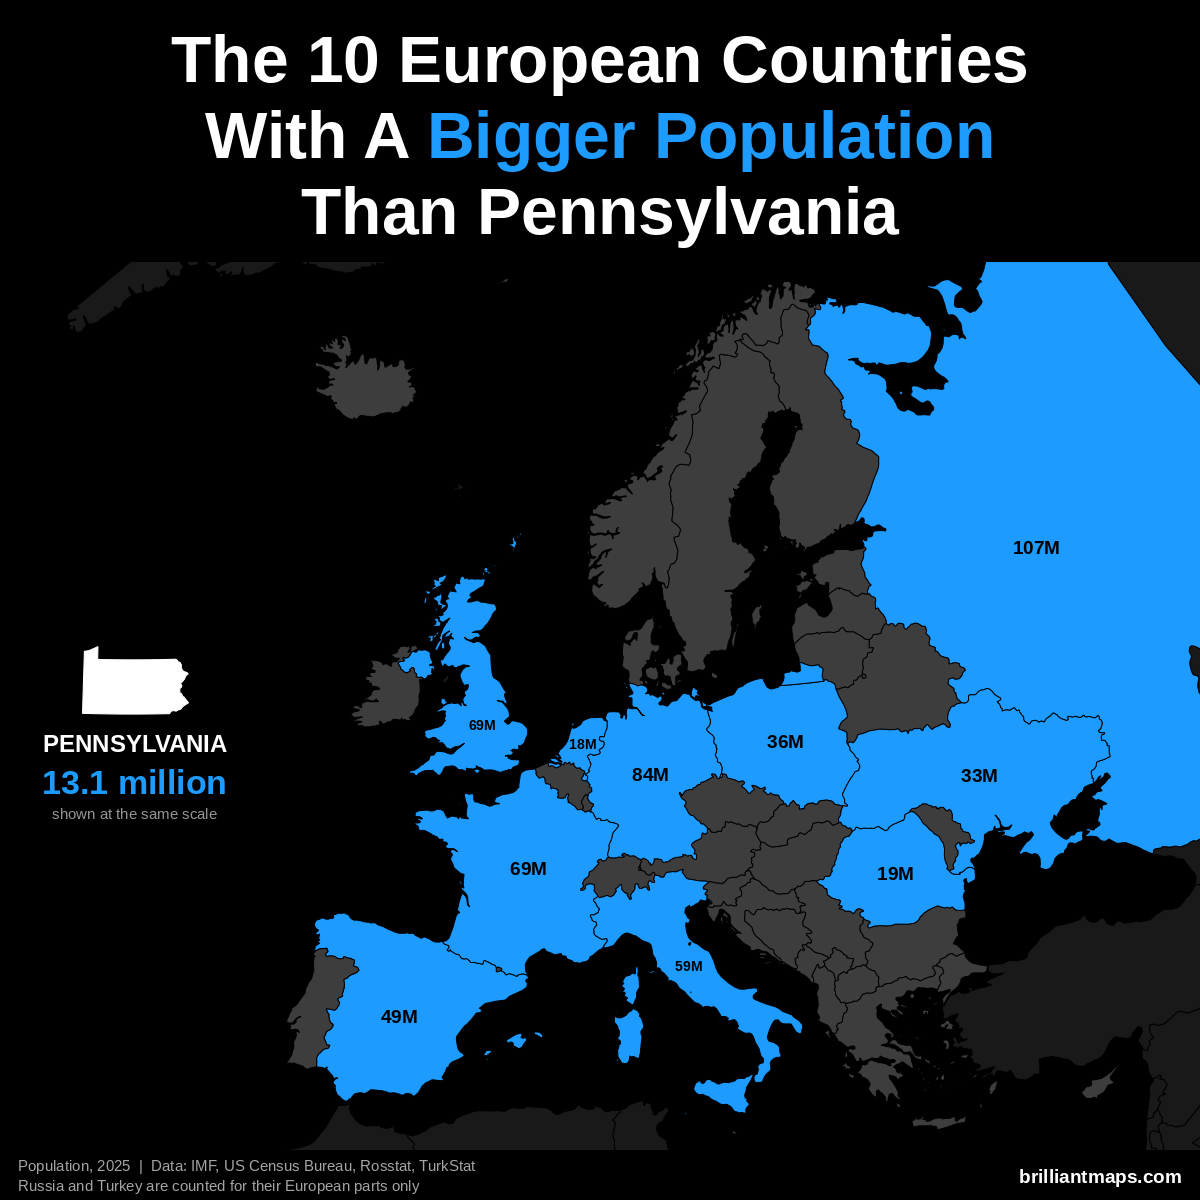
Pennsylvania has a population of 13.1 million (2025). 10 European countries have a bigger population:
- Russia (European part): 107.0 million
- Germany: 83.5 million
- United Kingdom: 69.5 million
- France: 68.9 million
- Italy: 58.9 million
- Spain: 49.5 million
- Poland: 36.5 million
- Ukraine: 32.9 million
- Romania: 19.0 million
- Netherlands: 18.0 million
Pennsylvania Vs European GDP (Nominal)
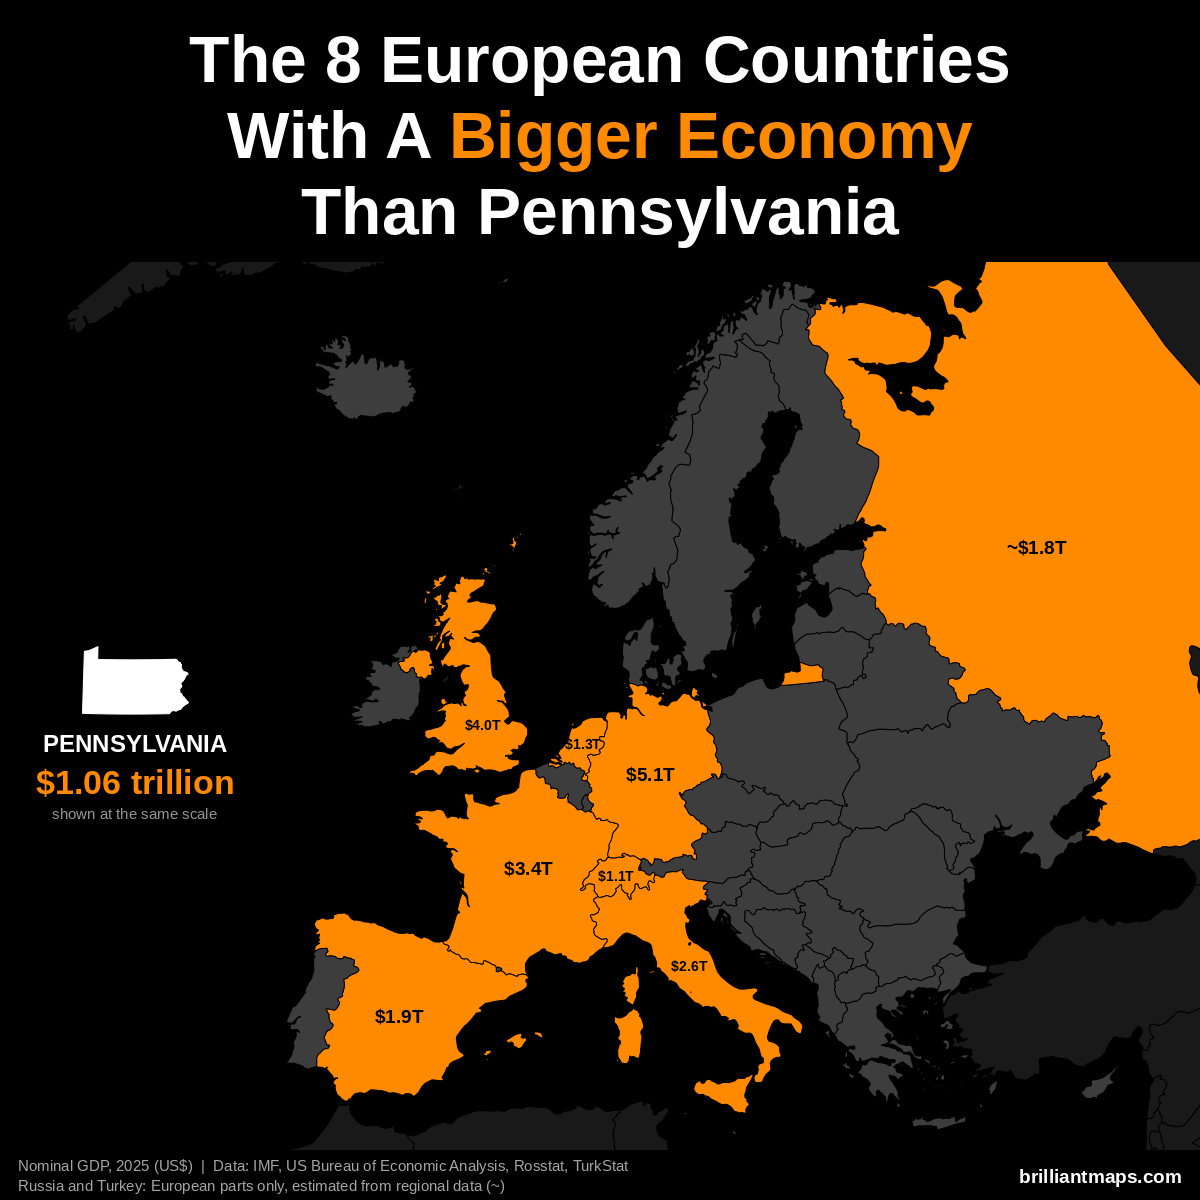
Pennsylvania has a nominal GDP of $1.06 trillion (2025). 8 European countries have a bigger economy:
- Germany: $5.12 trillion
- United Kingdom: $4.01 trillion
- France: $3.38 trillion
- Italy: $2.55 trillion
- Spain: $1.91 trillion
- Russia (European part): ~$1.83 trillion
- Netherlands: $1.32 trillion
- Switzerland: $1.06 trillion
Pennsylvania Vs European GDP (PPP)
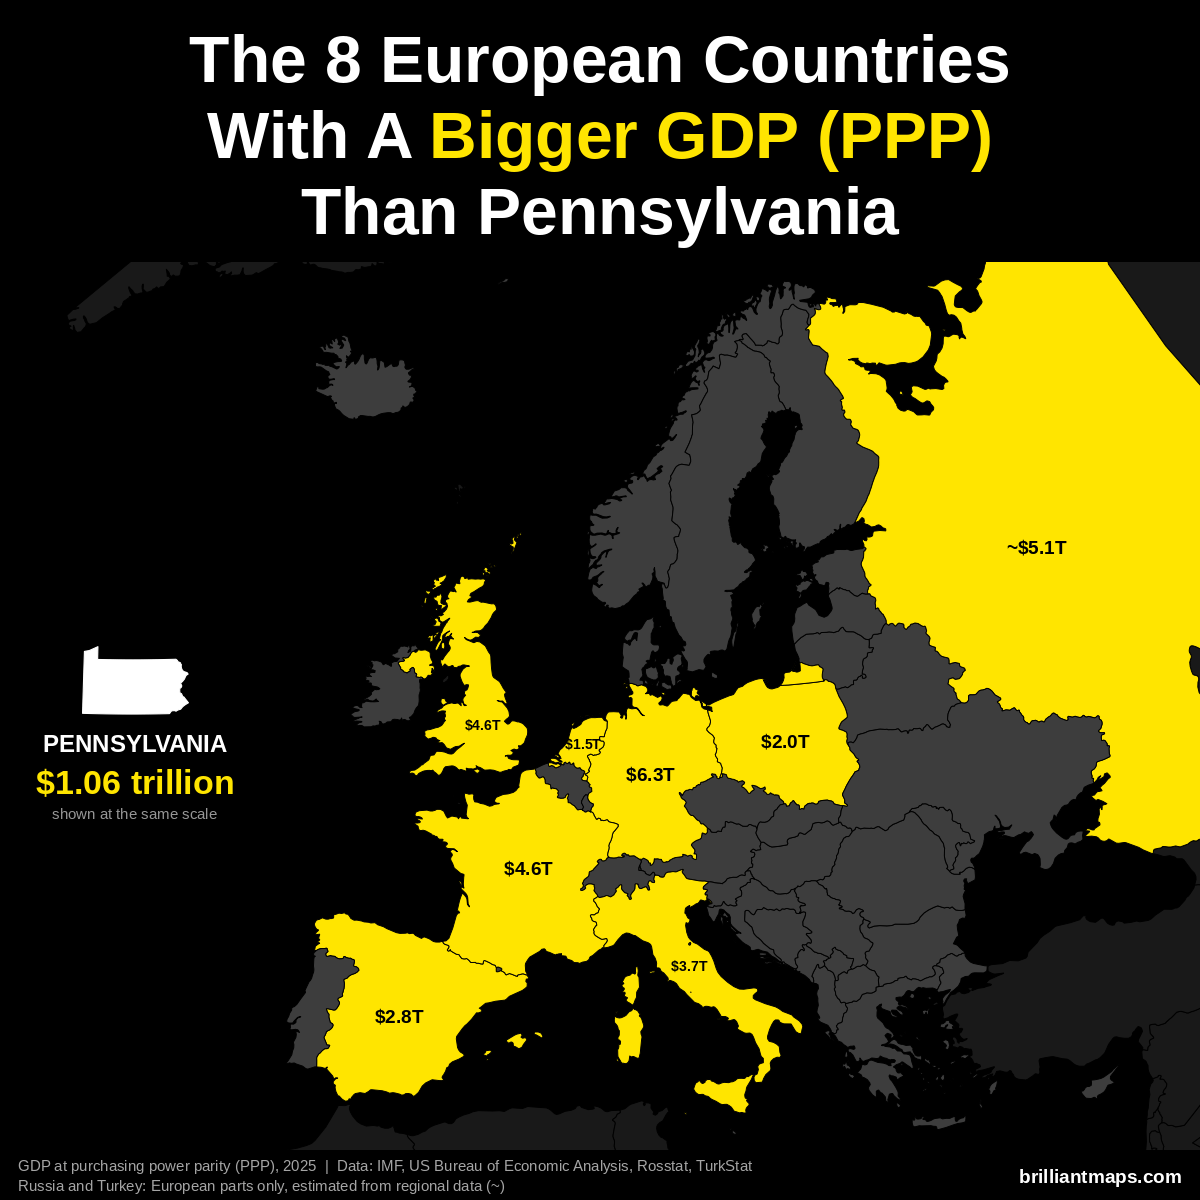
Pennsylvania has a GDP of $1.06 trillion (2025). US states are already measured in the dollars PPP is based on, so the figure is the same as nominal GDP. 8 European countries have a bigger GDP at purchasing power parity:
- Germany: $6.26 trillion
- Russia (European part): ~$5.14 trillion
- France: $4.58 trillion
- United Kingdom: $4.57 trillion
- Italy: $3.74 trillion
- Spain: $2.83 trillion
- Poland: $2.04 trillion
- Netherlands: $1.52 trillion
Pennsylvania Vs European GDP Per Capita (PPP)
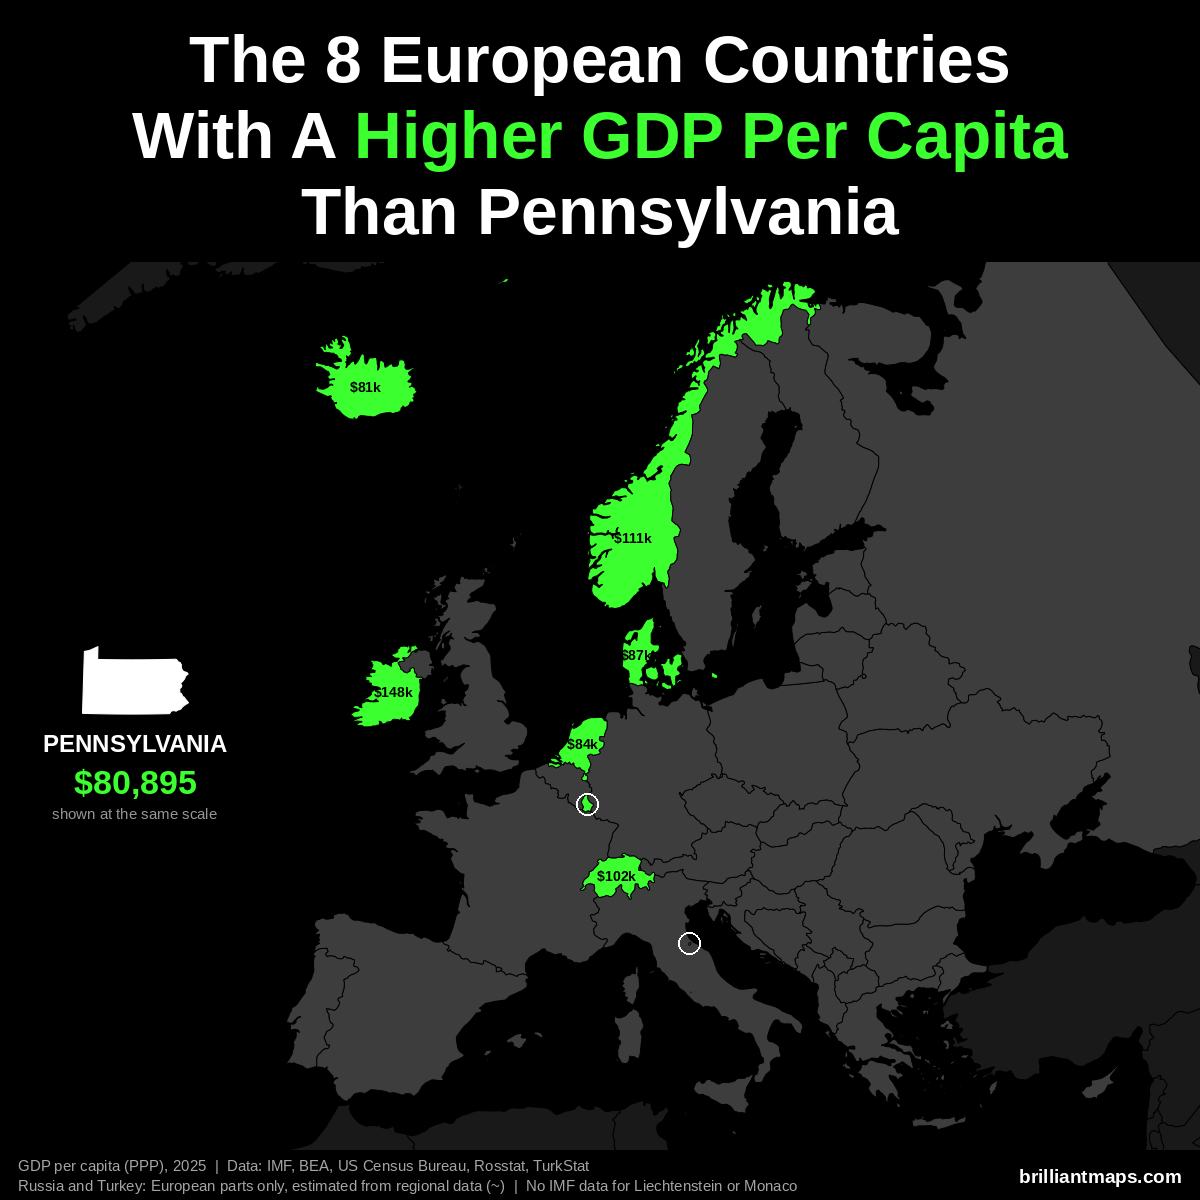
Pennsylvania has a GDP per capita of $80,895 (2025). 8 European countries have a higher GDP per capita at purchasing power parity:
- Luxembourg: $152,894
- Ireland: $147,825
- Norway: $111,462
- Switzerland: $102,397
- Denmark: $87,303
- Netherlands: $84,445
- San Marino: $83,838
- Iceland: $80,915
Liechtenstein and Monaco are not covered by the IMF data and are not counted here.
Pennsylvania Vs European Size
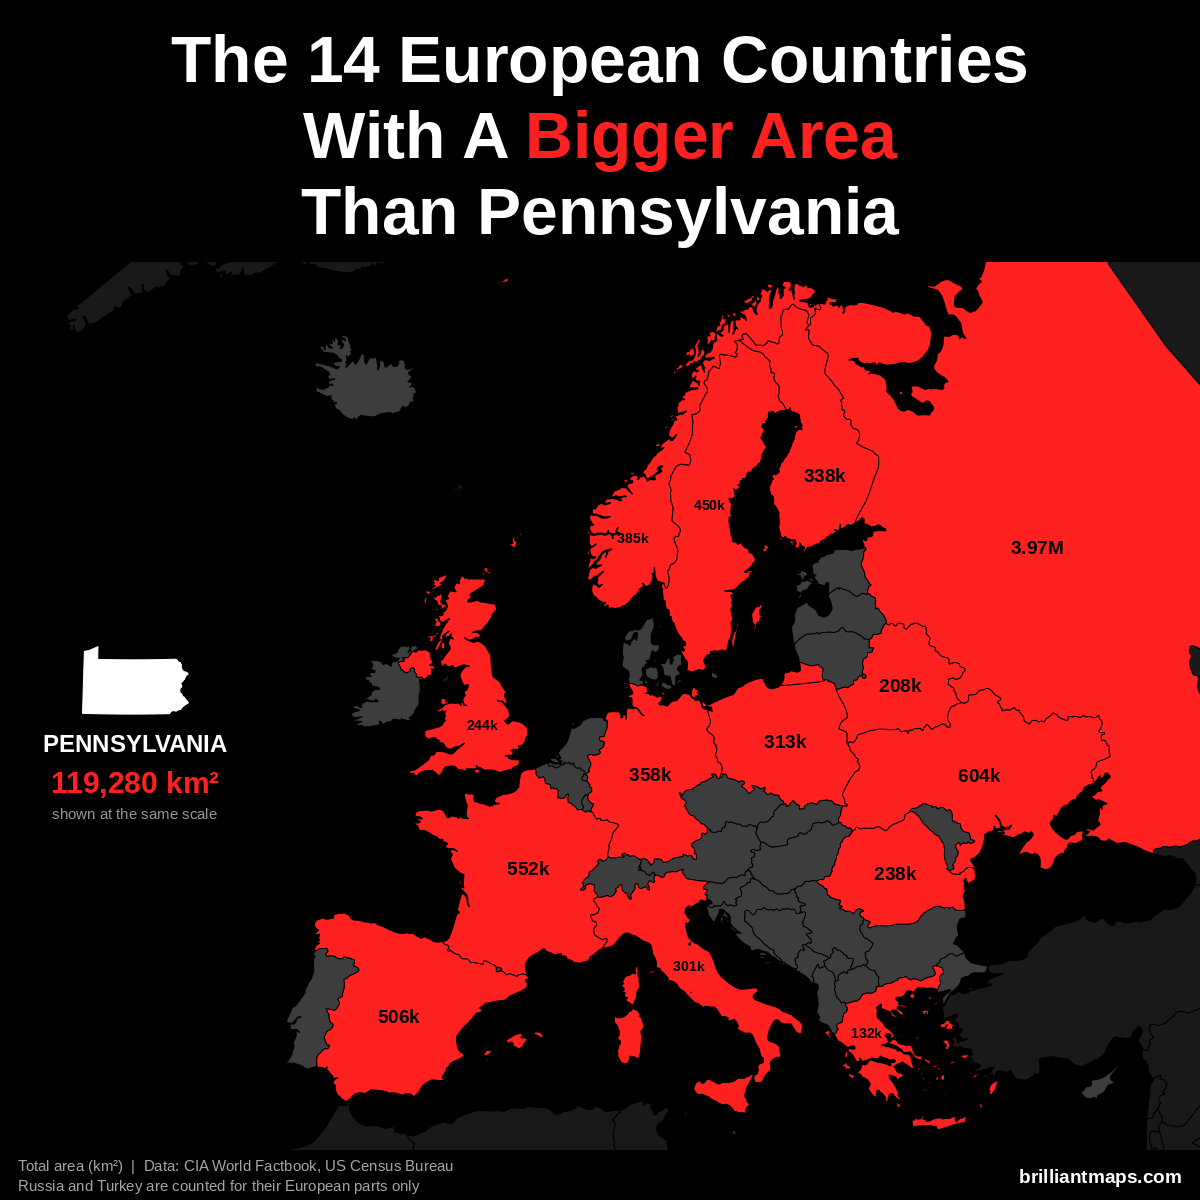
Pennsylvania has a total area of 119,280 km² (46,054 sq mi). 14 European countries have a bigger area:
- Russia (European part): 3,969,100 km² (1,532,477 sq mi)
- Ukraine: 603,550 km² (233,032 sq mi)
- France: 551,695 km² (213,010 sq mi)
- Spain: 505,990 km² (195,364 sq mi)
- Sweden: 450,295 km² (173,860 sq mi)
- Norway: 385,207 km² (148,729 sq mi)
- Germany: 357,588 km² (138,065 sq mi)
- Finland: 338,455 km² (130,678 sq mi)
- Poland: 312,696 km² (120,733 sq mi)
- Italy: 301,340 km² (116,348 sq mi)
- United Kingdom: 243,610 km² (94,058 sq mi)
- Romania: 238,397 km² (92,046 sq mi)
- Belarus: 207,600 km² (80,155 sq mi)
- Greece: 131,957 km² (50,949 sq mi)
Pennsylvania Vs European Life Expectancy
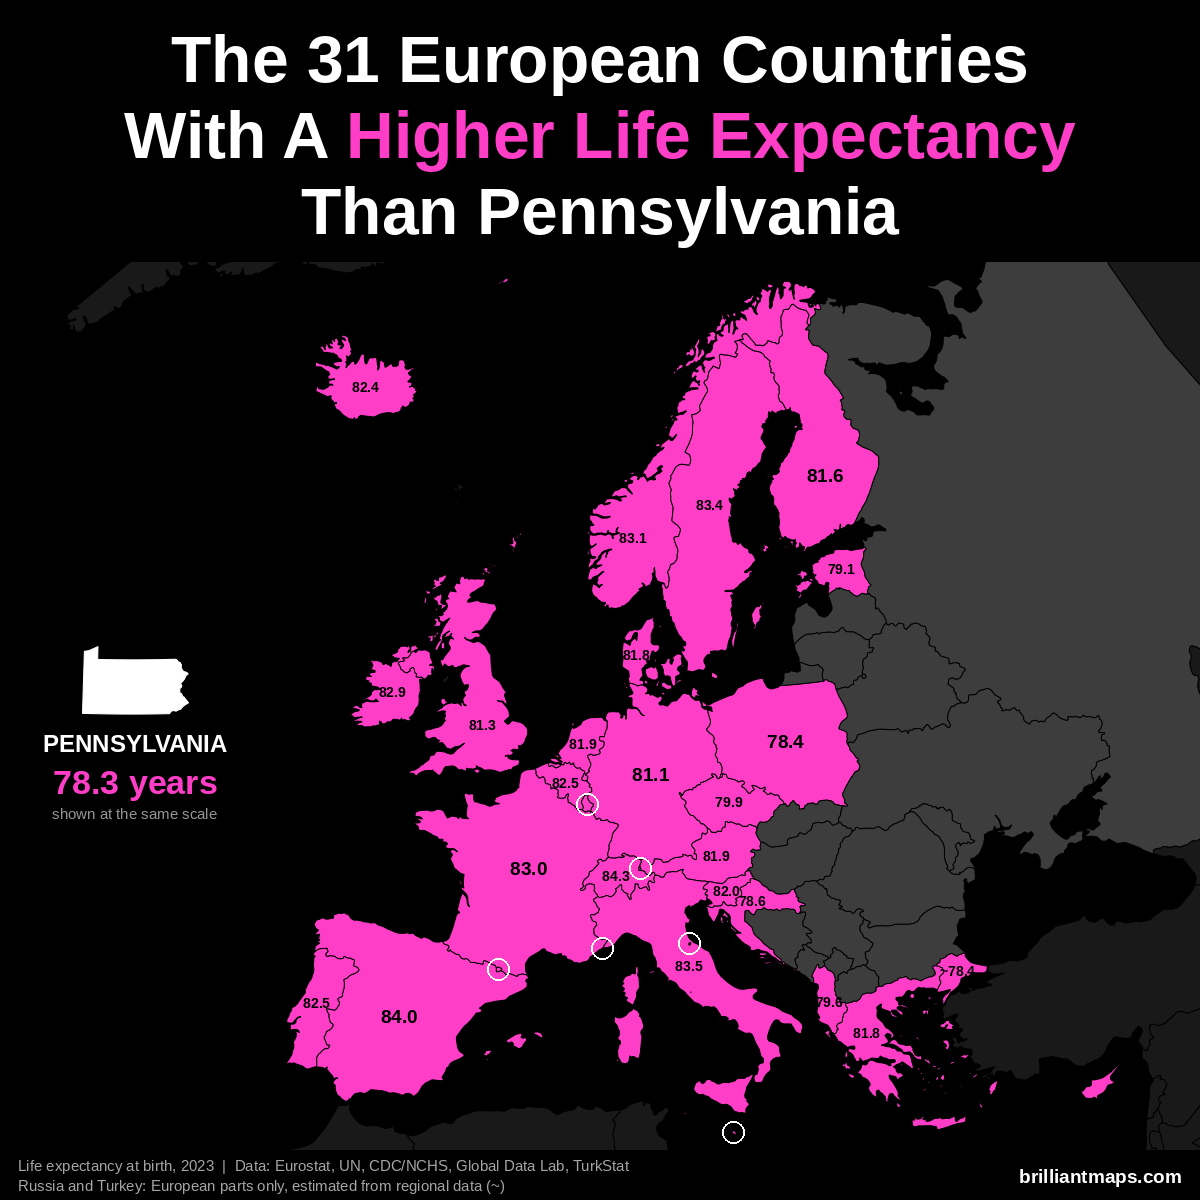
Pennsylvania has a life expectancy at birth of 78.3 years (2023). 31 European countries have a higher life expectancy:
- Monaco: 86.4 years
- San Marino: 85.7 years
- Liechtenstein: 84.6 years
- Switzerland: 84.3 years
- Andorra: 84.0 years
- Spain: 84.0 years
- Italy: 83.5 years
- Luxembourg: 83.4 years
- Malta: 83.4 years
- Sweden: 83.4 years
- Norway: 83.1 years
- France: 83.0 years
- Cyprus: 82.9 years
- Ireland: 82.9 years
- Belgium: 82.5 years
- Portugal: 82.5 years
- Iceland: 82.4 years
- Slovenia: 82.0 years
- Austria: 81.9 years
- Netherlands: 81.9 years
- Denmark: 81.8 years
- Greece: 81.8 years
- Finland: 81.6 years
- United Kingdom: 81.3 years
- Germany: 81.1 years
- Czechia: 79.9 years
- Albania: 79.6 years
- Estonia: 79.1 years
- Croatia: 78.6 years
- Poland: 78.4 years
- Turkey (European part): ~78.4 years
Rhode Island vs Europe
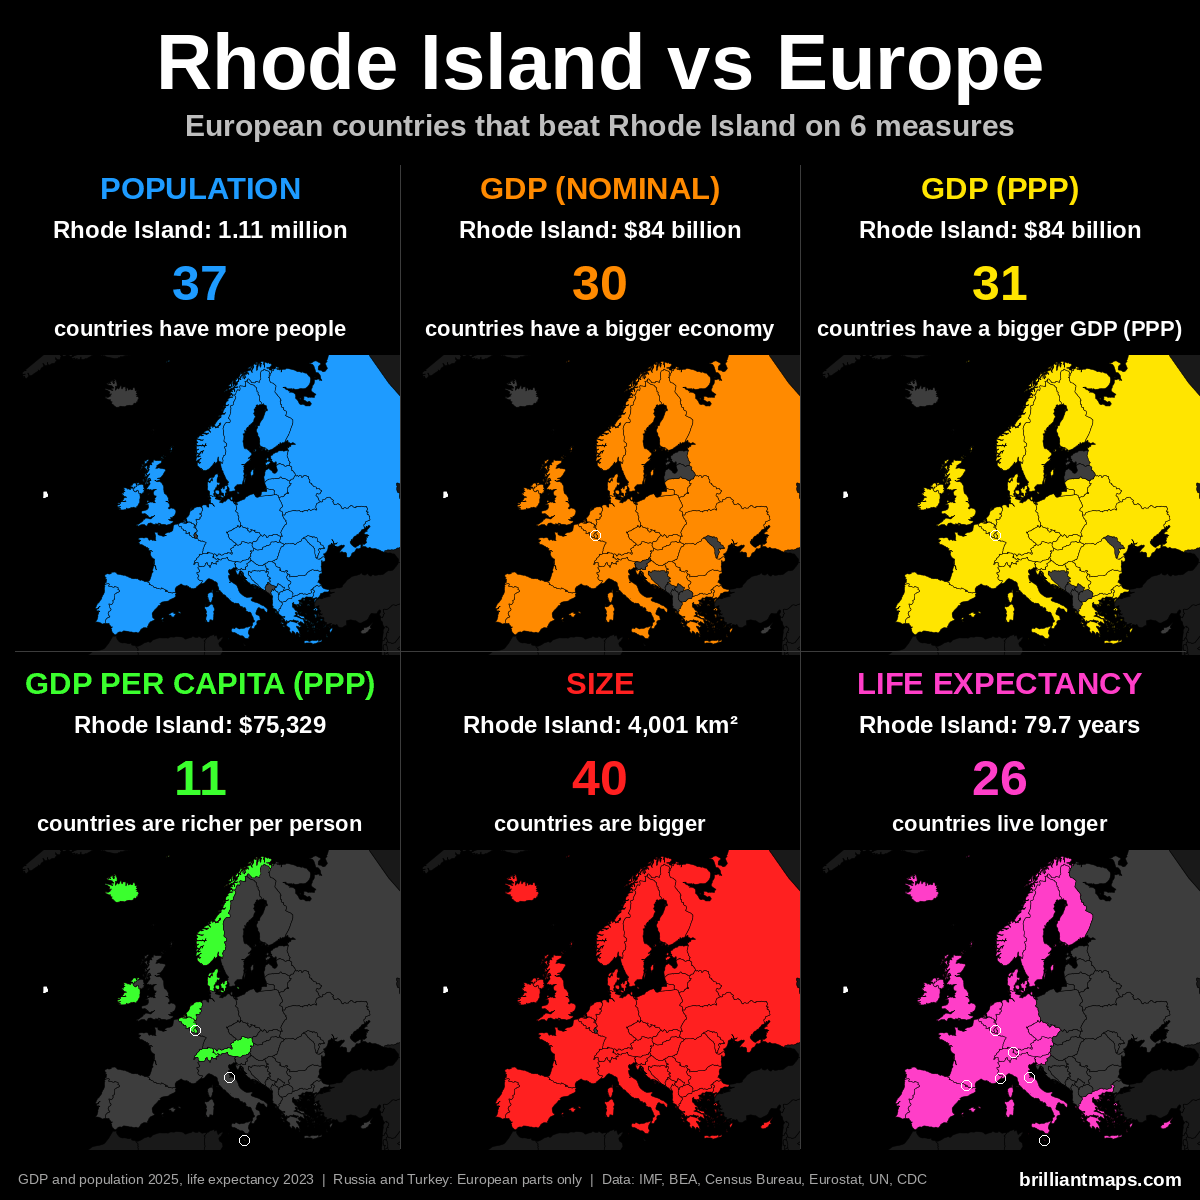
Rhode Island Vs European Population
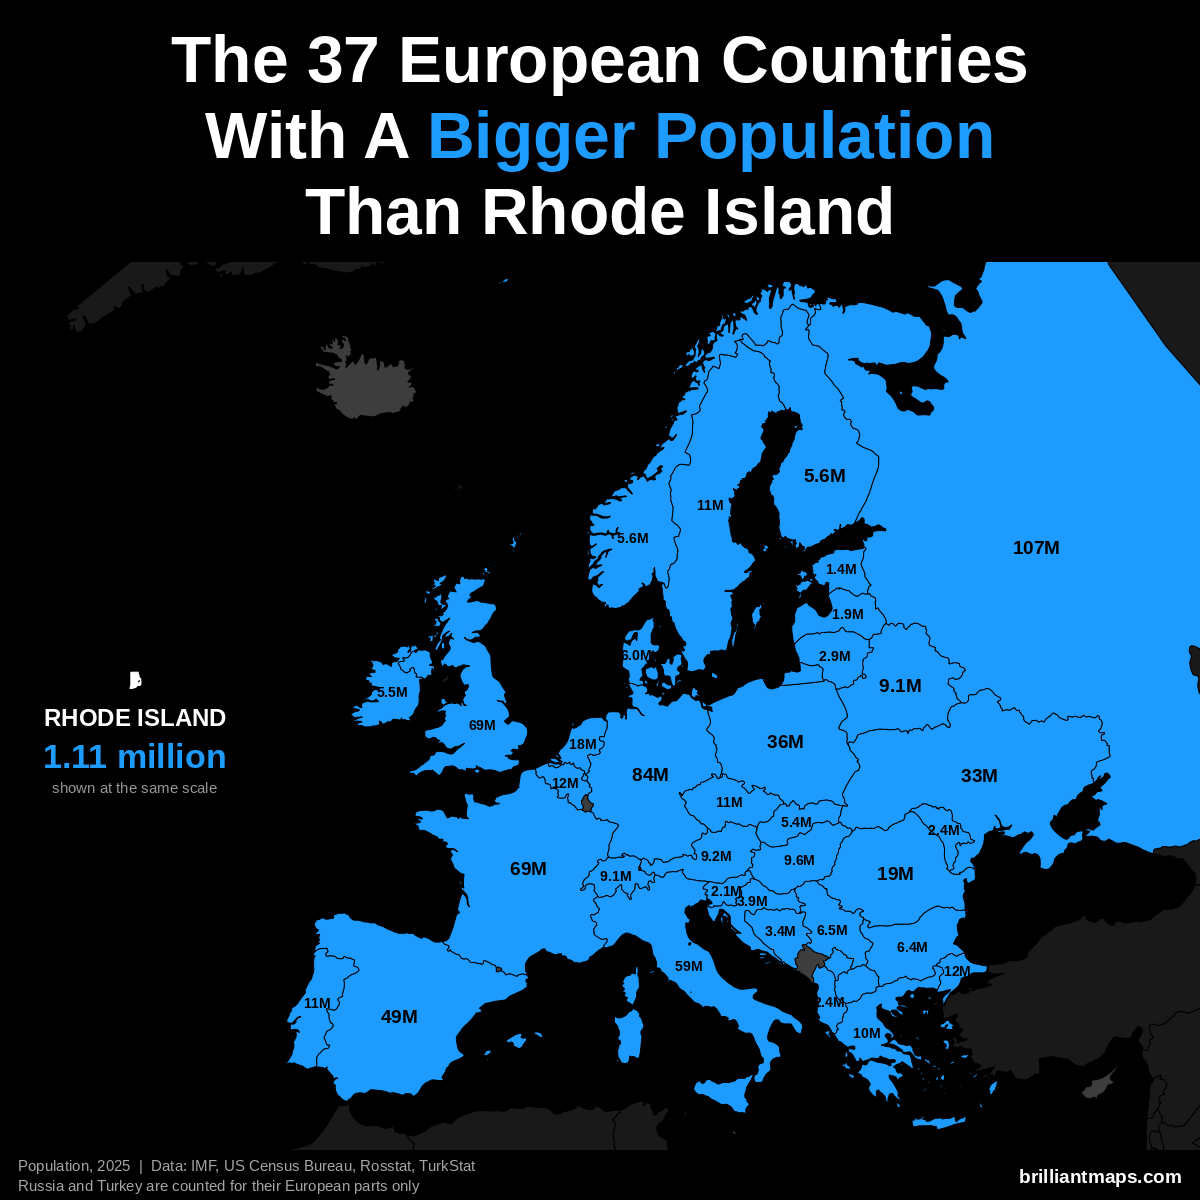
Rhode Island has a population of 1.1 million (2025). 37 European countries have a bigger population:
- Russia (European part): 107.0 million
- Germany: 83.5 million
- United Kingdom: 69.5 million
- France: 68.9 million
- Italy: 58.9 million
- Spain: 49.5 million
- Poland: 36.5 million
- Ukraine: 32.9 million
- Romania: 19.0 million
- Netherlands: 18.0 million
- Turkey (European part): 12.2 million
- Belgium: 11.9 million
- Portugal: 10.8 million
- Czechia: 10.8 million
- Sweden: 10.7 million
- Greece: 10.4 million
- Hungary: 9.6 million
- Austria: 9.2 million
- Belarus: 9.1 million
- Switzerland: 9.1 million
- Serbia: 6.5 million
- Bulgaria: 6.4 million
- Denmark: 6.0 million
- Norway: 5.6 million
- Finland: 5.6 million
- Ireland: 5.5 million
- Slovakia: 5.4 million
- Croatia: 3.9 million
- Bosnia and Herzegovina: 3.4 million
- Lithuania: 2.9 million
- Moldova: 2.4 million
- Albania: 2.4 million
- Slovenia: 2.1 million
- Latvia: 1.9 million
- North Macedonia: 1.8 million
- Kosovo: 1.6 million
- Estonia: 1.4 million
Rhode Island Vs European GDP (Nominal)
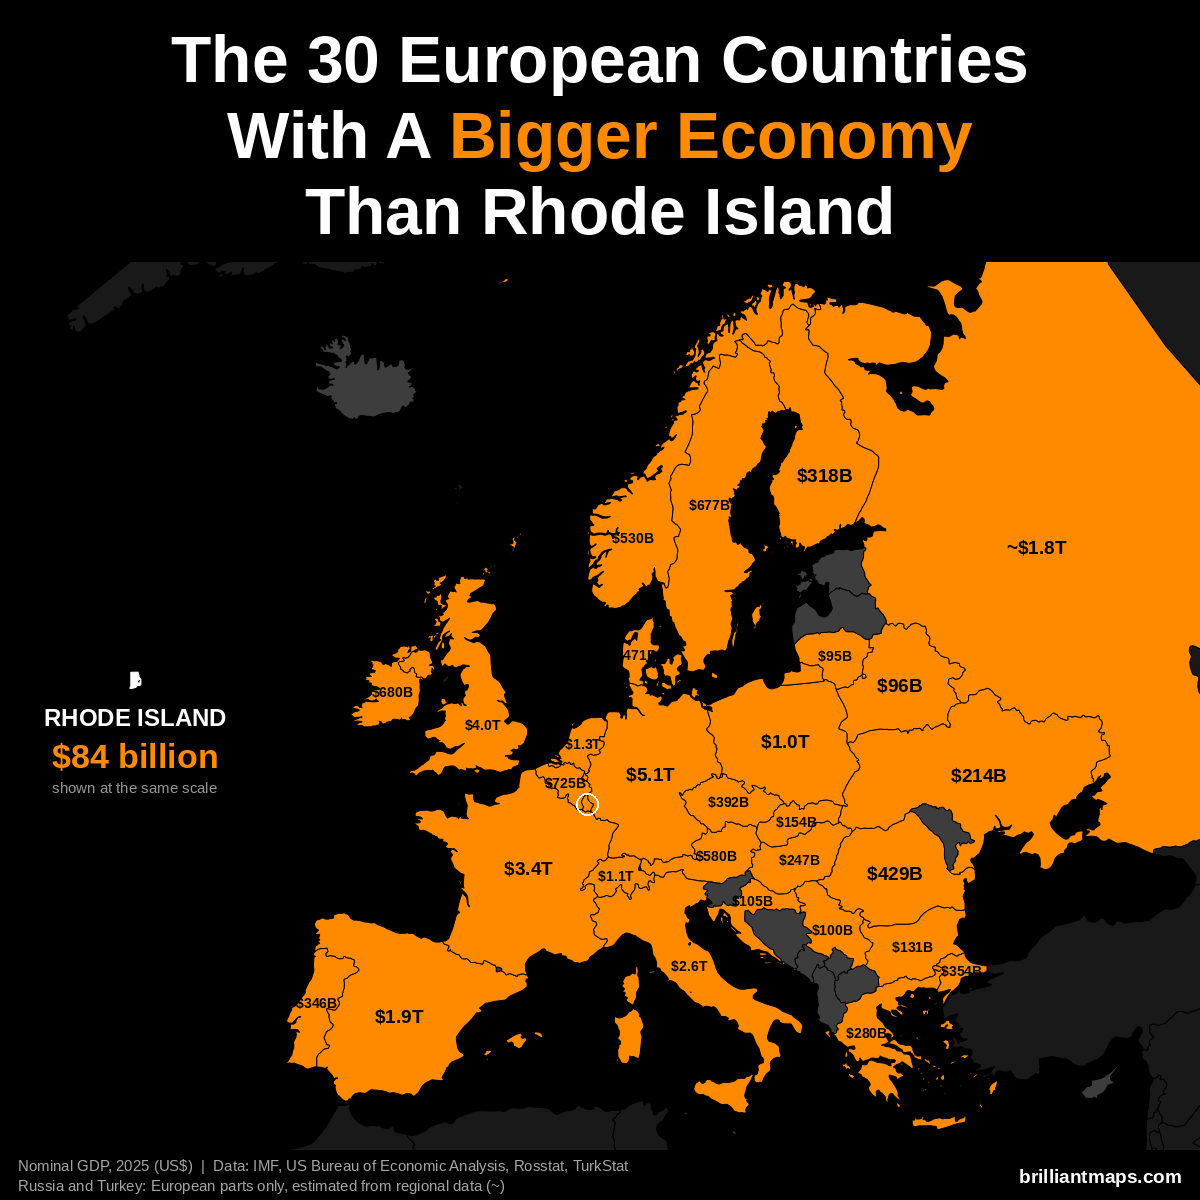
Rhode Island has a nominal GDP of $84 billion (2025). 30 European countries have a bigger economy:
- Germany: $5.12 trillion
- United Kingdom: $4.01 trillion
- France: $3.38 trillion
- Italy: $2.55 trillion
- Spain: $1.91 trillion
- Russia (European part): ~$1.83 trillion
- Netherlands: $1.32 trillion
- Switzerland: $1.06 trillion
- Poland: $1.04 trillion
- Belgium: $725 billion
- Ireland: $680 billion
- Sweden: $677 billion
- Austria: $580 billion
- Norway: $530 billion
- Denmark: $471 billion
- Romania: $429 billion
- Czechia: $392 billion
- Turkey (European part): ~$354 billion
- Portugal: $346 billion
- Finland: $318 billion
- Greece: $280 billion
- Hungary: $247 billion
- Ukraine: $214 billion
- Slovakia: $154 billion
- Bulgaria: $131 billion
- Croatia: $105 billion
- Luxembourg: $101 billion
- Serbia: $100 billion
- Belarus: $96 billion
- Lithuania: $95 billion
Rhode Island Vs European GDP (PPP)
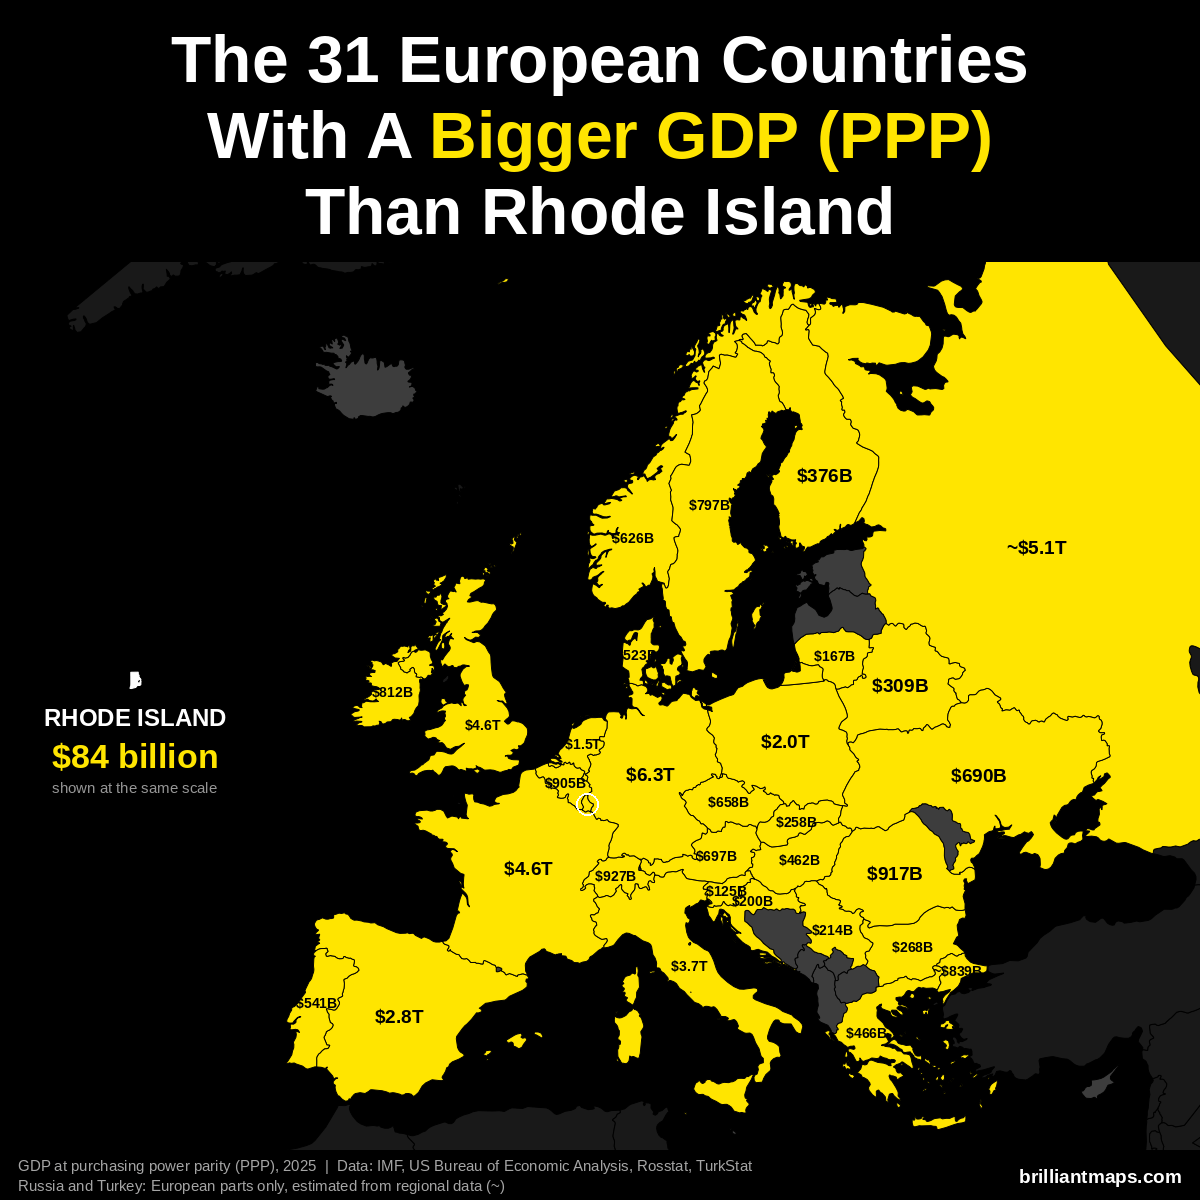
Rhode Island has a GDP of $84 billion (2025). US states are already measured in the dollars PPP is based on, so the figure is the same as nominal GDP. 31 European countries have a bigger GDP at purchasing power parity:
- Germany: $6.26 trillion
- Russia (European part): ~$5.14 trillion
- France: $4.58 trillion
- United Kingdom: $4.57 trillion
- Italy: $3.74 trillion
- Spain: $2.83 trillion
- Poland: $2.04 trillion
- Netherlands: $1.52 trillion
- Switzerland: $927 billion
- Romania: $917 billion
- Belgium: $905 billion
- Turkey (European part): ~$839 billion
- Ireland: $812 billion
- Sweden: $797 billion
- Austria: $697 billion
- Ukraine: $690 billion
- Czechia: $658 billion
- Norway: $626 billion
- Portugal: $541 billion
- Denmark: $523 billion
- Greece: $466 billion
- Hungary: $462 billion
- Finland: $376 billion
- Belarus: $309 billion
- Bulgaria: $268 billion
- Slovakia: $258 billion
- Serbia: $214 billion
- Croatia: $200 billion
- Lithuania: $167 billion
- Slovenia: $125 billion
- Luxembourg: $104 billion
Rhode Island Vs European GDP Per Capita (PPP)
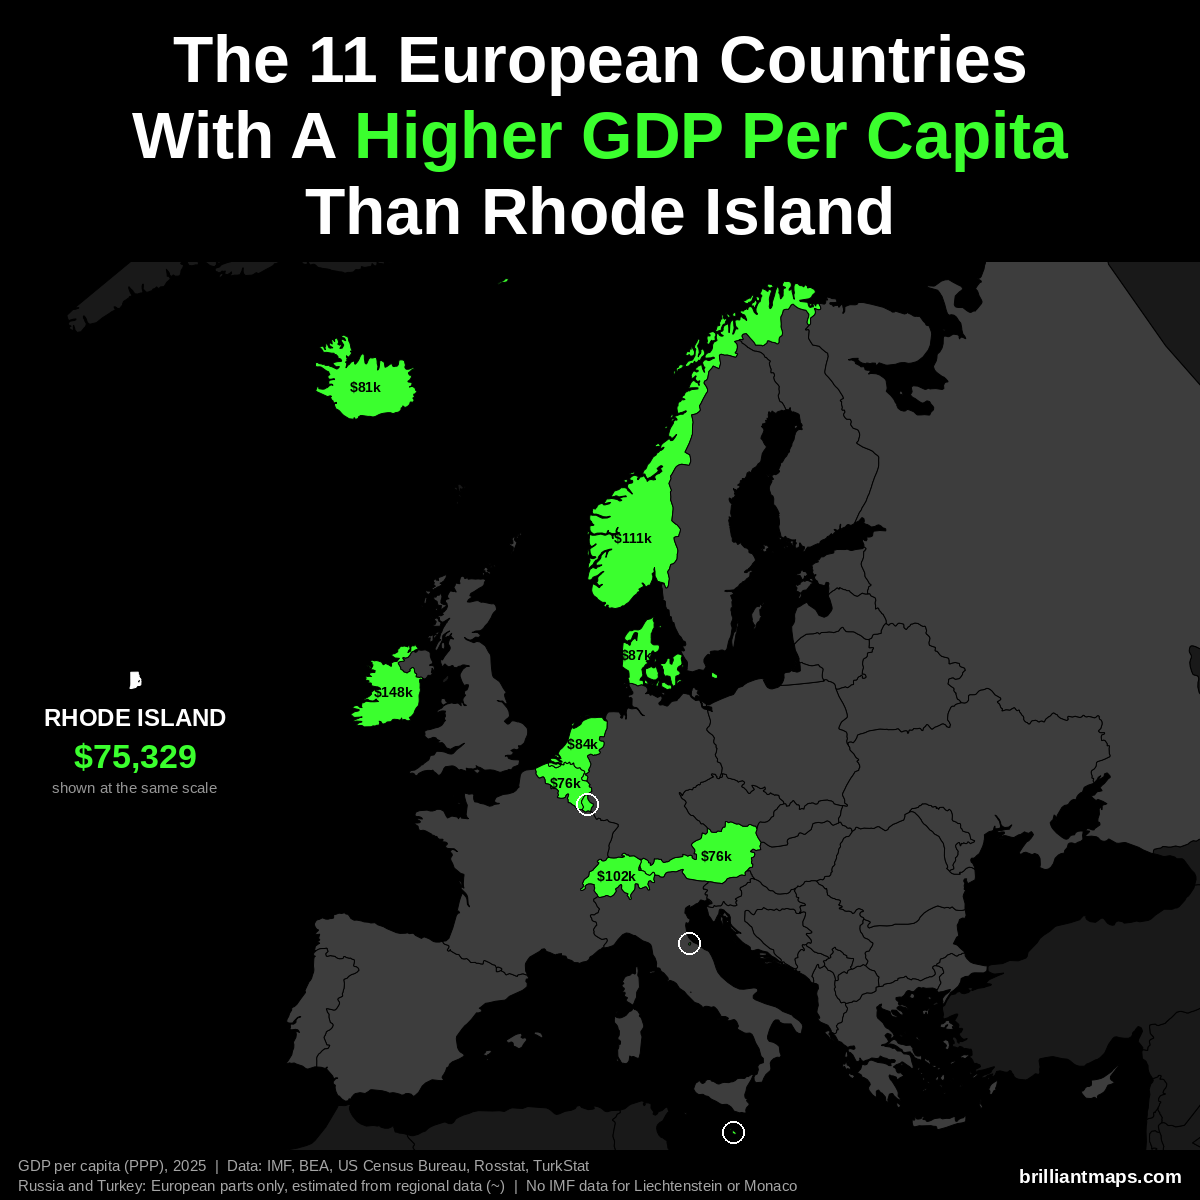
Rhode Island has a GDP per capita of $75,329 (2025). 11 European countries have a higher GDP per capita at purchasing power parity:
- Luxembourg: $152,894
- Ireland: $147,825
- Norway: $111,462
- Switzerland: $102,397
- Denmark: $87,303
- Netherlands: $84,445
- San Marino: $83,838
- Iceland: $80,915
- Belgium: $76,136
- Austria: $75,965
- Malta: $75,687
Liechtenstein and Monaco are not covered by the IMF data and are not counted here.
Rhode Island Vs European Size
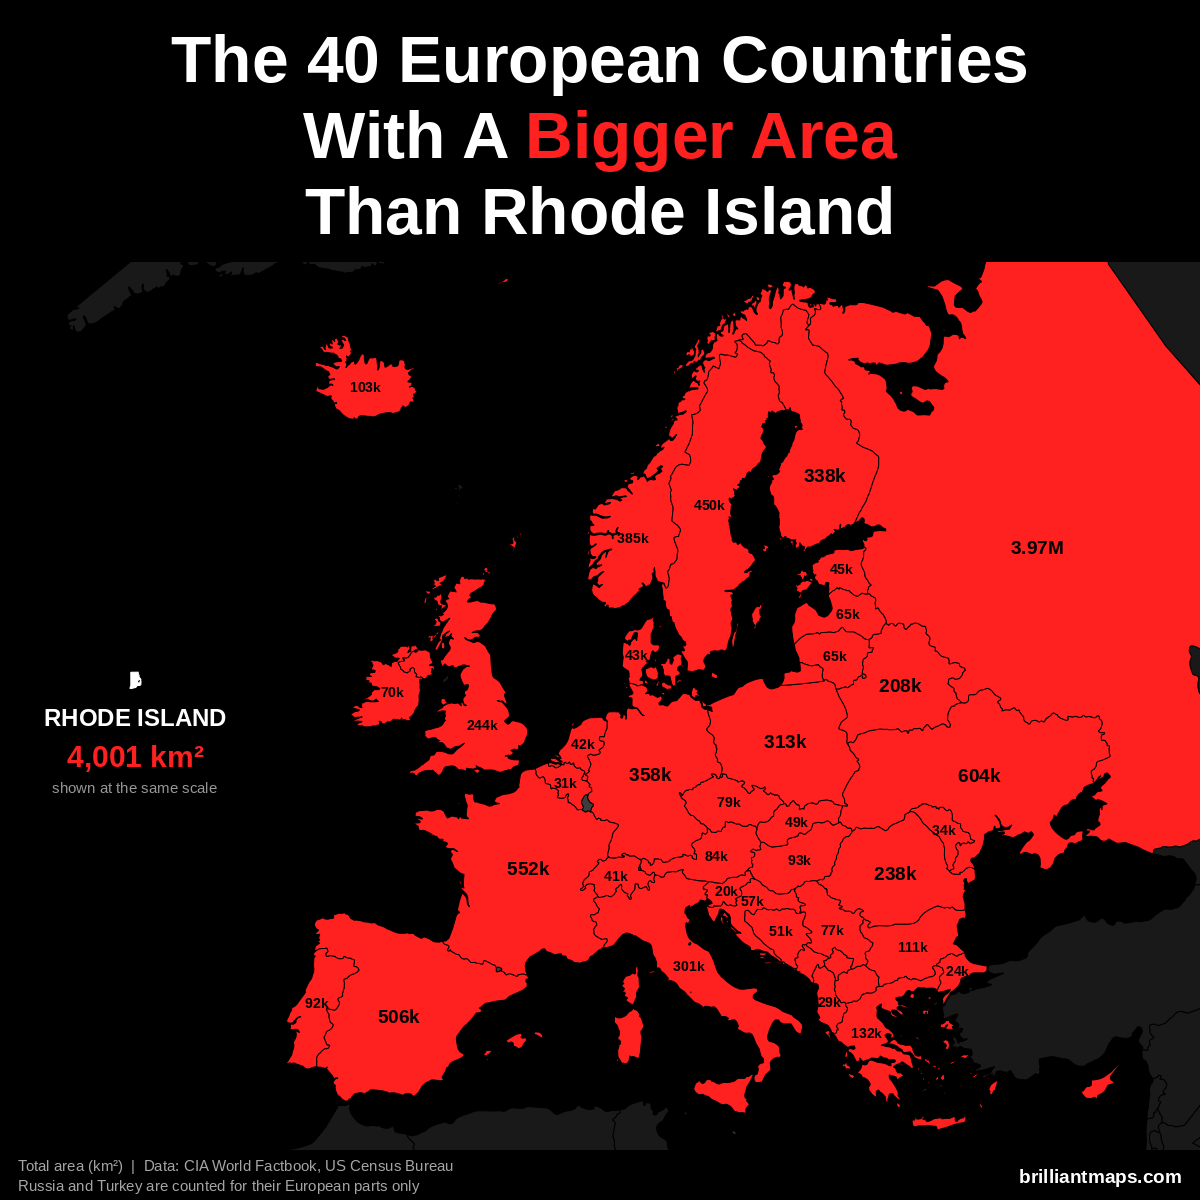
Rhode Island has a total area of 4,001 km² (1,545 sq mi). 40 European countries have a bigger area:
- Russia (European part): 3,969,100 km² (1,532,477 sq mi)
- Ukraine: 603,550 km² (233,032 sq mi)
- France: 551,695 km² (213,010 sq mi)
- Spain: 505,990 km² (195,364 sq mi)
- Sweden: 450,295 km² (173,860 sq mi)
- Norway: 385,207 km² (148,729 sq mi)
- Germany: 357,588 km² (138,065 sq mi)
- Finland: 338,455 km² (130,678 sq mi)
- Poland: 312,696 km² (120,733 sq mi)
- Italy: 301,340 km² (116,348 sq mi)
- United Kingdom: 243,610 km² (94,058 sq mi)
- Romania: 238,397 km² (92,046 sq mi)
- Belarus: 207,600 km² (80,155 sq mi)
- Greece: 131,957 km² (50,949 sq mi)
- Bulgaria: 110,994 km² (42,855 sq mi)
- Iceland: 103,000 km² (39,768 sq mi)
- Hungary: 93,028 km² (35,918 sq mi)
- Portugal: 92,212 km² (35,603 sq mi)
- Austria: 83,871 km² (32,383 sq mi)
- Czechia: 78,867 km² (30,451 sq mi)
- Serbia: 77,474 km² (29,913 sq mi)
- Ireland: 70,273 km² (27,133 sq mi)
- Lithuania: 65,300 km² (25,212 sq mi)
- Latvia: 64,589 km² (24,938 sq mi)
- Croatia: 56,594 km² (21,851 sq mi)
- Bosnia and Herzegovina: 51,197 km² (19,767 sq mi)
- Slovakia: 49,035 km² (18,933 sq mi)
- Estonia: 45,339 km² (17,505 sq mi)
- Denmark: 43,094 km² (16,639 sq mi)
- Netherlands: 41,850 km² (16,158 sq mi)
- Switzerland: 41,285 km² (15,940 sq mi)
- Moldova: 33,846 km² (13,068 sq mi)
- Belgium: 30,528 km² (11,787 sq mi)
- Albania: 28,748 km² (11,100 sq mi)
- North Macedonia: 25,713 km² (9,928 sq mi)
- Turkey (European part): 23,764 km² (9,175 sq mi)
- Slovenia: 20,273 km² (7,827 sq mi)
- Montenegro: 13,812 km² (5,333 sq mi)
- Kosovo: 10,887 km² (4,203 sq mi)
- Cyprus: 9,251 km² (3,572 sq mi)
Rhode Island Vs European Life Expectancy
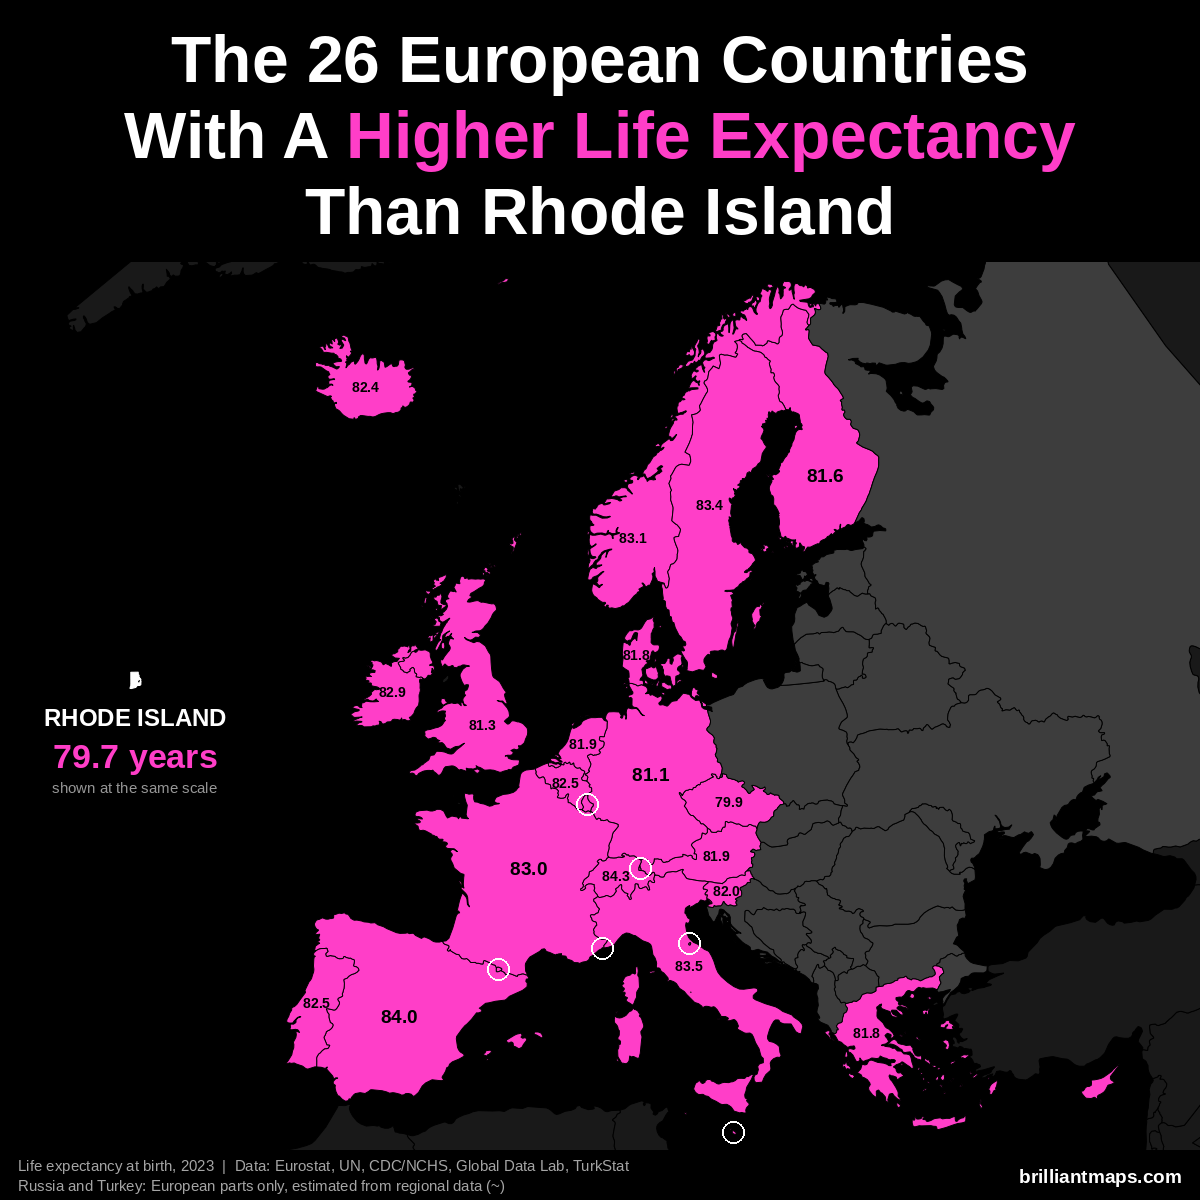
Rhode Island has a life expectancy at birth of 79.7 years (2023). 26 European countries have a higher life expectancy:
- Monaco: 86.4 years
- San Marino: 85.7 years
- Liechtenstein: 84.6 years
- Switzerland: 84.3 years
- Andorra: 84.0 years
- Spain: 84.0 years
- Italy: 83.5 years
- Luxembourg: 83.4 years
- Malta: 83.4 years
- Sweden: 83.4 years
- Norway: 83.1 years
- France: 83.0 years
- Cyprus: 82.9 years
- Ireland: 82.9 years
- Belgium: 82.5 years
- Portugal: 82.5 years
- Iceland: 82.4 years
- Slovenia: 82.0 years
- Austria: 81.9 years
- Netherlands: 81.9 years
- Denmark: 81.8 years
- Greece: 81.8 years
- Finland: 81.6 years
- United Kingdom: 81.3 years
- Germany: 81.1 years
- Czechia: 79.9 years
South Carolina vs Europe
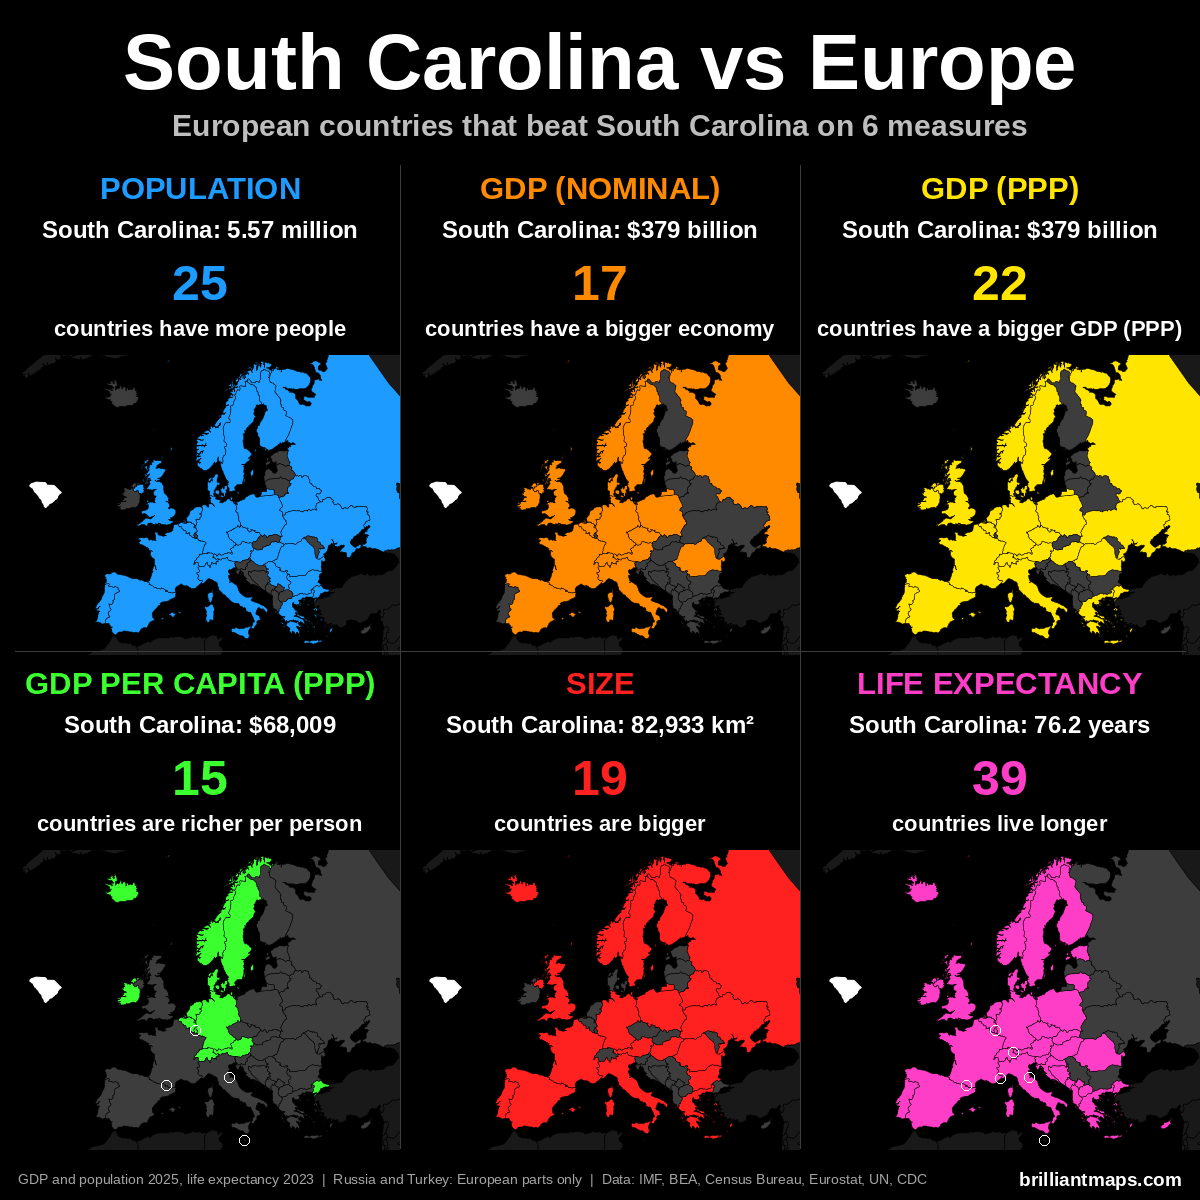
South Carolina Vs European Population
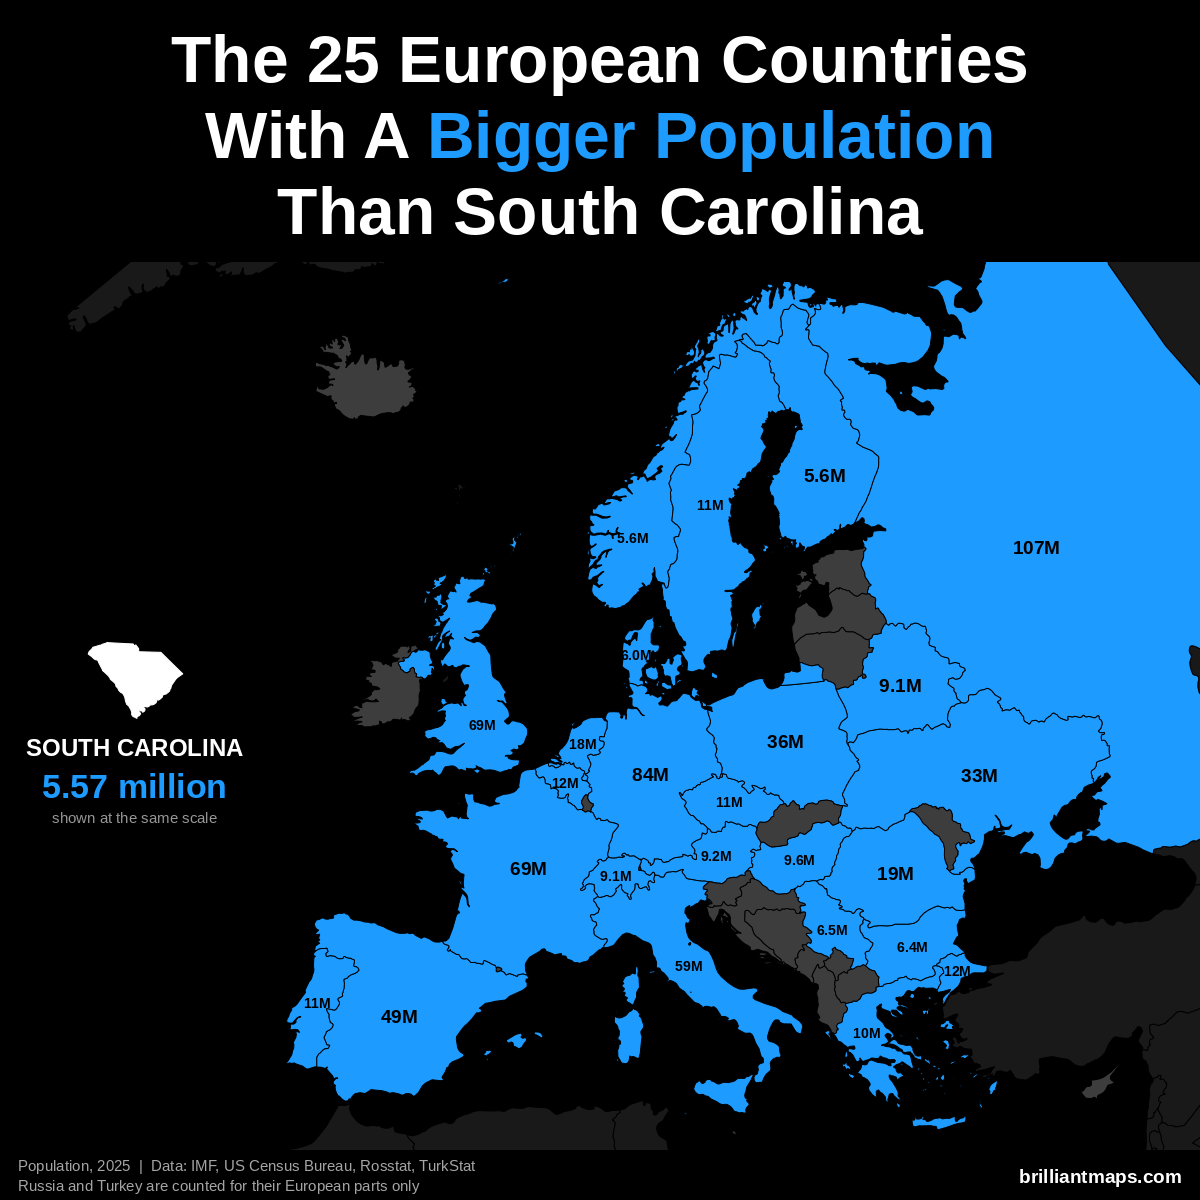
South Carolina has a population of 5.6 million (2025). 25 European countries have a bigger population:
- Russia (European part): 107.0 million
- Germany: 83.5 million
- United Kingdom: 69.5 million
- France: 68.9 million
- Italy: 58.9 million
- Spain: 49.5 million
- Poland: 36.5 million
- Ukraine: 32.9 million
- Romania: 19.0 million
- Netherlands: 18.0 million
- Turkey (European part): 12.2 million
- Belgium: 11.9 million
- Portugal: 10.8 million
- Czechia: 10.8 million
- Sweden: 10.7 million
- Greece: 10.4 million
- Hungary: 9.6 million
- Austria: 9.2 million
- Belarus: 9.1 million
- Switzerland: 9.1 million
- Serbia: 6.5 million
- Bulgaria: 6.4 million
- Denmark: 6.0 million
- Norway: 5.6 million
- Finland: 5.6 million
South Carolina Vs European GDP (Nominal)
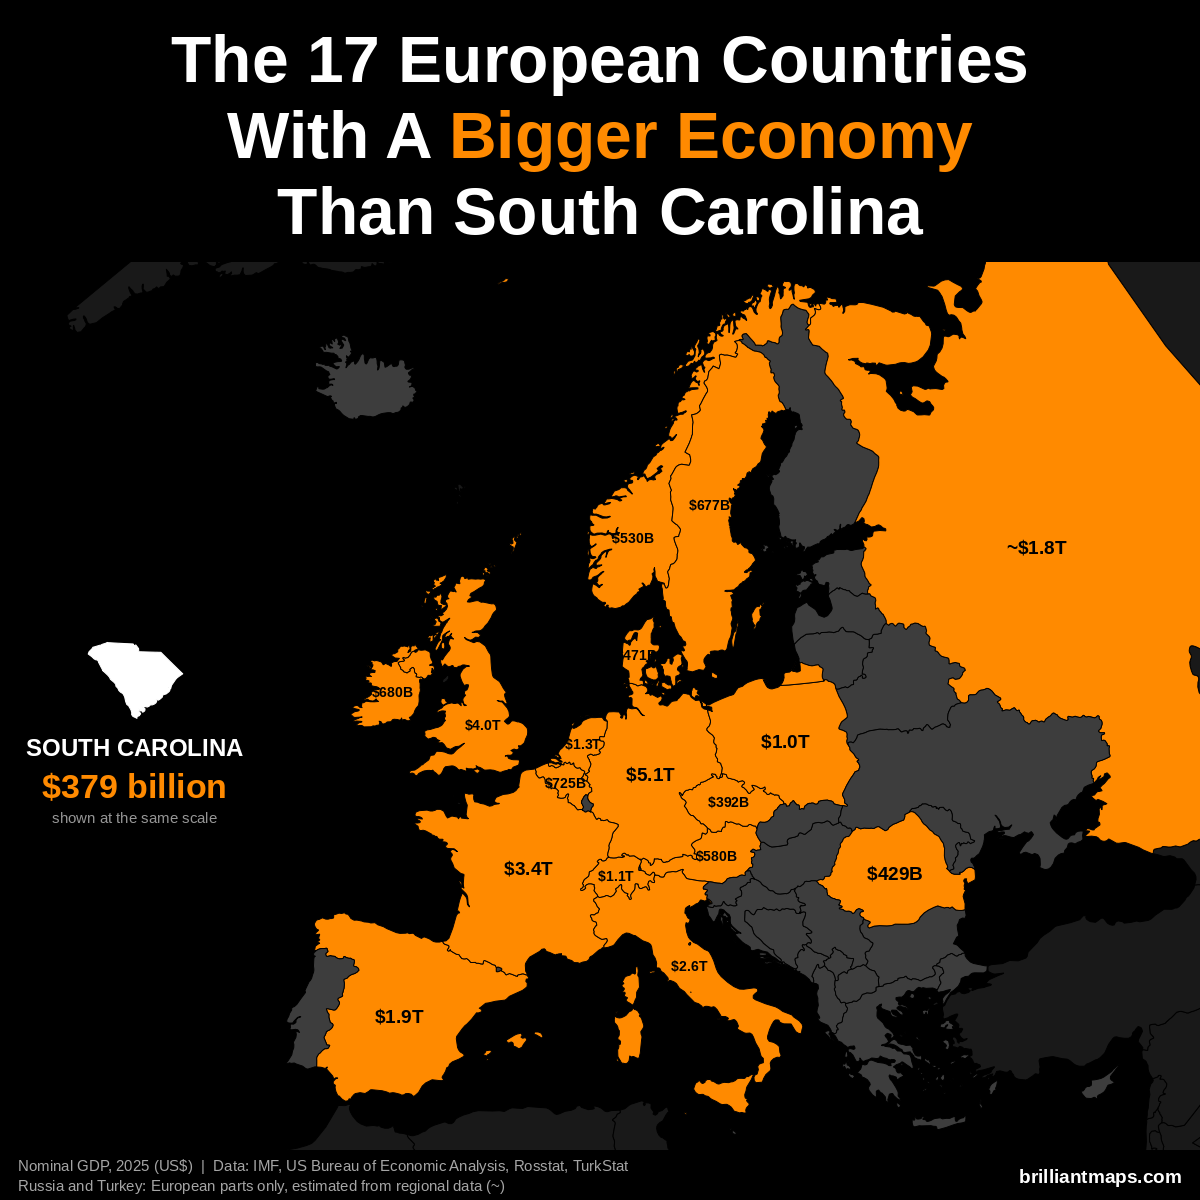
South Carolina has a nominal GDP of $379 billion (2025). 17 European countries have a bigger economy:
- Germany: $5.12 trillion
- United Kingdom: $4.01 trillion
- France: $3.38 trillion
- Italy: $2.55 trillion
- Spain: $1.91 trillion
- Russia (European part): ~$1.83 trillion
- Netherlands: $1.32 trillion
- Switzerland: $1.06 trillion
- Poland: $1.04 trillion
- Belgium: $725 billion
- Ireland: $680 billion
- Sweden: $677 billion
- Austria: $580 billion
- Norway: $530 billion
- Denmark: $471 billion
- Romania: $429 billion
- Czechia: $392 billion
South Carolina Vs European GDP (PPP)
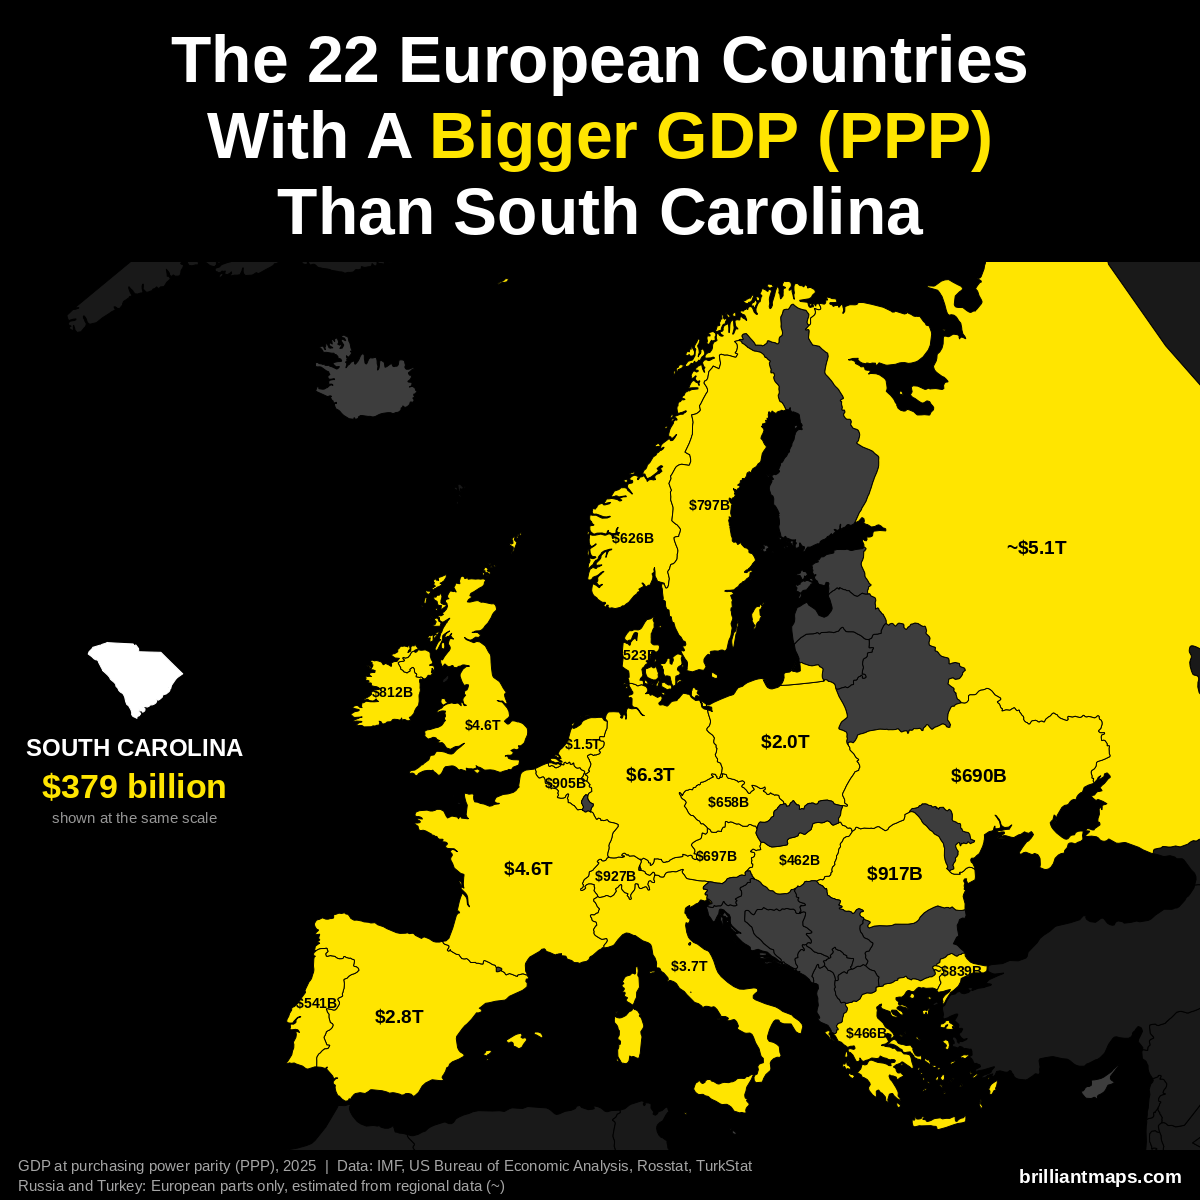
South Carolina has a GDP of $379 billion (2025). US states are already measured in the dollars PPP is based on, so the figure is the same as nominal GDP. 22 European countries have a bigger GDP at purchasing power parity:
- Germany: $6.26 trillion
- Russia (European part): ~$5.14 trillion
- France: $4.58 trillion
- United Kingdom: $4.57 trillion
- Italy: $3.74 trillion
- Spain: $2.83 trillion
- Poland: $2.04 trillion
- Netherlands: $1.52 trillion
- Switzerland: $927 billion
- Romania: $917 billion
- Belgium: $905 billion
- Turkey (European part): ~$839 billion
- Ireland: $812 billion
- Sweden: $797 billion
- Austria: $697 billion
- Ukraine: $690 billion
- Czechia: $658 billion
- Norway: $626 billion
- Portugal: $541 billion
- Denmark: $523 billion
- Greece: $466 billion
- Hungary: $462 billion
South Carolina Vs European GDP Per Capita (PPP)
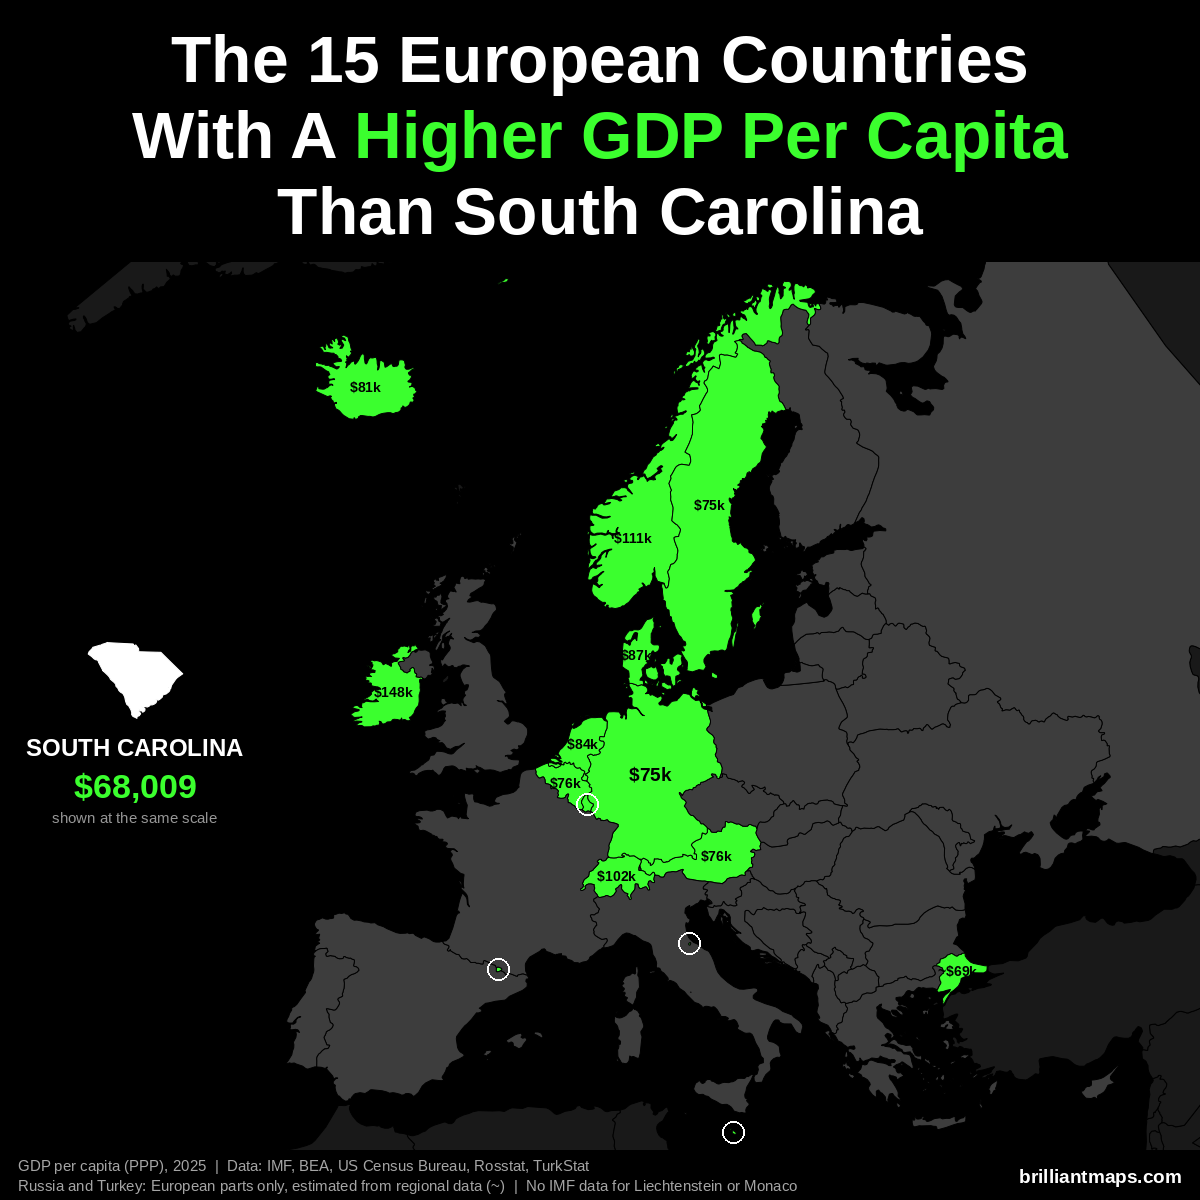
South Carolina has a GDP per capita of $68,009 (2025). 15 European countries have a higher GDP per capita at purchasing power parity:
- Luxembourg: $152,894
- Ireland: $147,825
- Norway: $111,462
- Switzerland: $102,397
- Denmark: $87,303
- Netherlands: $84,445
- San Marino: $83,838
- Iceland: $80,915
- Belgium: $76,136
- Austria: $75,965
- Malta: $75,687
- Germany: $74,901
- Sweden: $74,651
- Andorra: $74,059
- Turkey (European part): ~$68,800
Liechtenstein and Monaco are not covered by the IMF data and are not counted here.
South Carolina Vs European Size
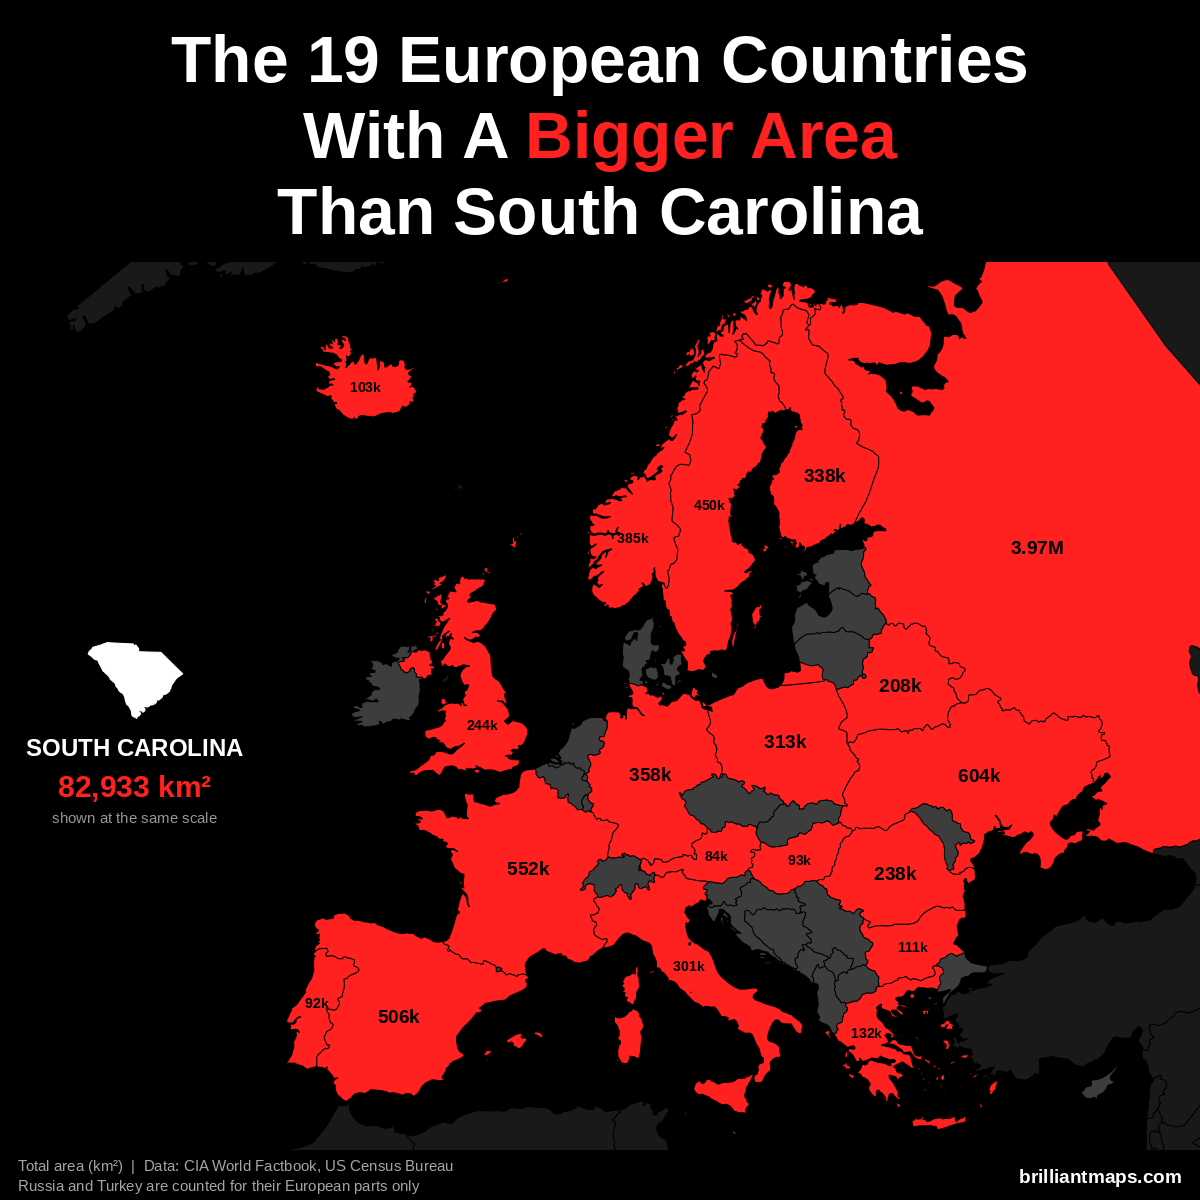
South Carolina has a total area of 82,933 km² (32,021 sq mi). 19 European countries have a bigger area:
- Russia (European part): 3,969,100 km² (1,532,477 sq mi)
- Ukraine: 603,550 km² (233,032 sq mi)
- France: 551,695 km² (213,010 sq mi)
- Spain: 505,990 km² (195,364 sq mi)
- Sweden: 450,295 km² (173,860 sq mi)
- Norway: 385,207 km² (148,729 sq mi)
- Germany: 357,588 km² (138,065 sq mi)
- Finland: 338,455 km² (130,678 sq mi)
- Poland: 312,696 km² (120,733 sq mi)
- Italy: 301,340 km² (116,348 sq mi)
- United Kingdom: 243,610 km² (94,058 sq mi)
- Romania: 238,397 km² (92,046 sq mi)
- Belarus: 207,600 km² (80,155 sq mi)
- Greece: 131,957 km² (50,949 sq mi)
- Bulgaria: 110,994 km² (42,855 sq mi)
- Iceland: 103,000 km² (39,768 sq mi)
- Hungary: 93,028 km² (35,918 sq mi)
- Portugal: 92,212 km² (35,603 sq mi)
- Austria: 83,871 km² (32,383 sq mi)
South Carolina Vs European Life Expectancy
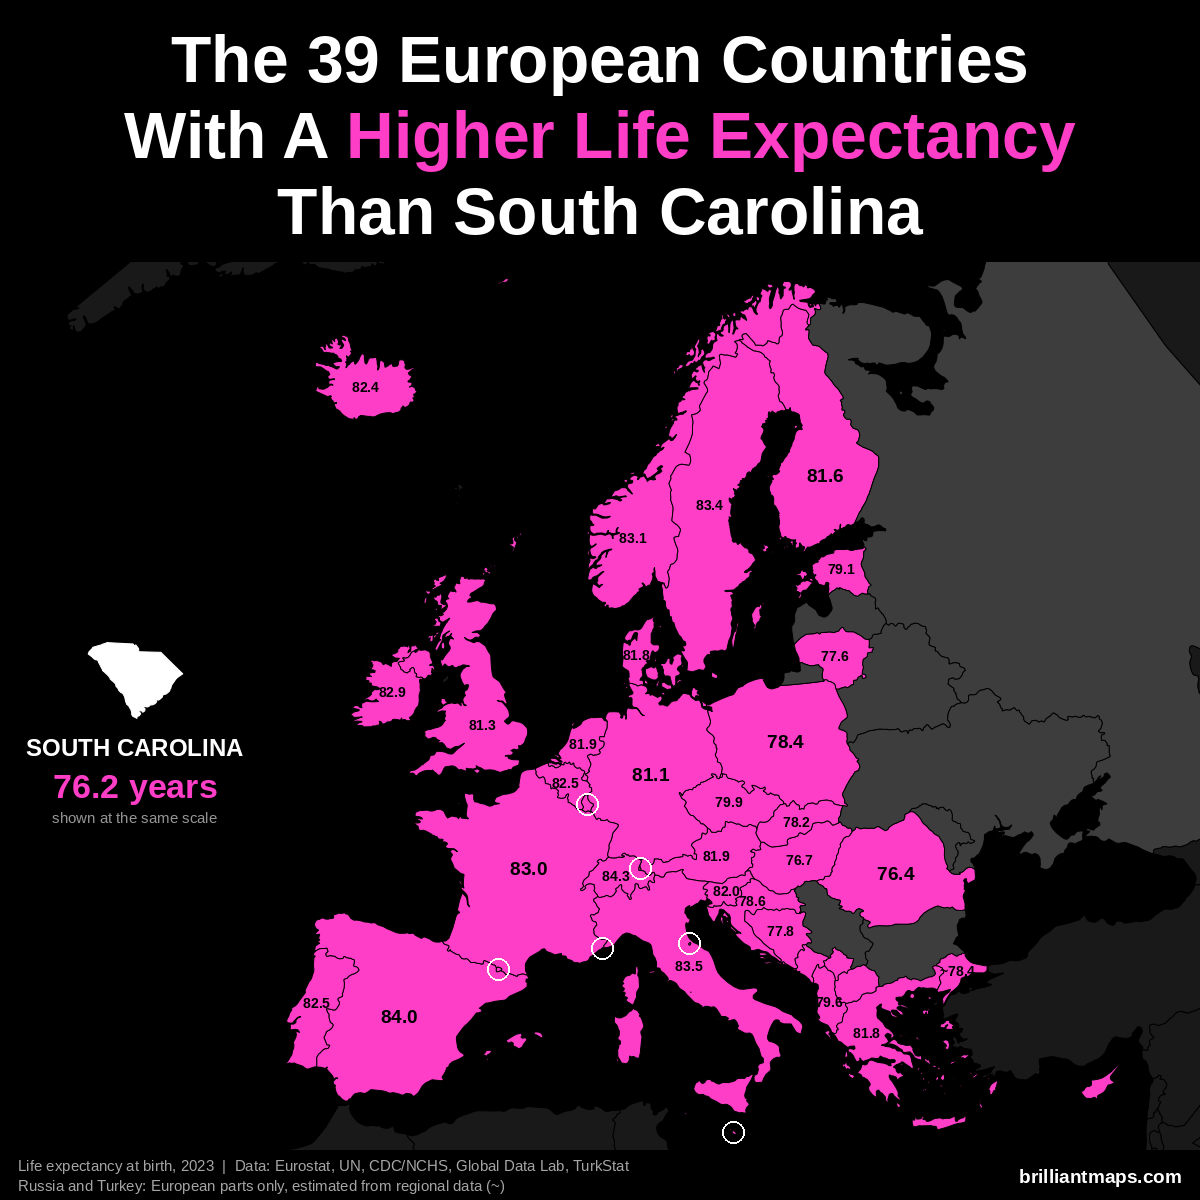
South Carolina has a life expectancy at birth of 76.2 years (2023). 39 European countries have a higher life expectancy:
- Monaco: 86.4 years
- San Marino: 85.7 years
- Liechtenstein: 84.6 years
- Switzerland: 84.3 years
- Andorra: 84.0 years
- Spain: 84.0 years
- Italy: 83.5 years
- Luxembourg: 83.4 years
- Malta: 83.4 years
- Sweden: 83.4 years
- Norway: 83.1 years
- France: 83.0 years
- Cyprus: 82.9 years
- Ireland: 82.9 years
- Belgium: 82.5 years
- Portugal: 82.5 years
- Iceland: 82.4 years
- Slovenia: 82.0 years
- Austria: 81.9 years
- Netherlands: 81.9 years
- Denmark: 81.8 years
- Greece: 81.8 years
- Finland: 81.6 years
- United Kingdom: 81.3 years
- Germany: 81.1 years
- Czechia: 79.9 years
- Albania: 79.6 years
- Estonia: 79.1 years
- Croatia: 78.6 years
- Poland: 78.4 years
- Turkey (European part): ~78.4 years
- Slovakia: 78.2 years
- Kosovo: 78.0 years
- Bosnia and Herzegovina: 77.8 years
- Lithuania: 77.6 years
- Montenegro: 77.6 years
- North Macedonia: 77.4 years
- Hungary: 76.7 years
- Romania: 76.4 years
South Dakota vs Europe
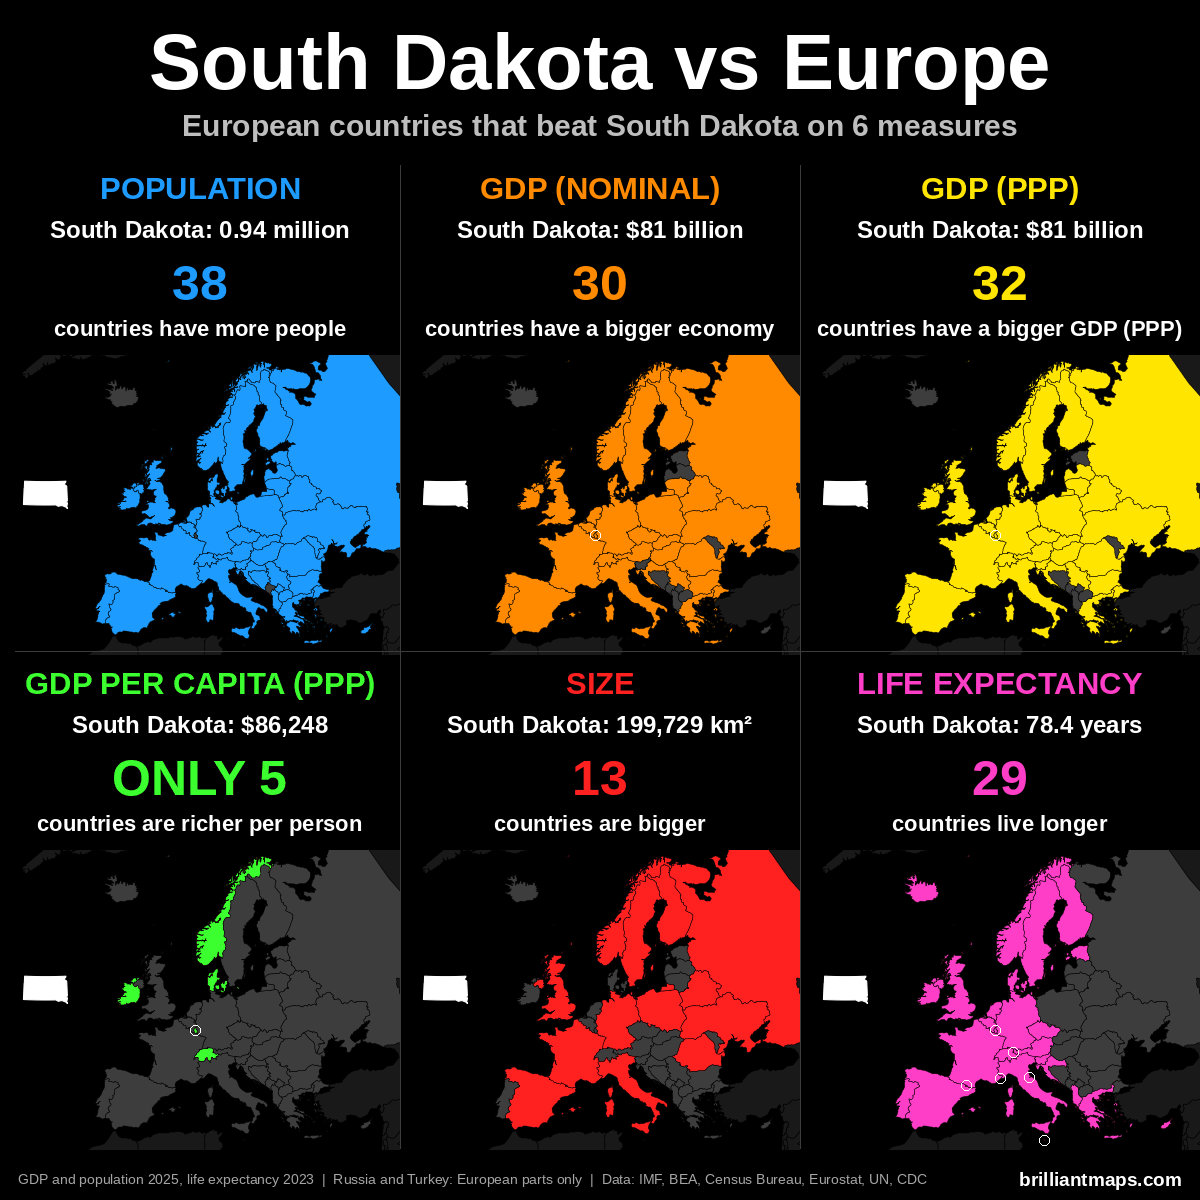
South Dakota Vs European Population
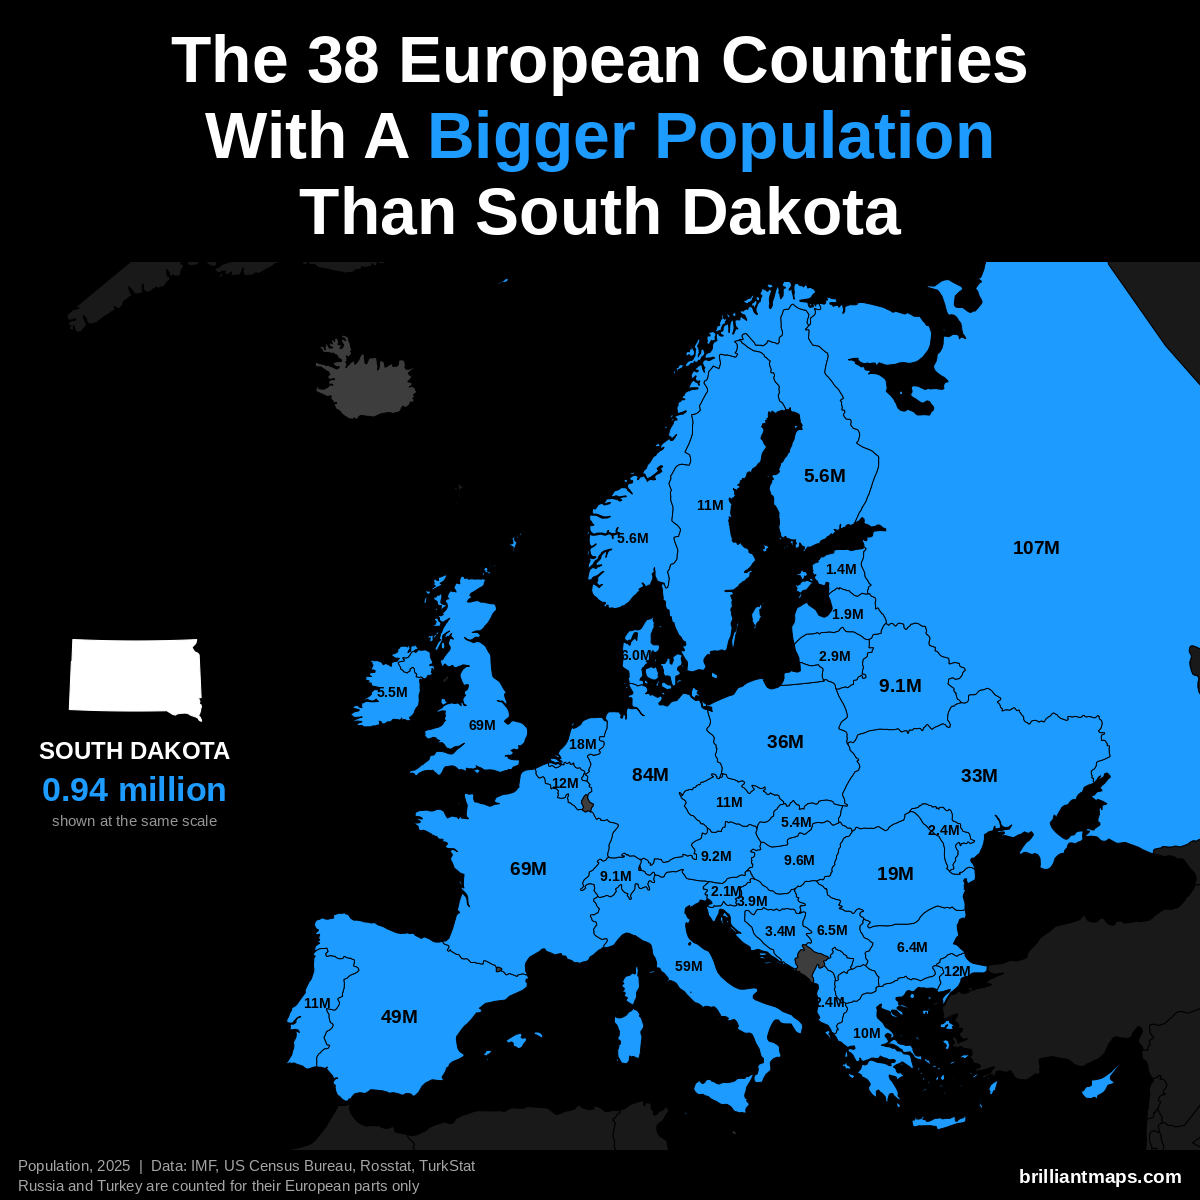
South Dakota has a population of 935,094 (2025). 38 European countries have a bigger population:
- Russia (European part): 107.0 million
- Germany: 83.5 million
- United Kingdom: 69.5 million
- France: 68.9 million
- Italy: 58.9 million
- Spain: 49.5 million
- Poland: 36.5 million
- Ukraine: 32.9 million
- Romania: 19.0 million
- Netherlands: 18.0 million
- Turkey (European part): 12.2 million
- Belgium: 11.9 million
- Portugal: 10.8 million
- Czechia: 10.8 million
- Sweden: 10.7 million
- Greece: 10.4 million
- Hungary: 9.6 million
- Austria: 9.2 million
- Belarus: 9.1 million
- Switzerland: 9.1 million
- Serbia: 6.5 million
- Bulgaria: 6.4 million
- Denmark: 6.0 million
- Norway: 5.6 million
- Finland: 5.6 million
- Ireland: 5.5 million
- Slovakia: 5.4 million
- Croatia: 3.9 million
- Bosnia and Herzegovina: 3.4 million
- Lithuania: 2.9 million
- Moldova: 2.4 million
- Albania: 2.4 million
- Slovenia: 2.1 million
- Latvia: 1.9 million
- North Macedonia: 1.8 million
- Kosovo: 1.6 million
- Estonia: 1.4 million
- Cyprus: 983,000
South Dakota Vs European GDP (Nominal)
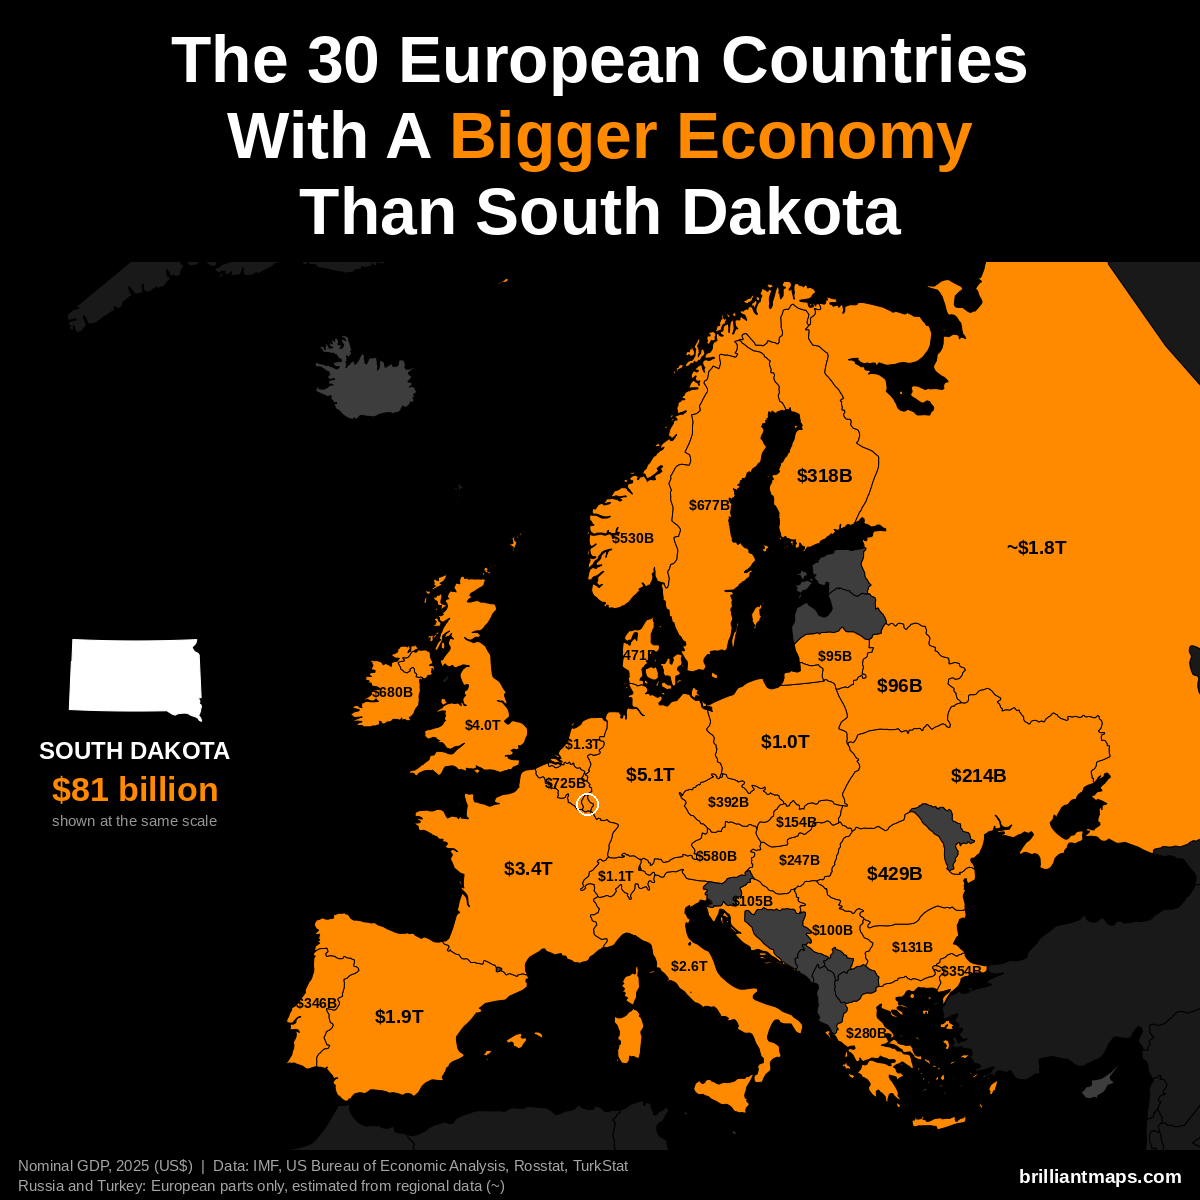
South Dakota has a nominal GDP of $81 billion (2025). 30 European countries have a bigger economy:
- Germany: $5.12 trillion
- United Kingdom: $4.01 trillion
- France: $3.38 trillion
- Italy: $2.55 trillion
- Spain: $1.91 trillion
- Russia (European part): ~$1.83 trillion
- Netherlands: $1.32 trillion
- Switzerland: $1.06 trillion
- Poland: $1.04 trillion
- Belgium: $725 billion
- Ireland: $680 billion
- Sweden: $677 billion
- Austria: $580 billion
- Norway: $530 billion
- Denmark: $471 billion
- Romania: $429 billion
- Czechia: $392 billion
- Turkey (European part): ~$354 billion
- Portugal: $346 billion
- Finland: $318 billion
- Greece: $280 billion
- Hungary: $247 billion
- Ukraine: $214 billion
- Slovakia: $154 billion
- Bulgaria: $131 billion
- Croatia: $105 billion
- Luxembourg: $101 billion
- Serbia: $100 billion
- Belarus: $96 billion
- Lithuania: $95 billion
South Dakota Vs European GDP (PPP)
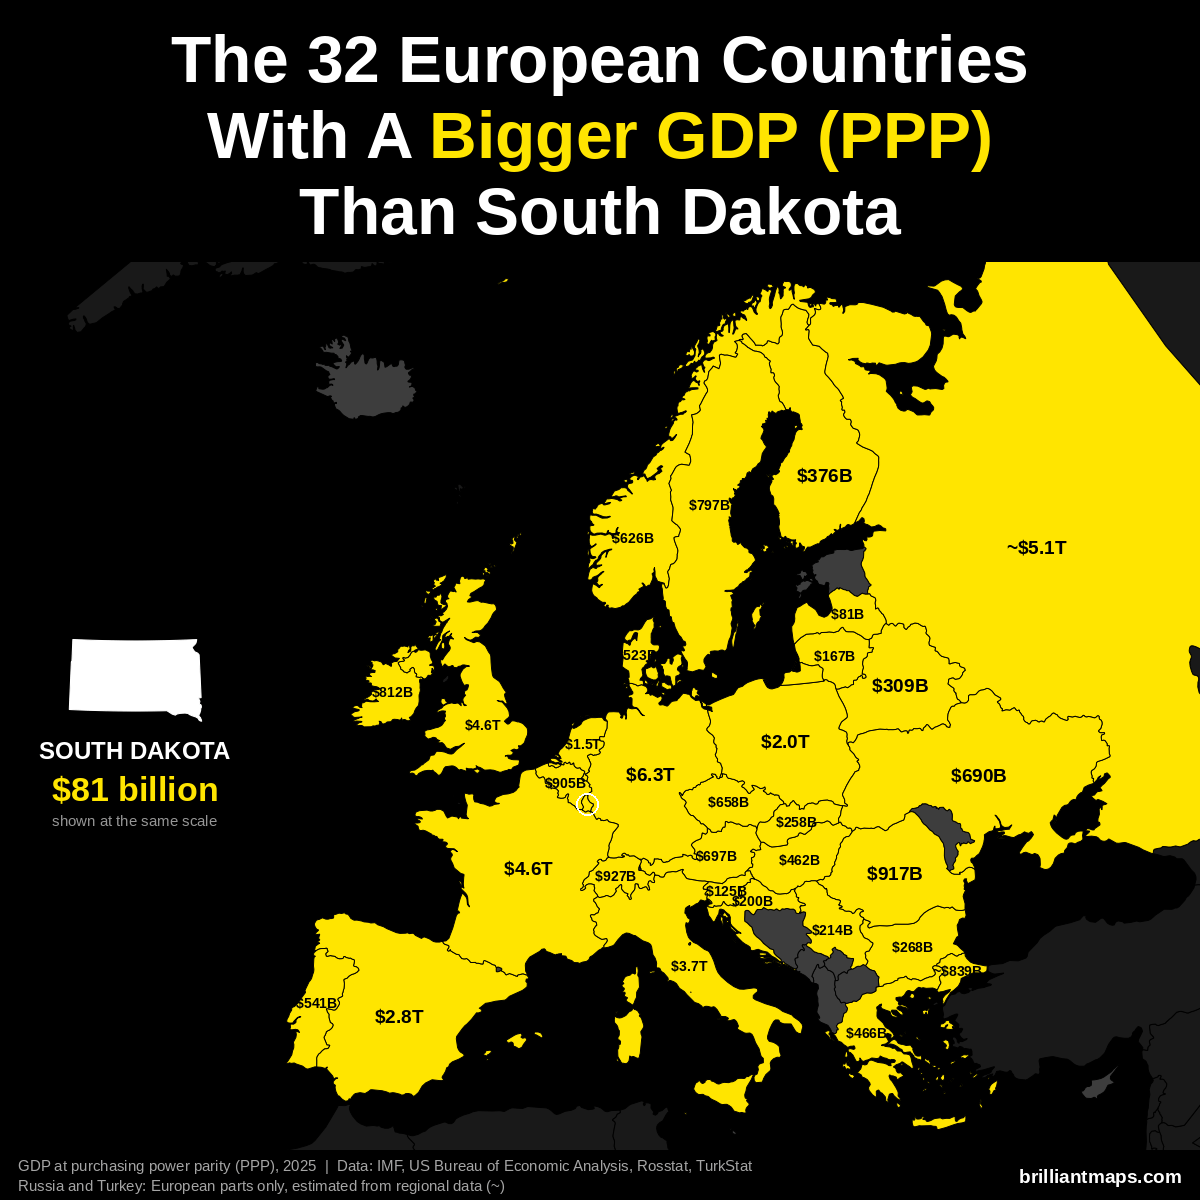
South Dakota has a GDP of $81 billion (2025). US states are already measured in the dollars PPP is based on, so the figure is the same as nominal GDP. 32 European countries have a bigger GDP at purchasing power parity:
- Germany: $6.26 trillion
- Russia (European part): ~$5.14 trillion
- France: $4.58 trillion
- United Kingdom: $4.57 trillion
- Italy: $3.74 trillion
- Spain: $2.83 trillion
- Poland: $2.04 trillion
- Netherlands: $1.52 trillion
- Switzerland: $927 billion
- Romania: $917 billion
- Belgium: $905 billion
- Turkey (European part): ~$839 billion
- Ireland: $812 billion
- Sweden: $797 billion
- Austria: $697 billion
- Ukraine: $690 billion
- Czechia: $658 billion
- Norway: $626 billion
- Portugal: $541 billion
- Denmark: $523 billion
- Greece: $466 billion
- Hungary: $462 billion
- Finland: $376 billion
- Belarus: $309 billion
- Bulgaria: $268 billion
- Slovakia: $258 billion
- Serbia: $214 billion
- Croatia: $200 billion
- Lithuania: $167 billion
- Slovenia: $125 billion
- Luxembourg: $104 billion
- Latvia: $81 billion
South Dakota Vs European GDP Per Capita (PPP)
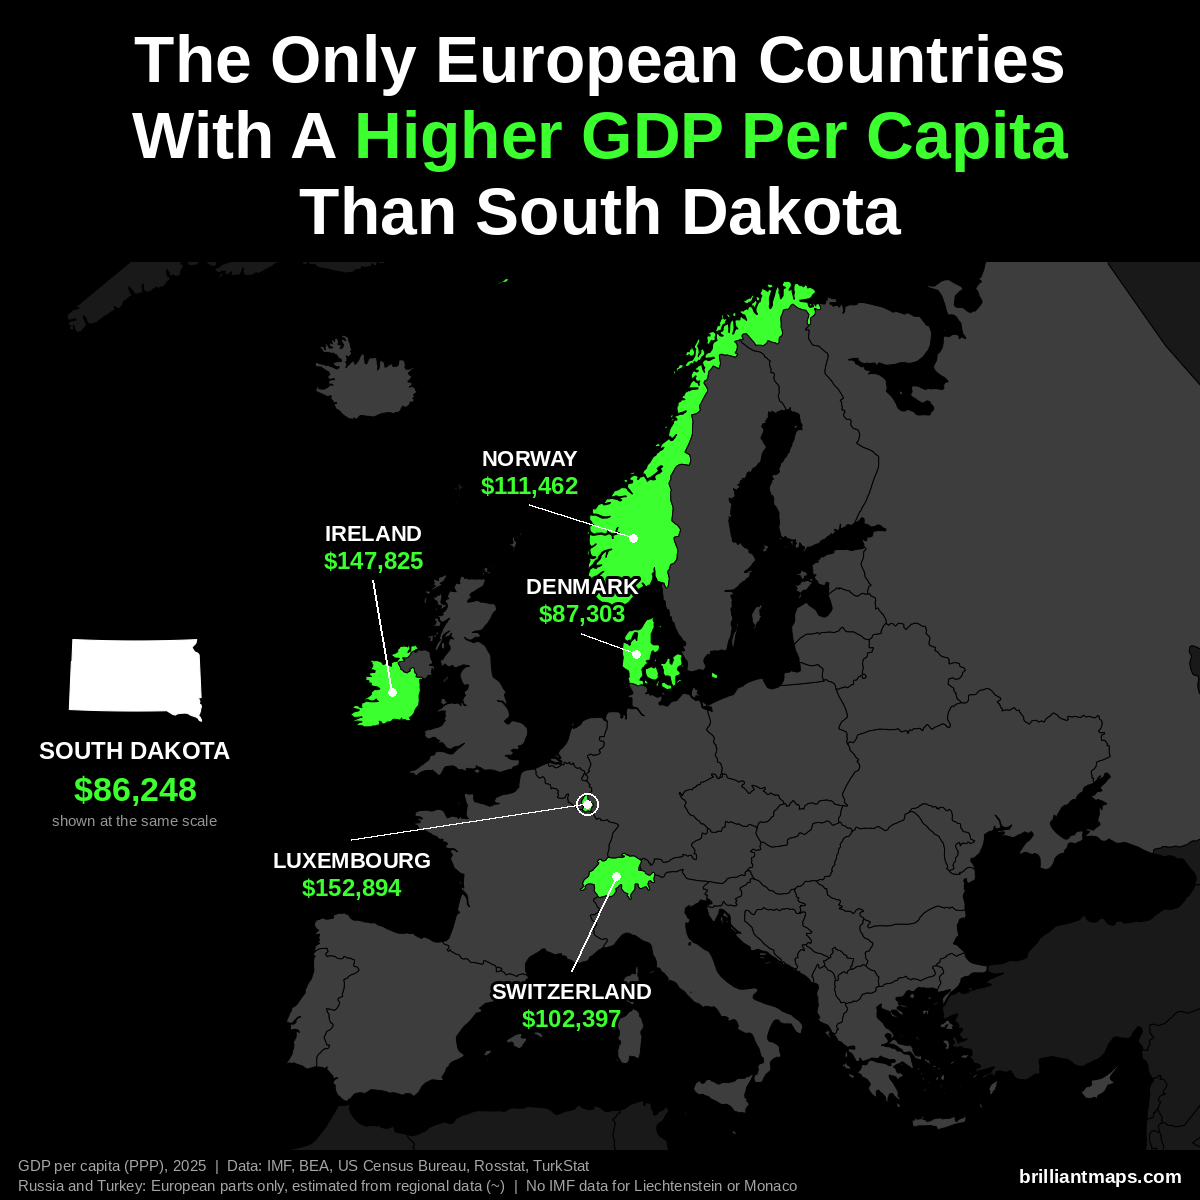
South Dakota has a GDP per capita of $86,248 (2025). Only 5 European countries have a higher GDP per capita at purchasing power parity:
- Luxembourg: $152,894
- Ireland: $147,825
- Norway: $111,462
- Switzerland: $102,397
- Denmark: $87,303
Liechtenstein and Monaco are not covered by the IMF data and are not counted here.
South Dakota Vs European Size
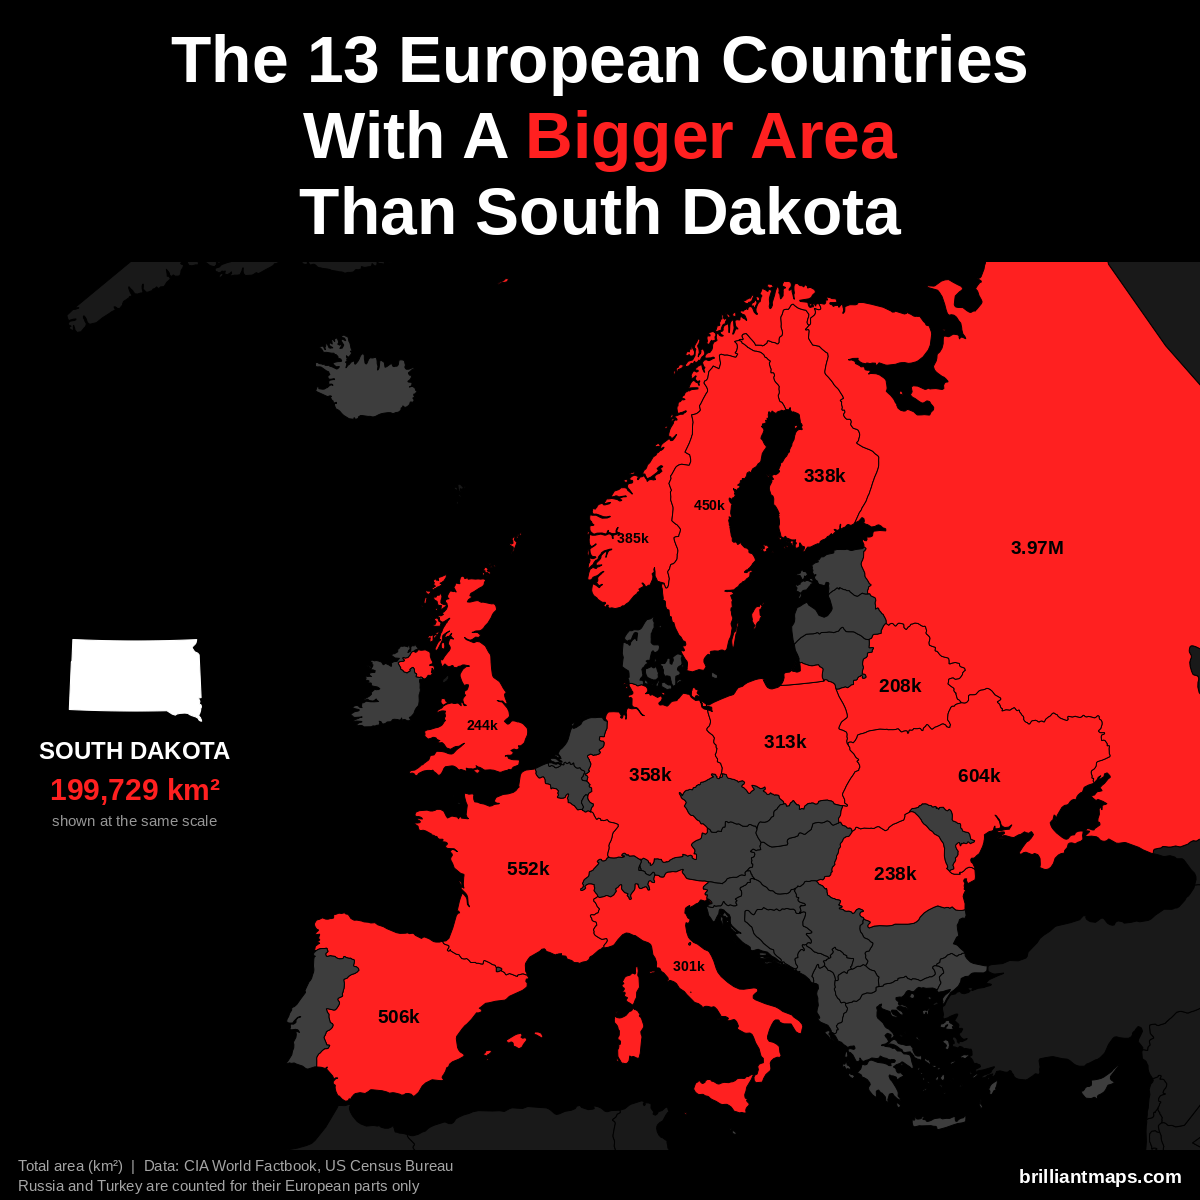
South Dakota has a total area of 199,729 km² (77,116 sq mi). 13 European countries have a bigger area:
- Russia (European part): 3,969,100 km² (1,532,477 sq mi)
- Ukraine: 603,550 km² (233,032 sq mi)
- France: 551,695 km² (213,010 sq mi)
- Spain: 505,990 km² (195,364 sq mi)
- Sweden: 450,295 km² (173,860 sq mi)
- Norway: 385,207 km² (148,729 sq mi)
- Germany: 357,588 km² (138,065 sq mi)
- Finland: 338,455 km² (130,678 sq mi)
- Poland: 312,696 km² (120,733 sq mi)
- Italy: 301,340 km² (116,348 sq mi)
- United Kingdom: 243,610 km² (94,058 sq mi)
- Romania: 238,397 km² (92,046 sq mi)
- Belarus: 207,600 km² (80,155 sq mi)
South Dakota Vs European Life Expectancy
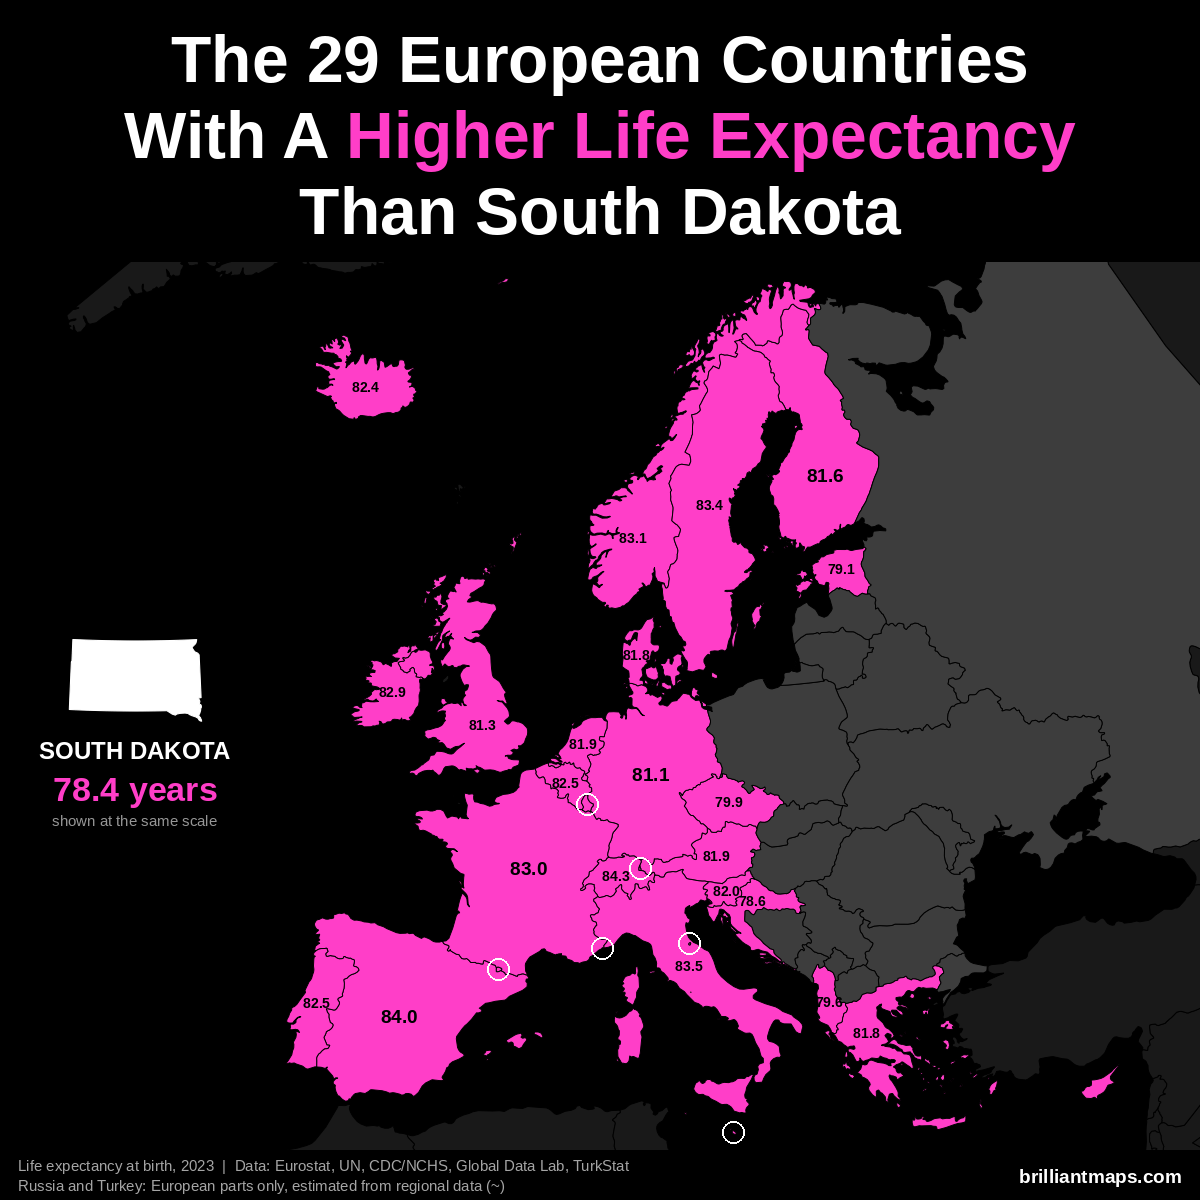
South Dakota has a life expectancy at birth of 78.4 years (2023). 29 European countries have a higher life expectancy:
- Monaco: 86.4 years
- San Marino: 85.7 years
- Liechtenstein: 84.6 years
- Switzerland: 84.3 years
- Andorra: 84.0 years
- Spain: 84.0 years
- Italy: 83.5 years
- Luxembourg: 83.4 years
- Malta: 83.4 years
- Sweden: 83.4 years
- Norway: 83.1 years
- France: 83.0 years
- Cyprus: 82.9 years
- Ireland: 82.9 years
- Belgium: 82.5 years
- Portugal: 82.5 years
- Iceland: 82.4 years
- Slovenia: 82.0 years
- Austria: 81.9 years
- Netherlands: 81.9 years
- Denmark: 81.8 years
- Greece: 81.8 years
- Finland: 81.6 years
- United Kingdom: 81.3 years
- Germany: 81.1 years
- Czechia: 79.9 years
- Albania: 79.6 years
- Estonia: 79.1 years
- Croatia: 78.6 years
Tennessee vs Europe
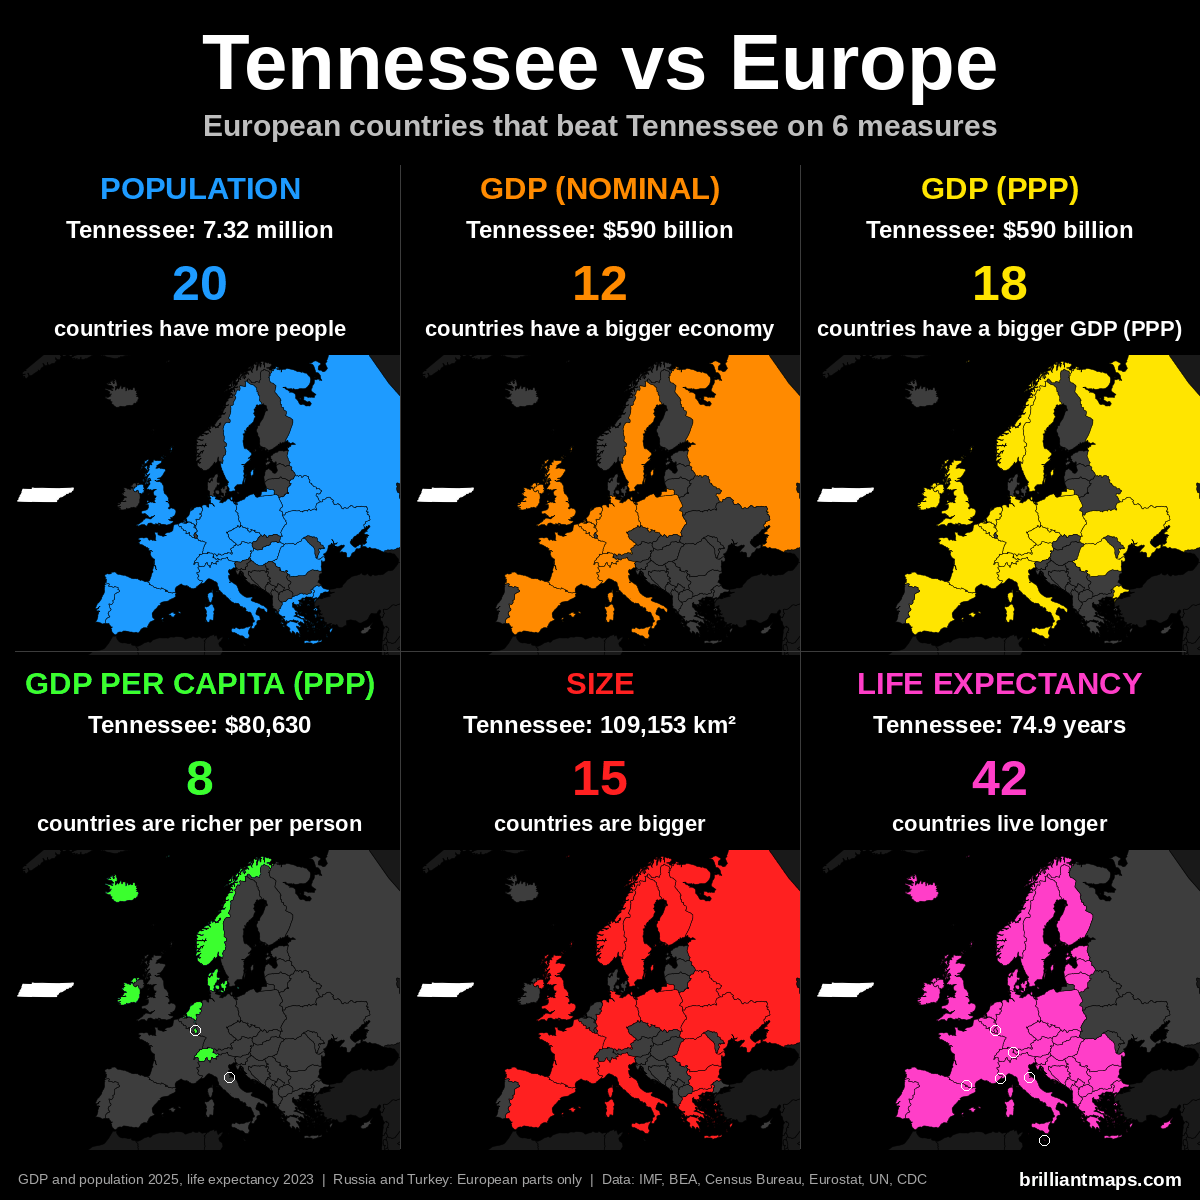
Tennessee Vs European Population
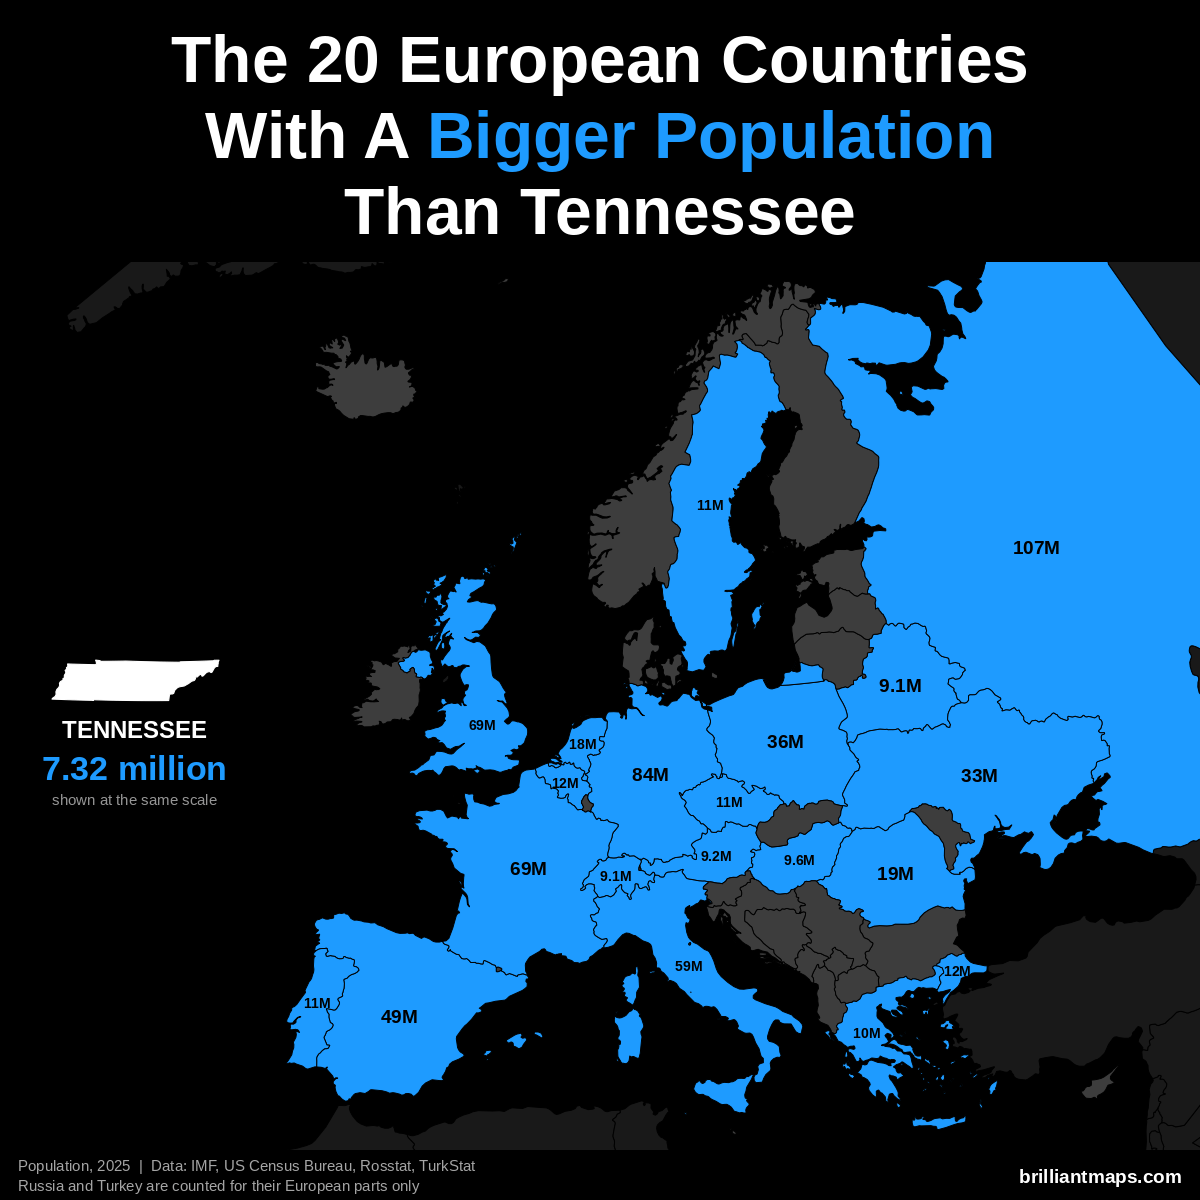
Tennessee has a population of 7.3 million (2025). 20 European countries have a bigger population:
- Russia (European part): 107.0 million
- Germany: 83.5 million
- United Kingdom: 69.5 million
- France: 68.9 million
- Italy: 58.9 million
- Spain: 49.5 million
- Poland: 36.5 million
- Ukraine: 32.9 million
- Romania: 19.0 million
- Netherlands: 18.0 million
- Turkey (European part): 12.2 million
- Belgium: 11.9 million
- Portugal: 10.8 million
- Czechia: 10.8 million
- Sweden: 10.7 million
- Greece: 10.4 million
- Hungary: 9.6 million
- Austria: 9.2 million
- Belarus: 9.1 million
- Switzerland: 9.1 million
Tennessee Vs European GDP (Nominal)
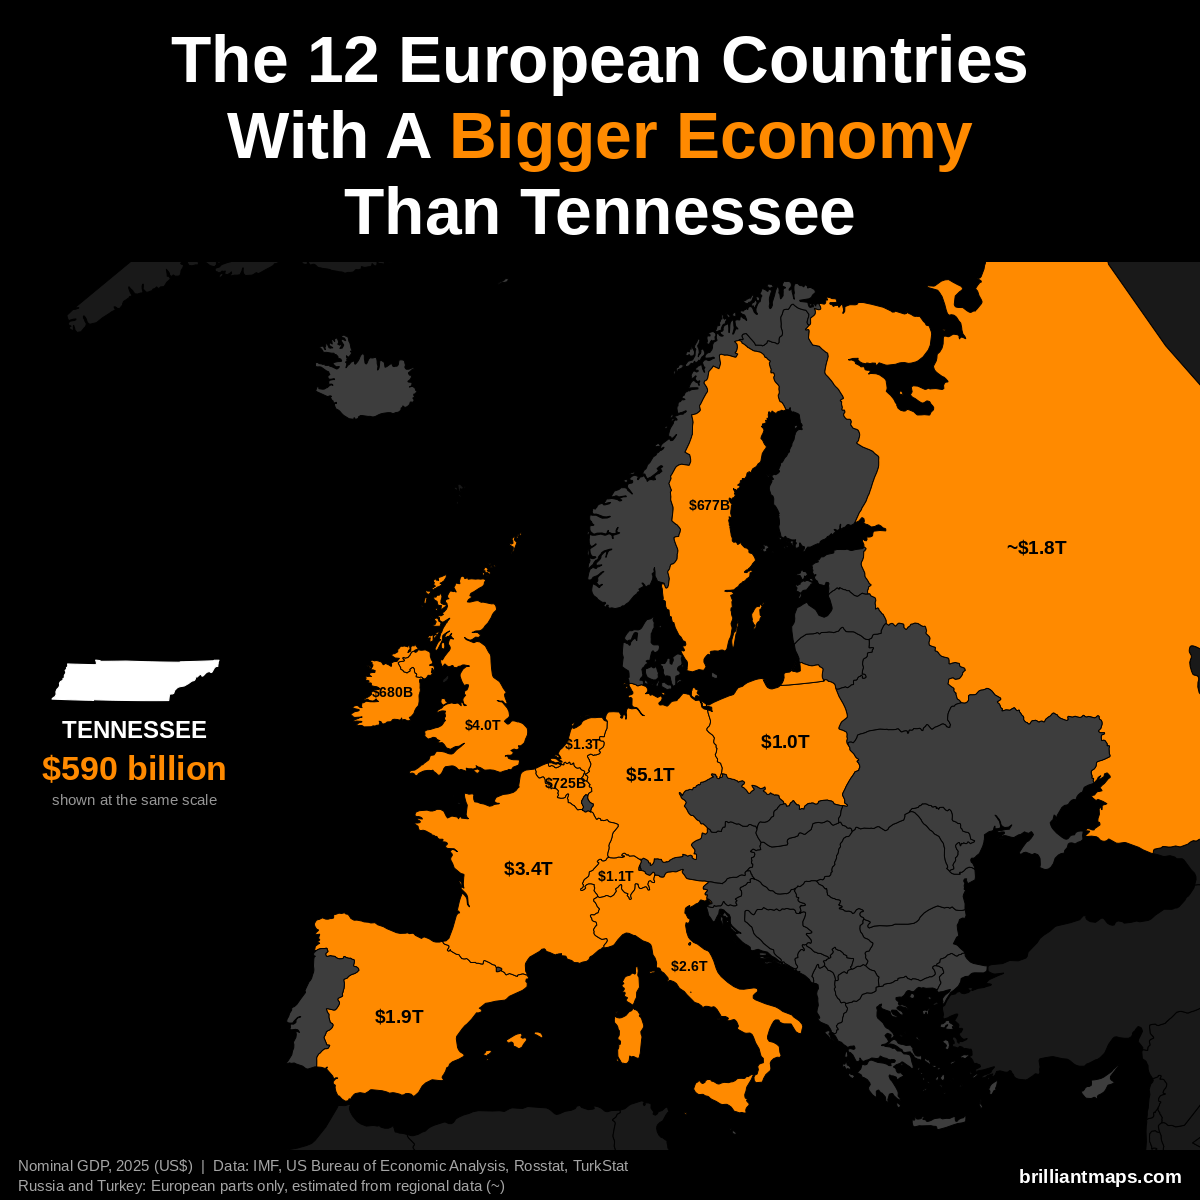
Tennessee has a nominal GDP of $590 billion (2025). 12 European countries have a bigger economy:
- Germany: $5.12 trillion
- United Kingdom: $4.01 trillion
- France: $3.38 trillion
- Italy: $2.55 trillion
- Spain: $1.91 trillion
- Russia (European part): ~$1.83 trillion
- Netherlands: $1.32 trillion
- Switzerland: $1.06 trillion
- Poland: $1.04 trillion
- Belgium: $725 billion
- Ireland: $680 billion
- Sweden: $677 billion
Tennessee Vs European GDP (PPP)
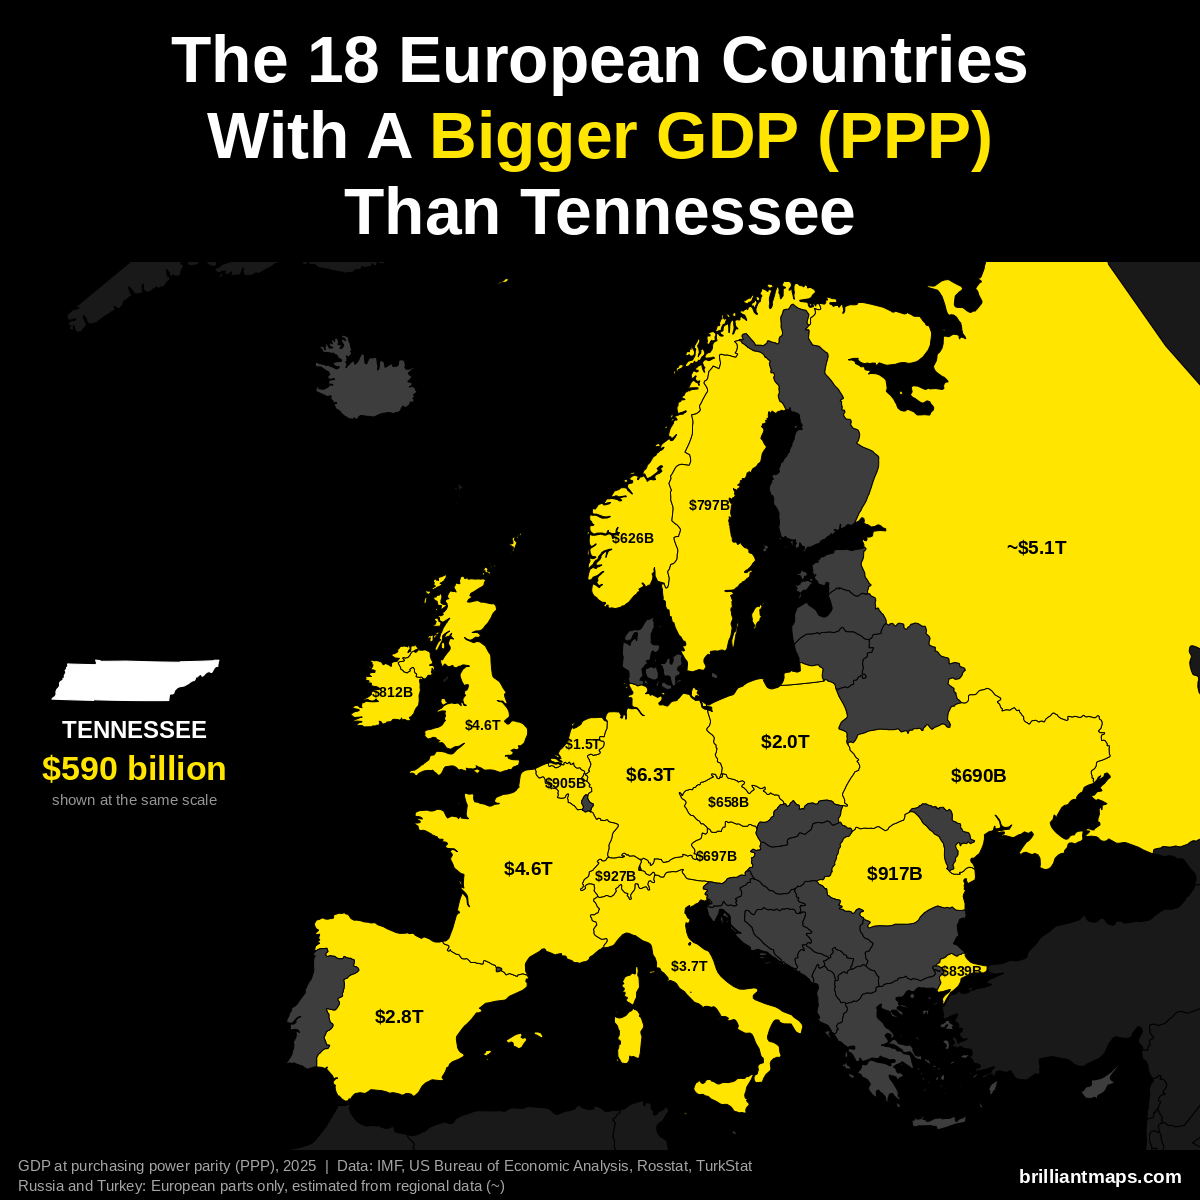
Tennessee has a GDP of $590 billion (2025). US states are already measured in the dollars PPP is based on, so the figure is the same as nominal GDP. 18 European countries have a bigger GDP at purchasing power parity:
- Germany: $6.26 trillion
- Russia (European part): ~$5.14 trillion
- France: $4.58 trillion
- United Kingdom: $4.57 trillion
- Italy: $3.74 trillion
- Spain: $2.83 trillion
- Poland: $2.04 trillion
- Netherlands: $1.52 trillion
- Switzerland: $927 billion
- Romania: $917 billion
- Belgium: $905 billion
- Turkey (European part): ~$839 billion
- Ireland: $812 billion
- Sweden: $797 billion
- Austria: $697 billion
- Ukraine: $690 billion
- Czechia: $658 billion
- Norway: $626 billion
Tennessee Vs European GDP Per Capita (PPP)
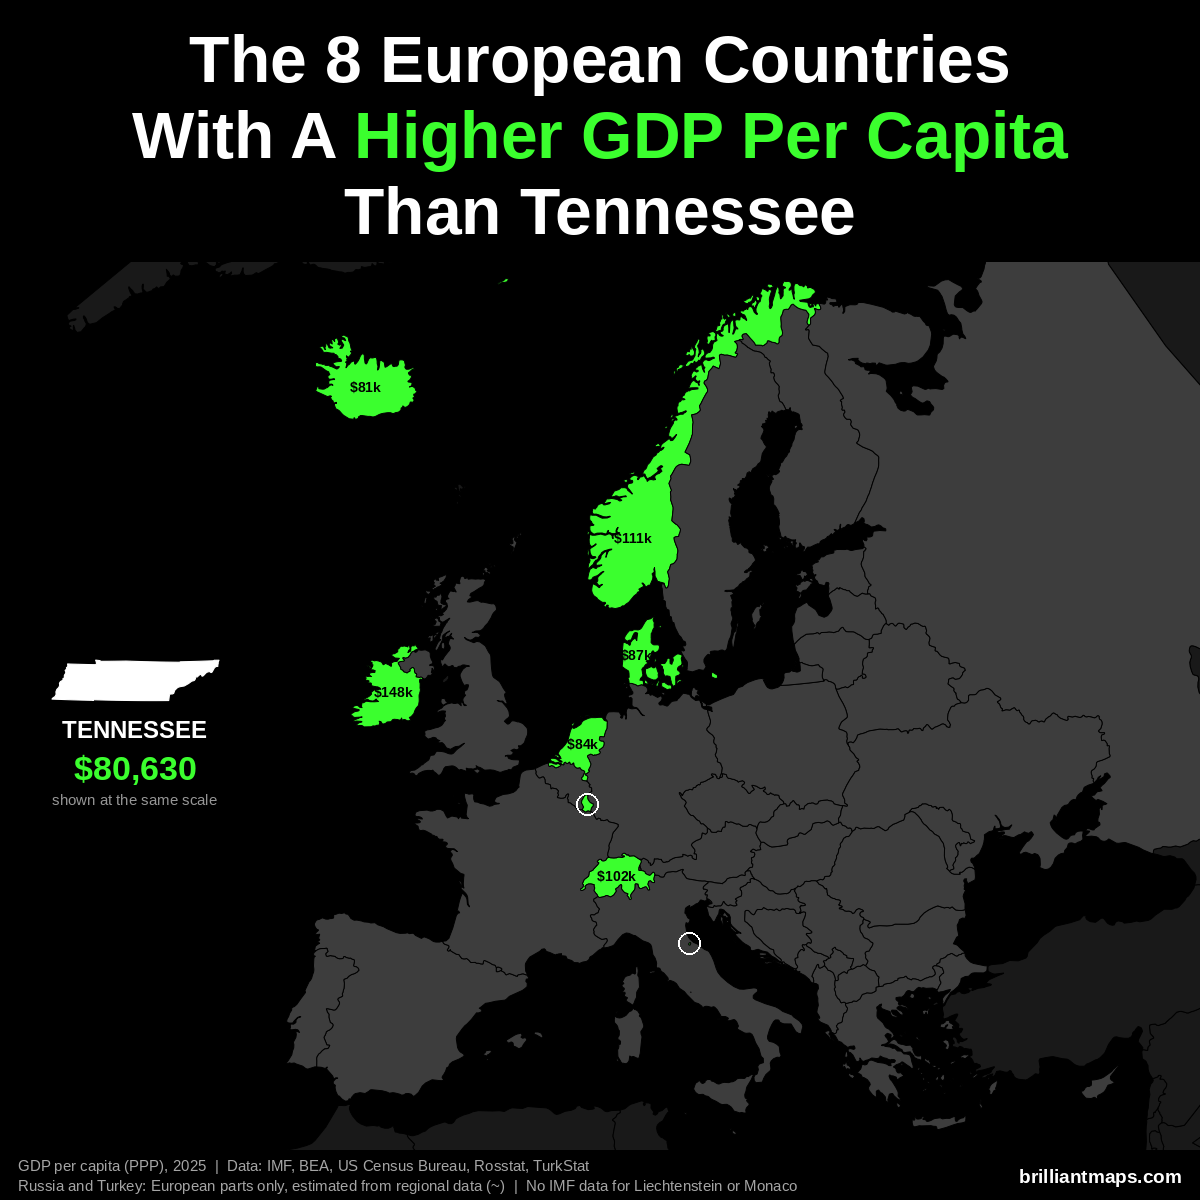
Tennessee has a GDP per capita of $80,630 (2025). 8 European countries have a higher GDP per capita at purchasing power parity:
- Luxembourg: $152,894
- Ireland: $147,825
- Norway: $111,462
- Switzerland: $102,397
- Denmark: $87,303
- Netherlands: $84,445
- San Marino: $83,838
- Iceland: $80,915
Liechtenstein and Monaco are not covered by the IMF data and are not counted here.
Tennessee Vs European Size
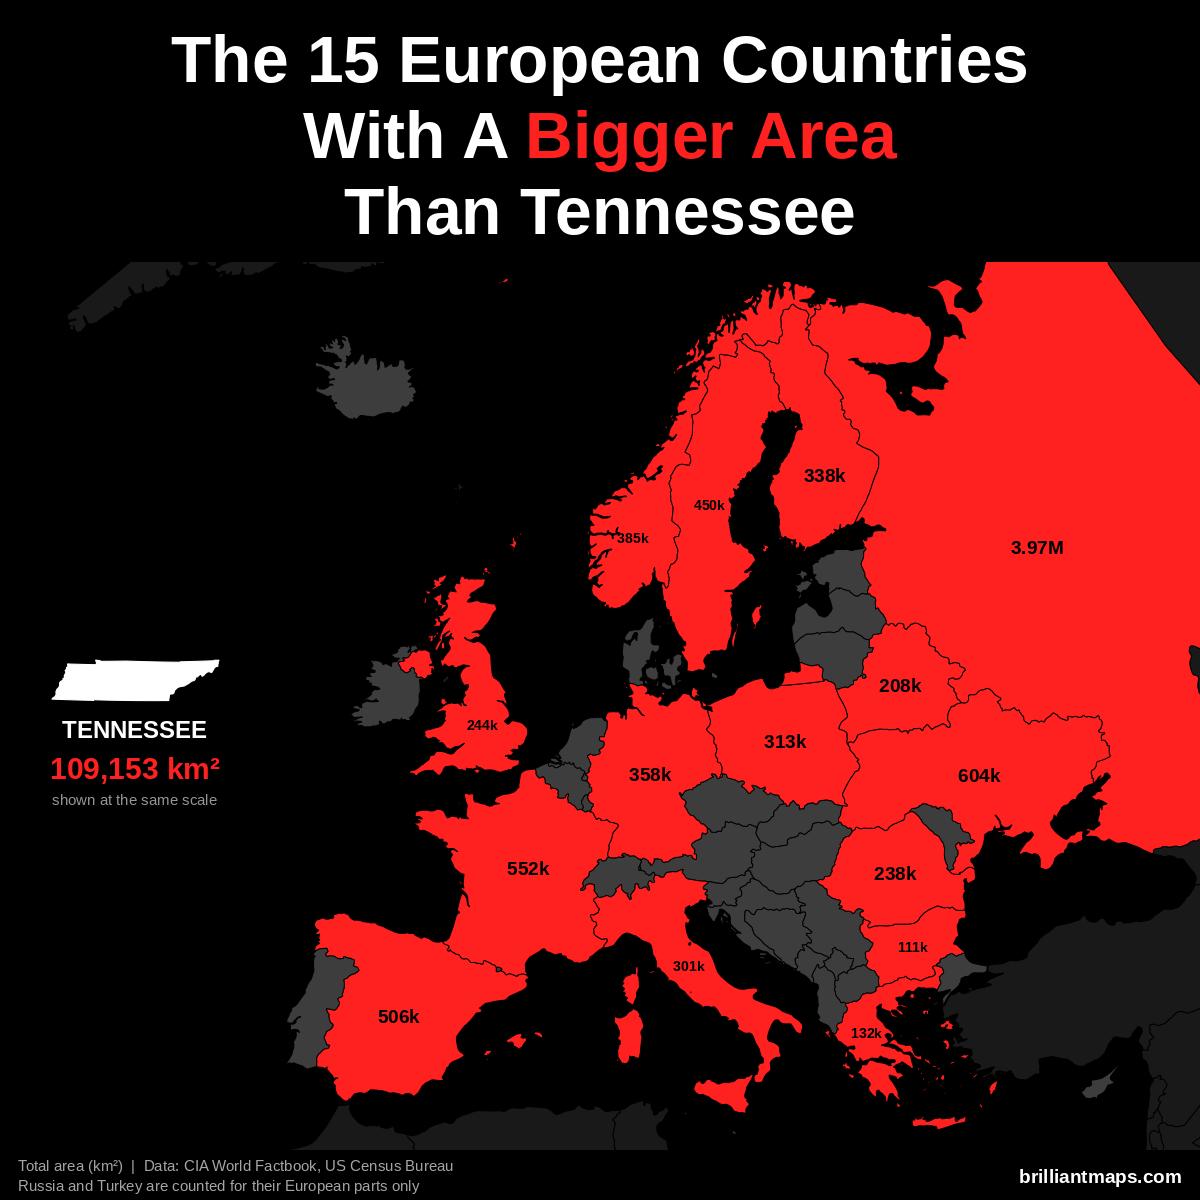
Tennessee has a total area of 109,153 km² (42,144 sq mi). 15 European countries have a bigger area:
- Russia (European part): 3,969,100 km² (1,532,477 sq mi)
- Ukraine: 603,550 km² (233,032 sq mi)
- France: 551,695 km² (213,010 sq mi)
- Spain: 505,990 km² (195,364 sq mi)
- Sweden: 450,295 km² (173,860 sq mi)
- Norway: 385,207 km² (148,729 sq mi)
- Germany: 357,588 km² (138,065 sq mi)
- Finland: 338,455 km² (130,678 sq mi)
- Poland: 312,696 km² (120,733 sq mi)
- Italy: 301,340 km² (116,348 sq mi)
- United Kingdom: 243,610 km² (94,058 sq mi)
- Romania: 238,397 km² (92,046 sq mi)
- Belarus: 207,600 km² (80,155 sq mi)
- Greece: 131,957 km² (50,949 sq mi)
- Bulgaria: 110,994 km² (42,855 sq mi)
Tennessee Vs European Life Expectancy
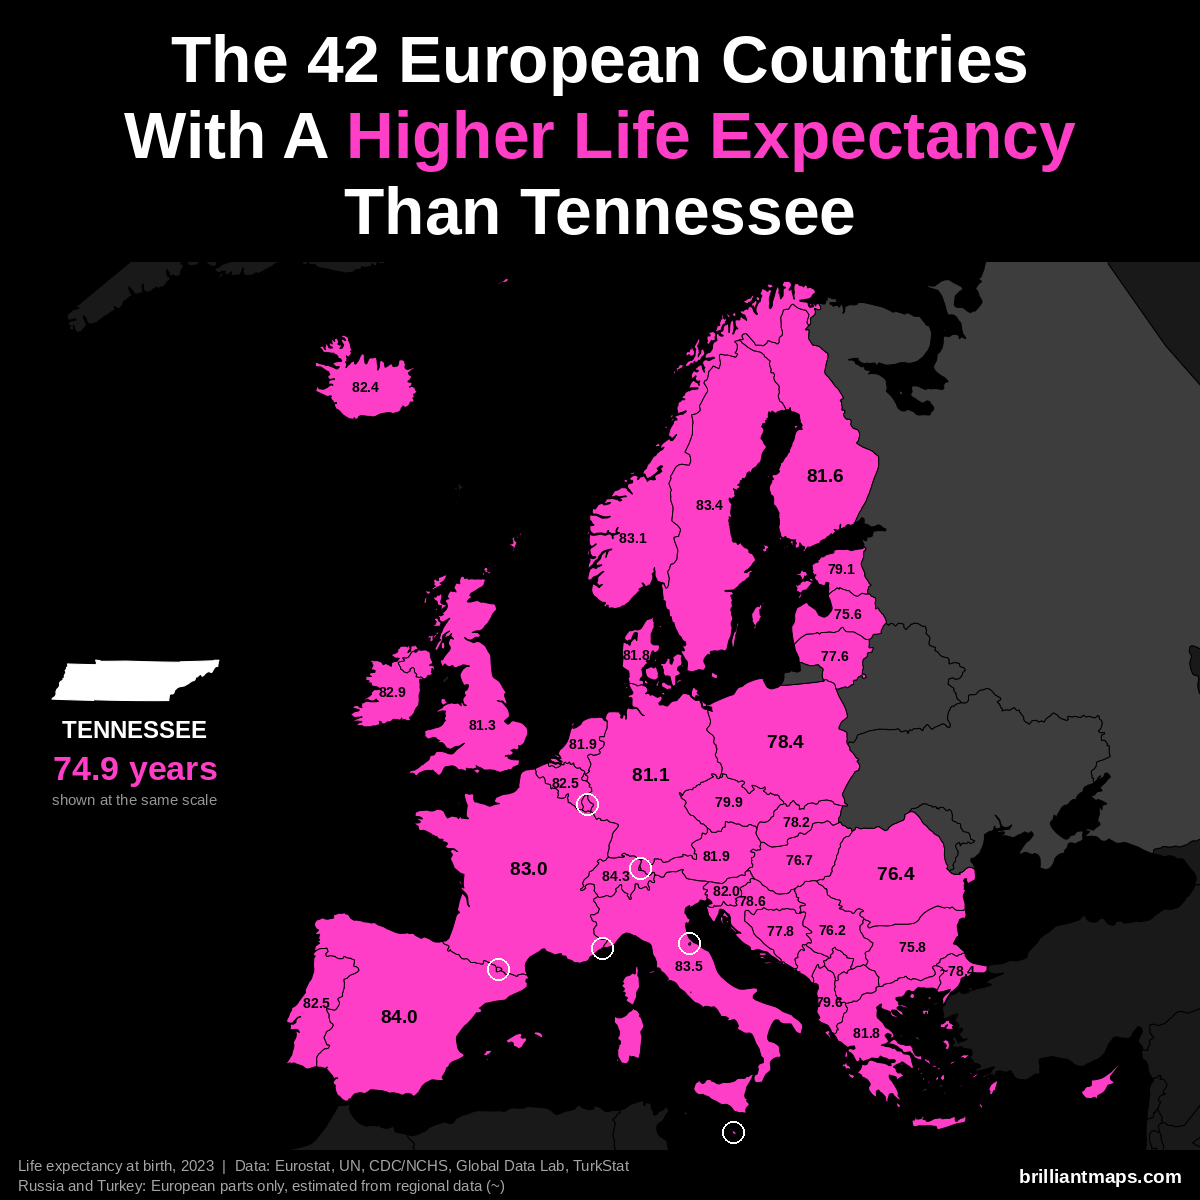
Tennessee has a life expectancy at birth of 74.9 years (2023). 42 European countries have a higher life expectancy:
- Monaco: 86.4 years
- San Marino: 85.7 years
- Liechtenstein: 84.6 years
- Switzerland: 84.3 years
- Andorra: 84.0 years
- Spain: 84.0 years
- Italy: 83.5 years
- Luxembourg: 83.4 years
- Malta: 83.4 years
- Sweden: 83.4 years
- Norway: 83.1 years
- France: 83.0 years
- Cyprus: 82.9 years
- Ireland: 82.9 years
- Belgium: 82.5 years
- Portugal: 82.5 years
- Iceland: 82.4 years
- Slovenia: 82.0 years
- Austria: 81.9 years
- Netherlands: 81.9 years
- Denmark: 81.8 years
- Greece: 81.8 years
- Finland: 81.6 years
- United Kingdom: 81.3 years
- Germany: 81.1 years
- Czechia: 79.9 years
- Albania: 79.6 years
- Estonia: 79.1 years
- Croatia: 78.6 years
- Poland: 78.4 years
- Turkey (European part): ~78.4 years
- Slovakia: 78.2 years
- Kosovo: 78.0 years
- Bosnia and Herzegovina: 77.8 years
- Lithuania: 77.6 years
- Montenegro: 77.6 years
- North Macedonia: 77.4 years
- Hungary: 76.7 years
- Romania: 76.4 years
- Serbia: 76.2 years
- Bulgaria: 75.8 years
- Latvia: 75.6 years
Texas vs Europe
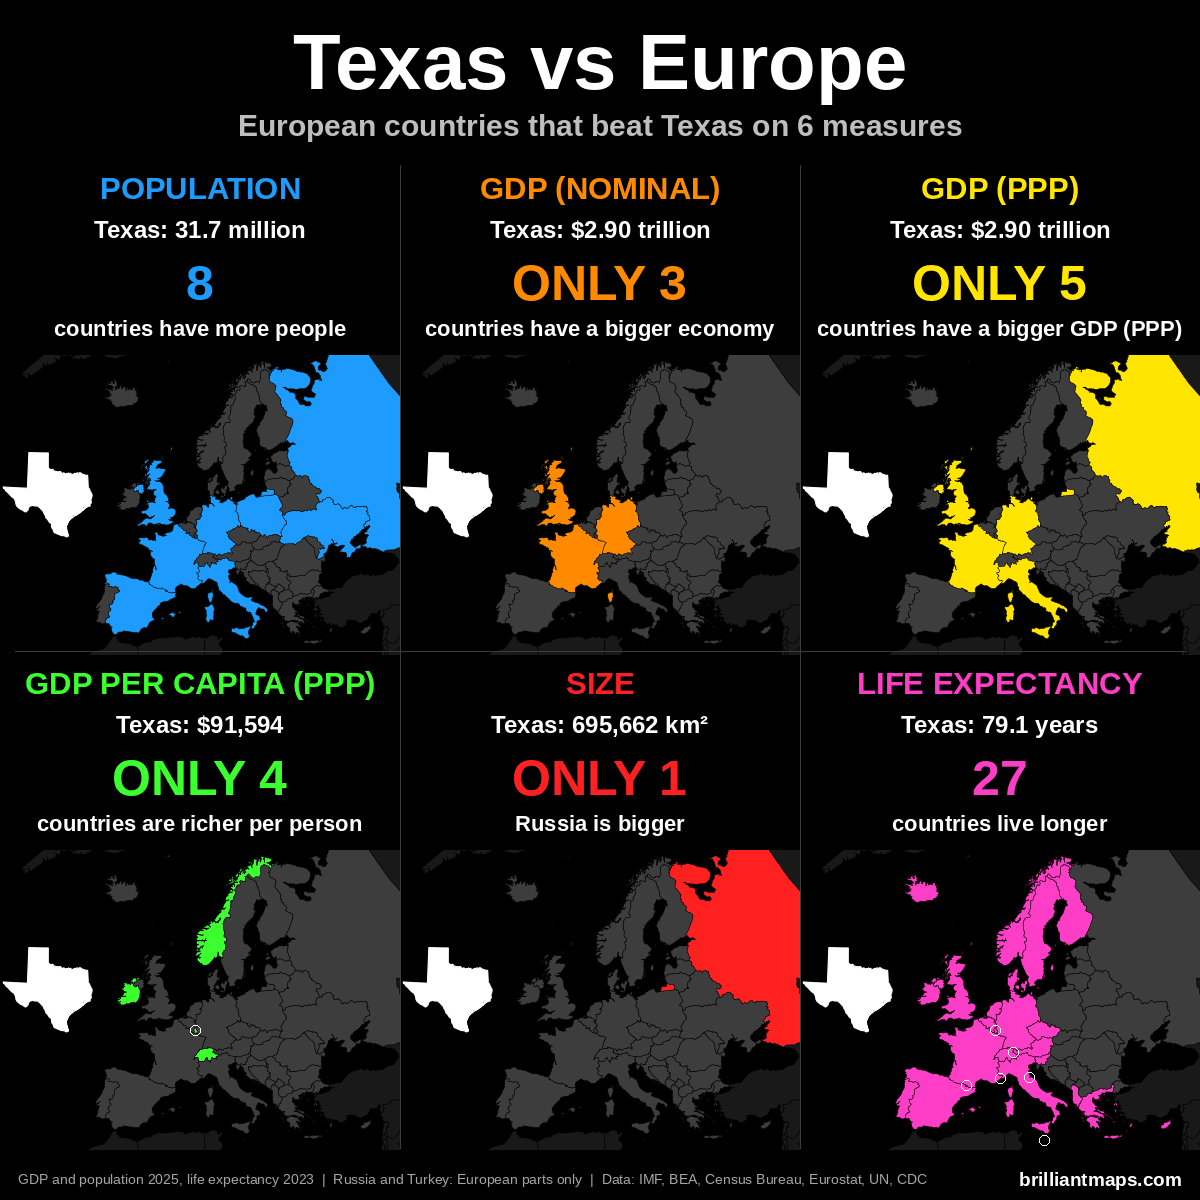
Texas Vs European Population
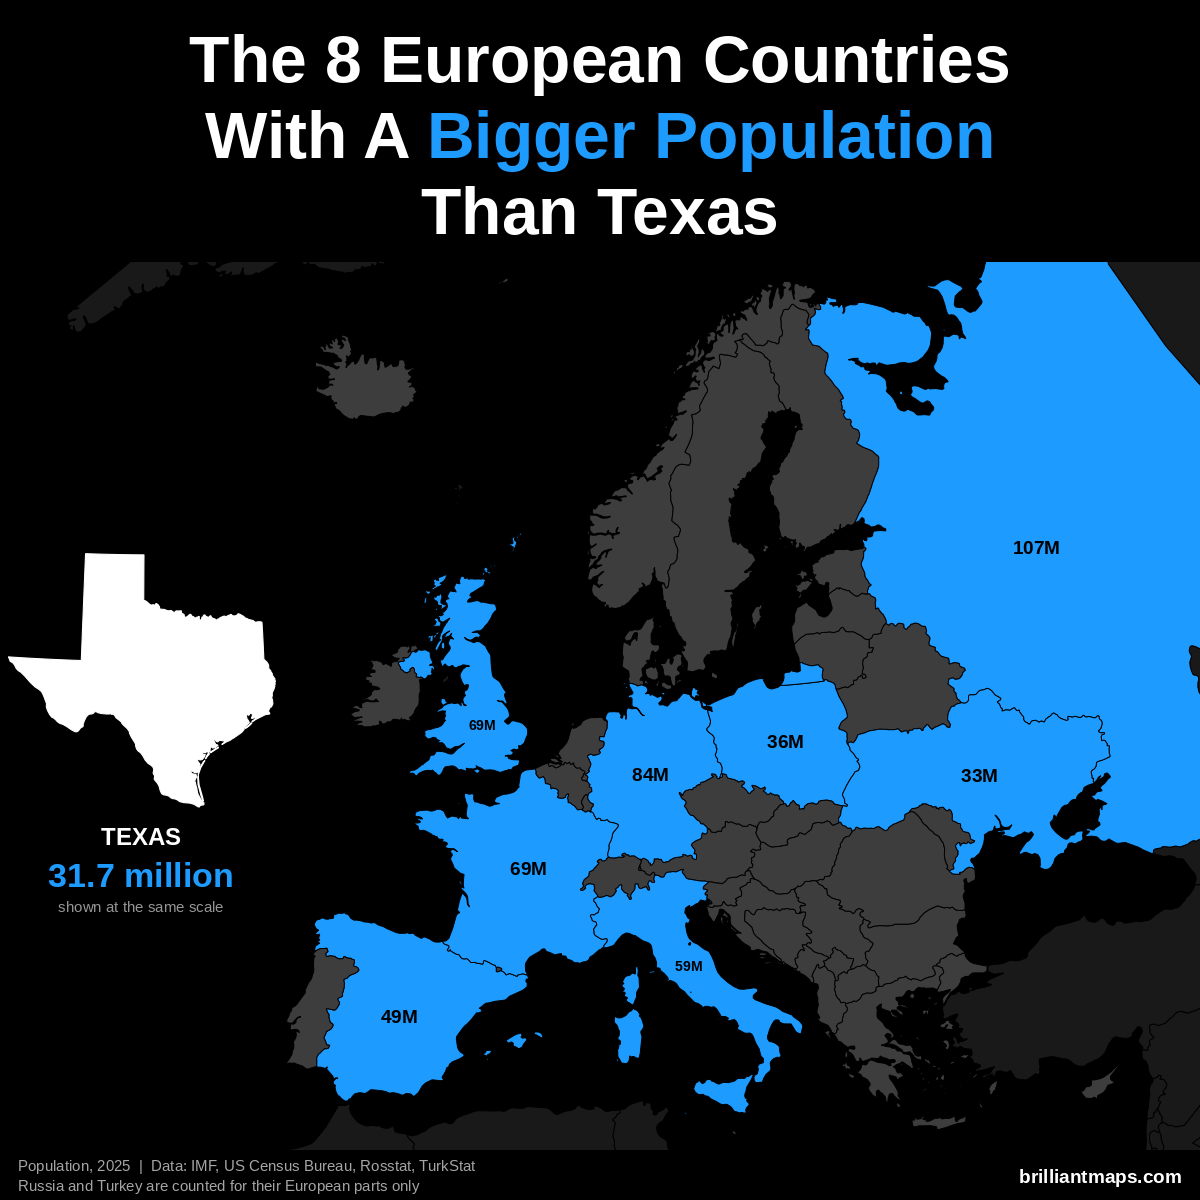
Texas has a population of 31.7 million (2025). 8 European countries have a bigger population:
- Russia (European part): 107.0 million
- Germany: 83.5 million
- United Kingdom: 69.5 million
- France: 68.9 million
- Italy: 58.9 million
- Spain: 49.5 million
- Poland: 36.5 million
- Ukraine: 32.9 million
Texas Vs European GDP (Nominal)
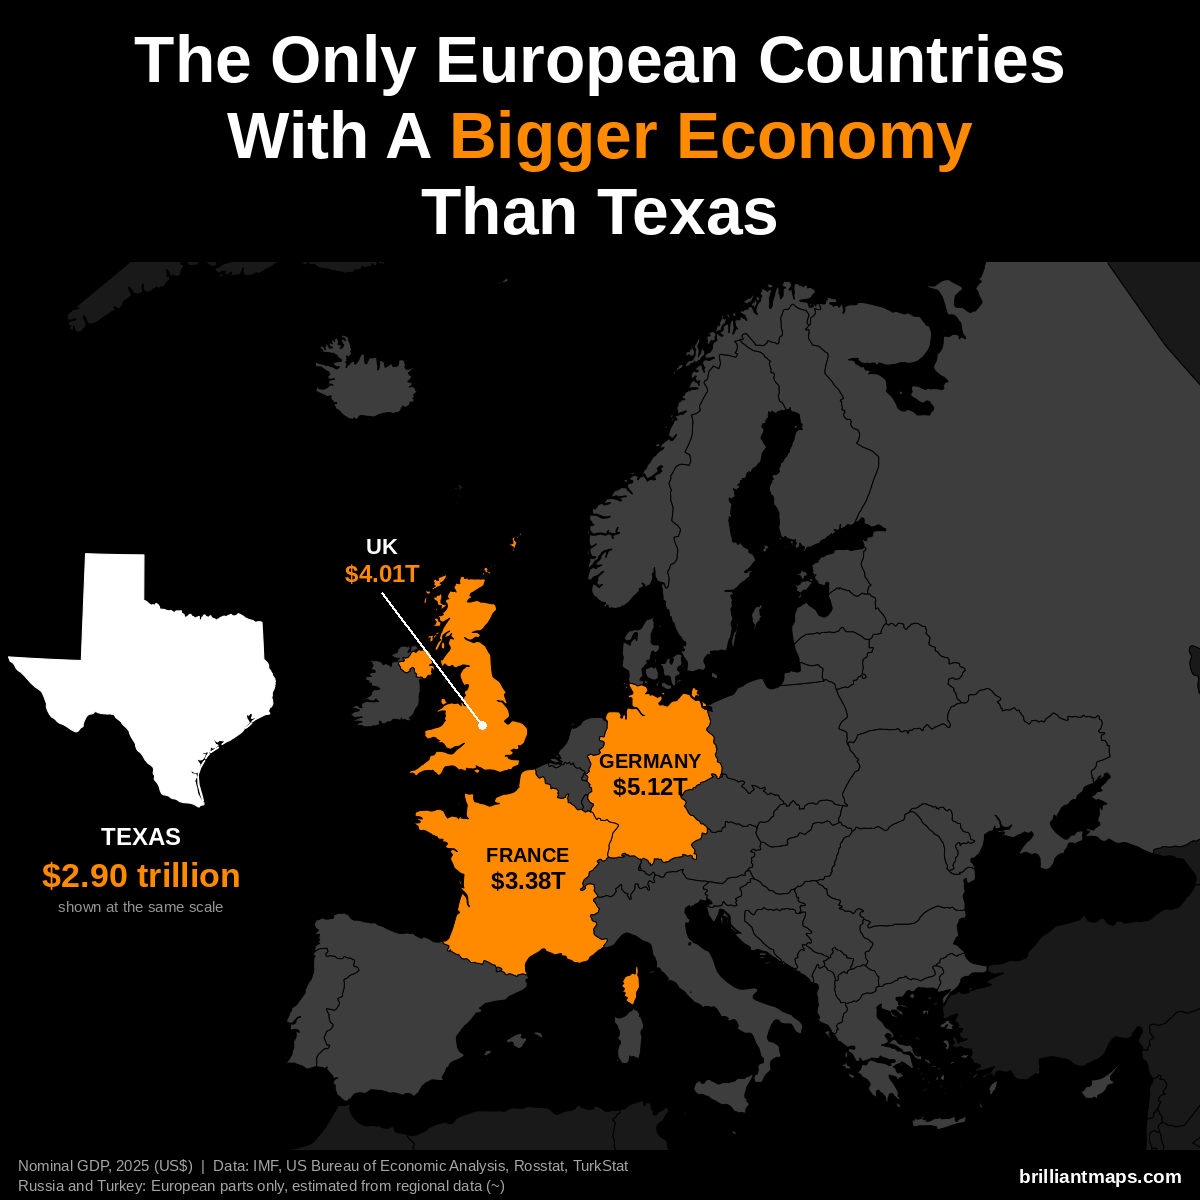
Texas has a nominal GDP of $2.90 trillion (2025). Only 3 European countries have a bigger economy:
- Germany: $5.12 trillion
- United Kingdom: $4.01 trillion
- France: $3.38 trillion
Texas Vs European GDP (PPP)
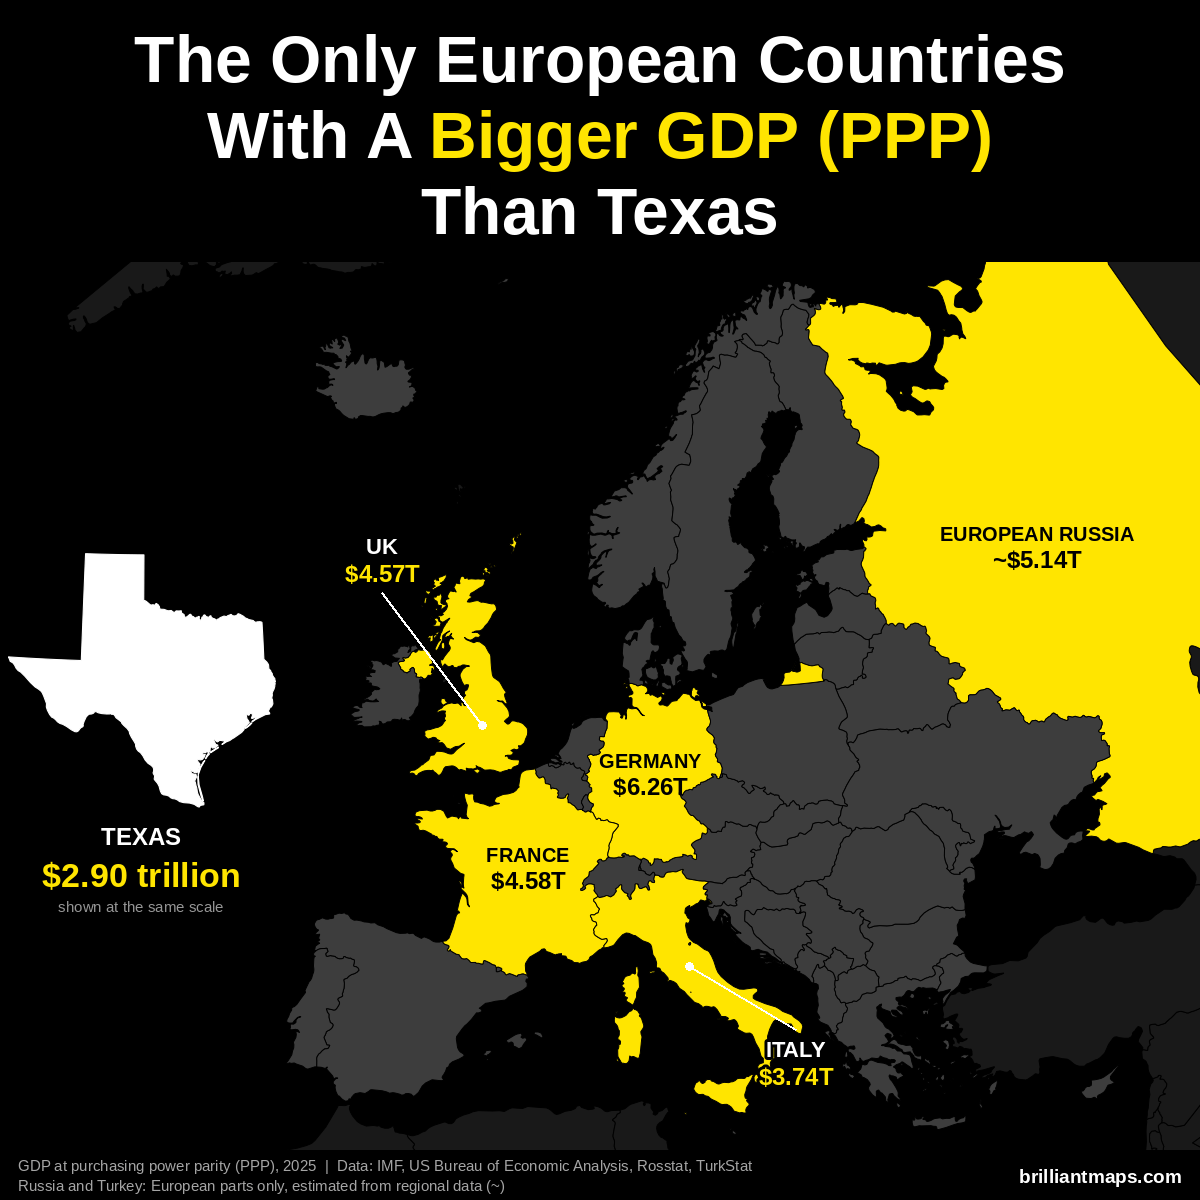
Texas has a GDP of $2.90 trillion (2025). US states are already measured in the dollars PPP is based on, so the figure is the same as nominal GDP. Only 5 European countries have a bigger GDP at purchasing power parity:
- Germany: $6.26 trillion
- Russia (European part): ~$5.14 trillion
- France: $4.58 trillion
- United Kingdom: $4.57 trillion
- Italy: $3.74 trillion
Texas Vs European GDP Per Capita (PPP)
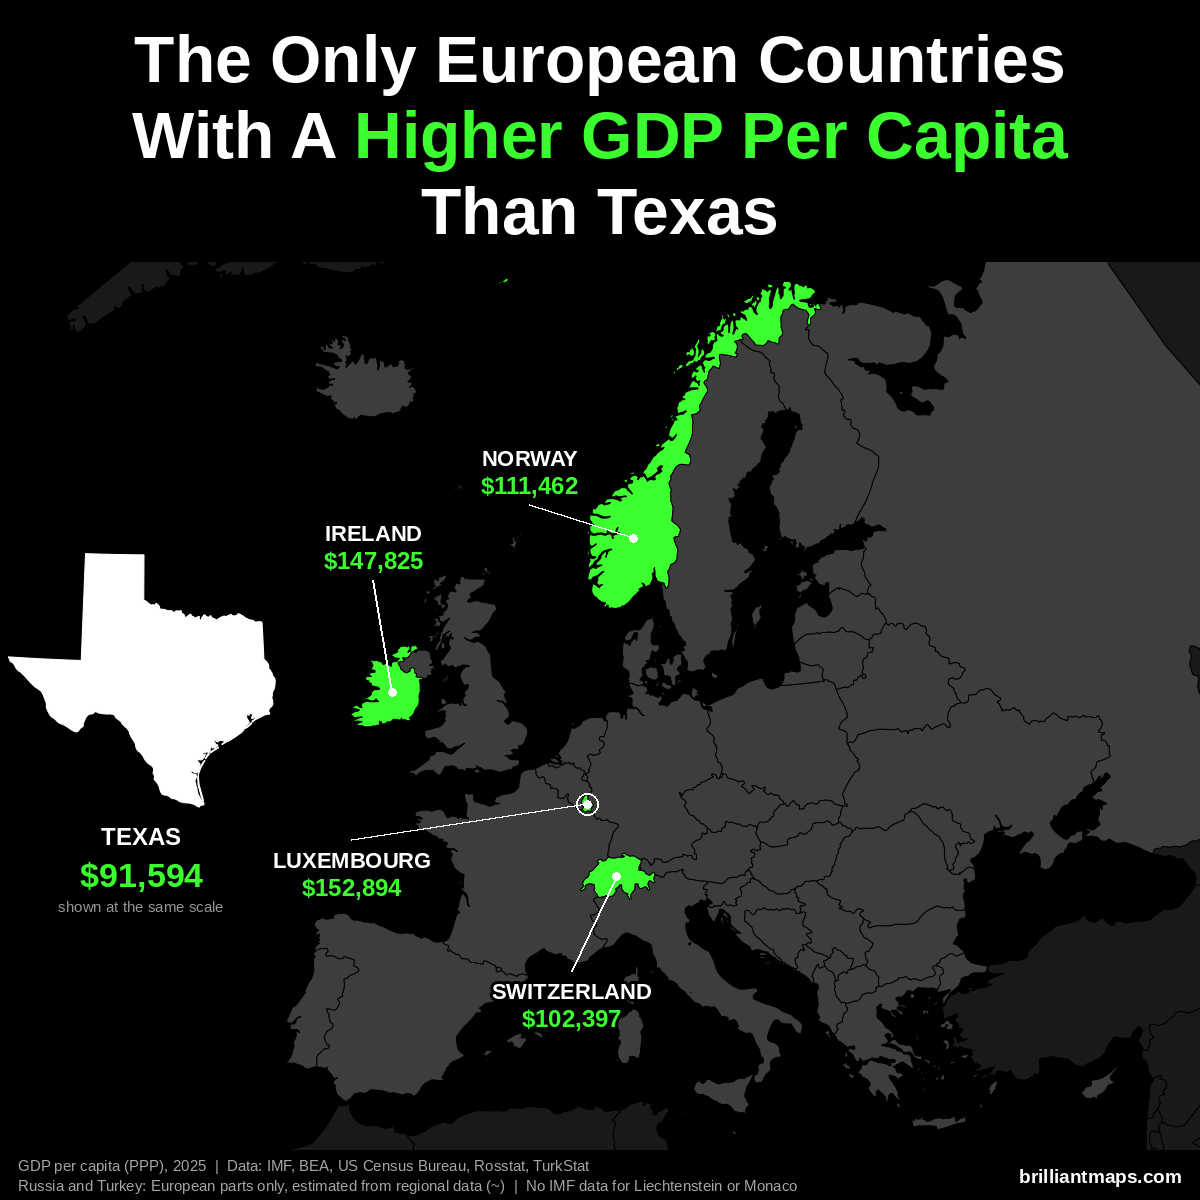
Texas has a GDP per capita of $91,594 (2025). Only 4 European countries have a higher GDP per capita at purchasing power parity:
- Luxembourg: $152,894
- Ireland: $147,825
- Norway: $111,462
- Switzerland: $102,397
Liechtenstein and Monaco are not covered by the IMF data and are not counted here.
Texas Vs European Size
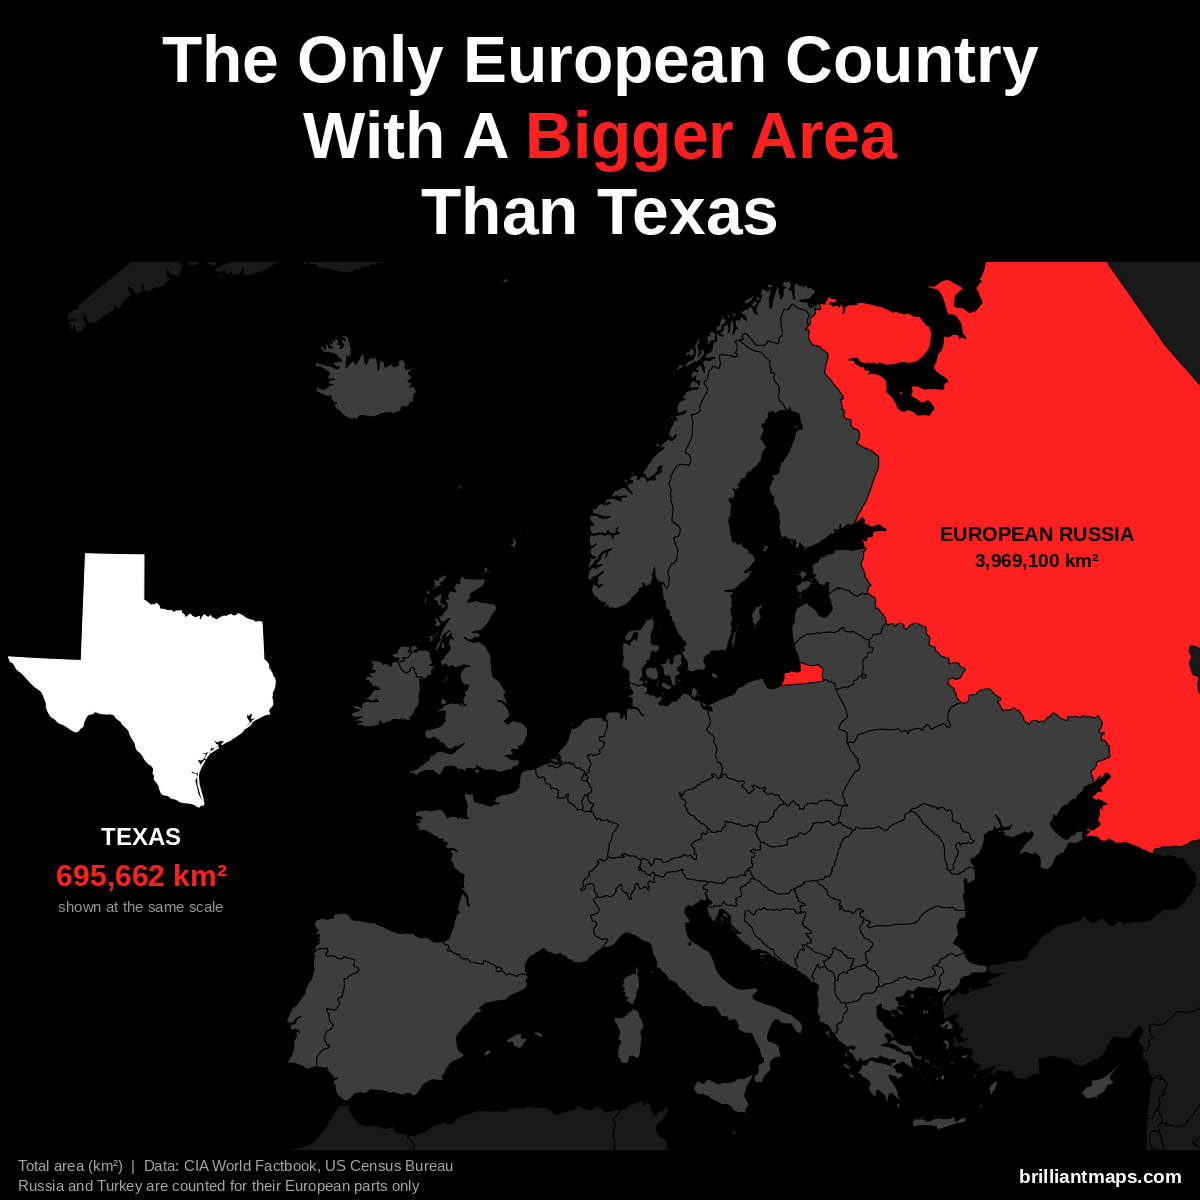
Texas has a total area of 695,662 km² (268,596 sq mi). Only 1 European country has a bigger area:
- Russia (European part): 3,969,100 km² (1,532,477 sq mi)
Texas Vs European Life Expectancy
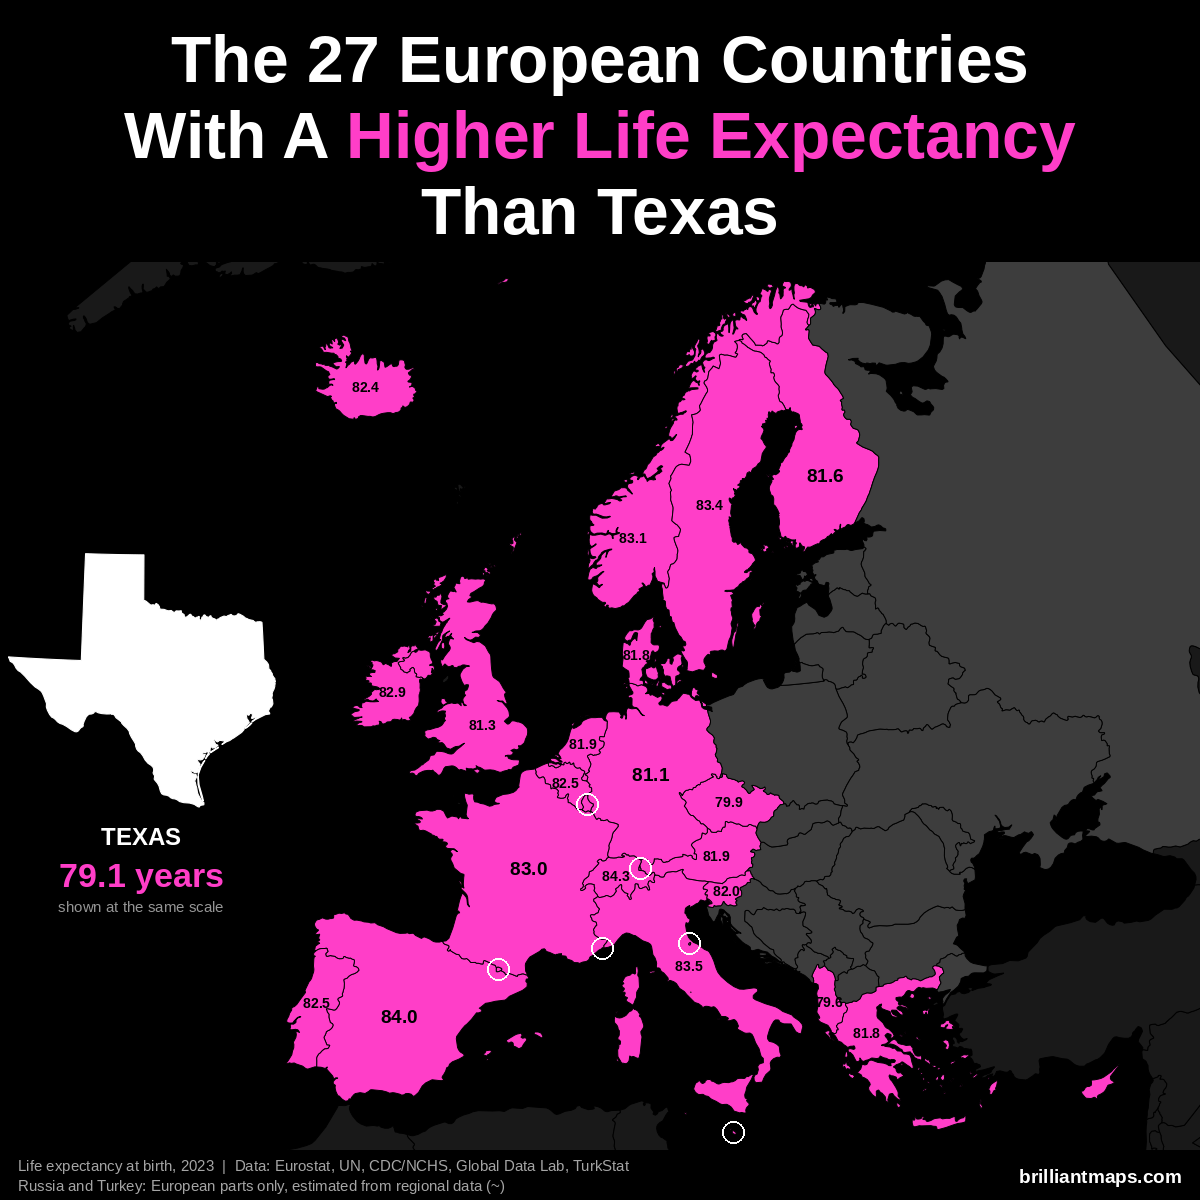
Texas has a life expectancy at birth of 79.1 years (2023). 27 European countries have a higher life expectancy:
- Monaco: 86.4 years
- San Marino: 85.7 years
- Liechtenstein: 84.6 years
- Switzerland: 84.3 years
- Andorra: 84.0 years
- Spain: 84.0 years
- Italy: 83.5 years
- Luxembourg: 83.4 years
- Malta: 83.4 years
- Sweden: 83.4 years
- Norway: 83.1 years
- France: 83.0 years
- Cyprus: 82.9 years
- Ireland: 82.9 years
- Belgium: 82.5 years
- Portugal: 82.5 years
- Iceland: 82.4 years
- Slovenia: 82.0 years
- Austria: 81.9 years
- Netherlands: 81.9 years
- Denmark: 81.8 years
- Greece: 81.8 years
- Finland: 81.6 years
- United Kingdom: 81.3 years
- Germany: 81.1 years
- Czechia: 79.9 years
- Albania: 79.6 years
Utah vs Europe
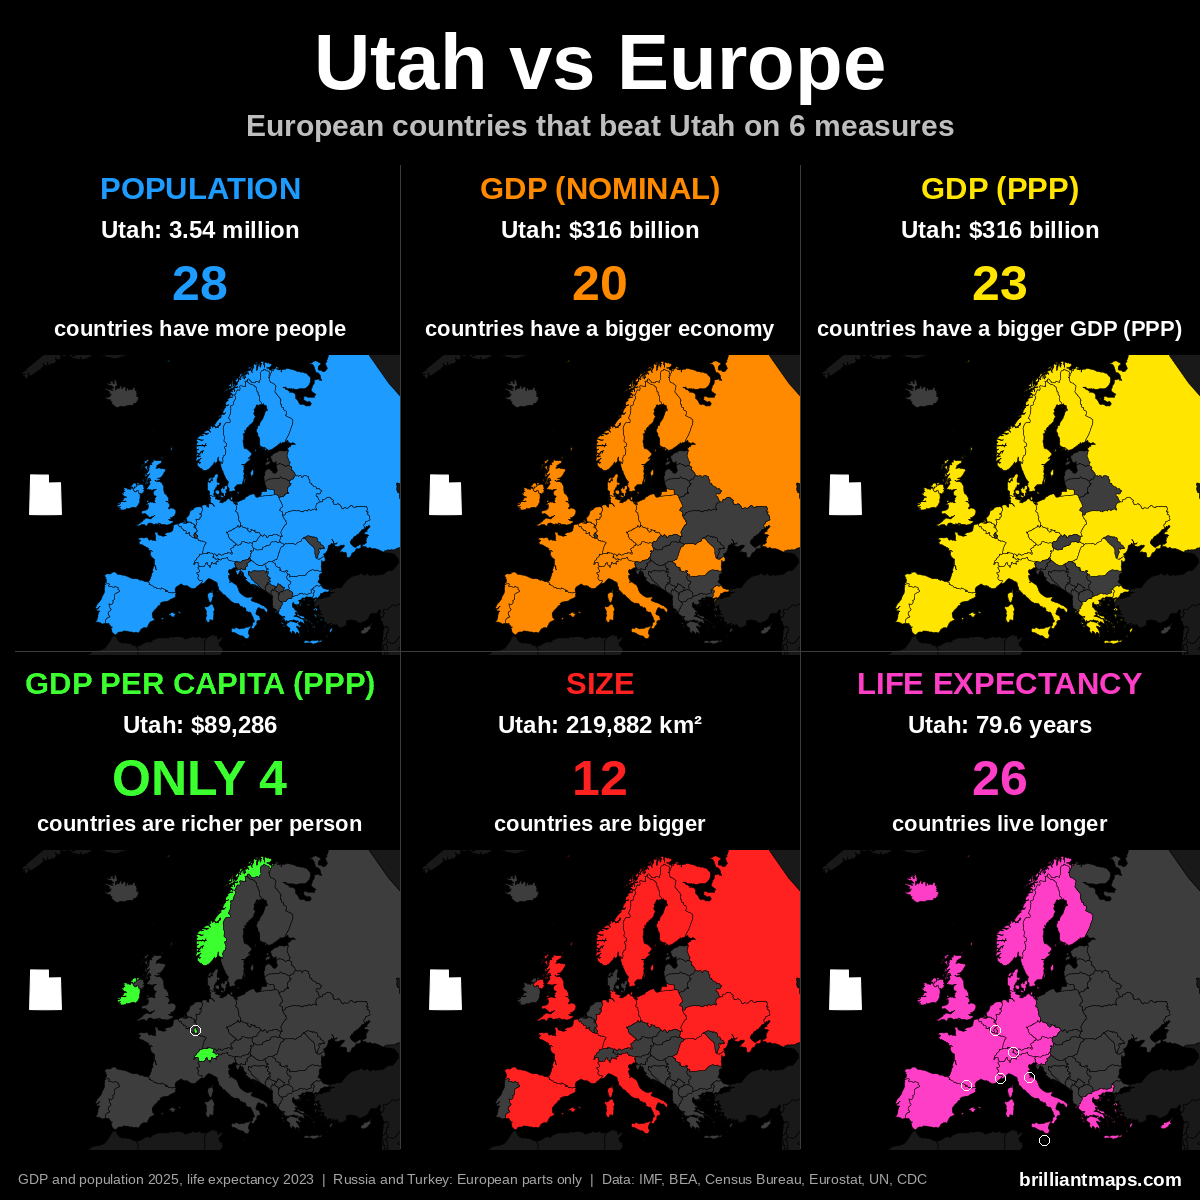
Utah Vs European Population
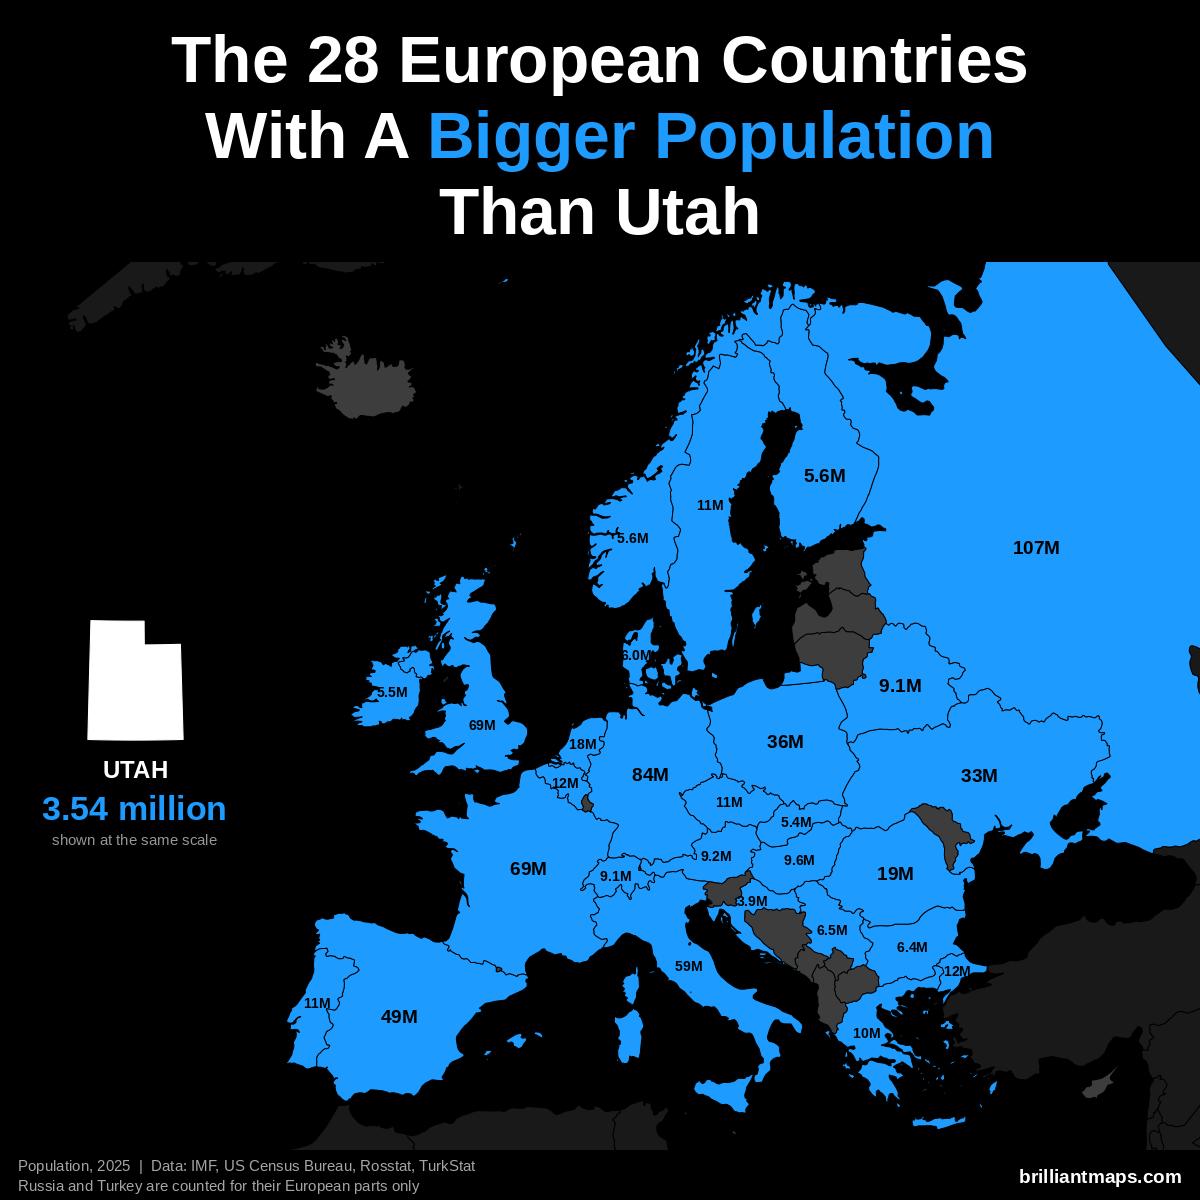
Utah has a population of 3.5 million (2025). 28 European countries have a bigger population:
- Russia (European part): 107.0 million
- Germany: 83.5 million
- United Kingdom: 69.5 million
- France: 68.9 million
- Italy: 58.9 million
- Spain: 49.5 million
- Poland: 36.5 million
- Ukraine: 32.9 million
- Romania: 19.0 million
- Netherlands: 18.0 million
- Turkey (European part): 12.2 million
- Belgium: 11.9 million
- Portugal: 10.8 million
- Czechia: 10.8 million
- Sweden: 10.7 million
- Greece: 10.4 million
- Hungary: 9.6 million
- Austria: 9.2 million
- Belarus: 9.1 million
- Switzerland: 9.1 million
- Serbia: 6.5 million
- Bulgaria: 6.4 million
- Denmark: 6.0 million
- Norway: 5.6 million
- Finland: 5.6 million
- Ireland: 5.5 million
- Slovakia: 5.4 million
- Croatia: 3.9 million
Utah Vs European GDP (Nominal)
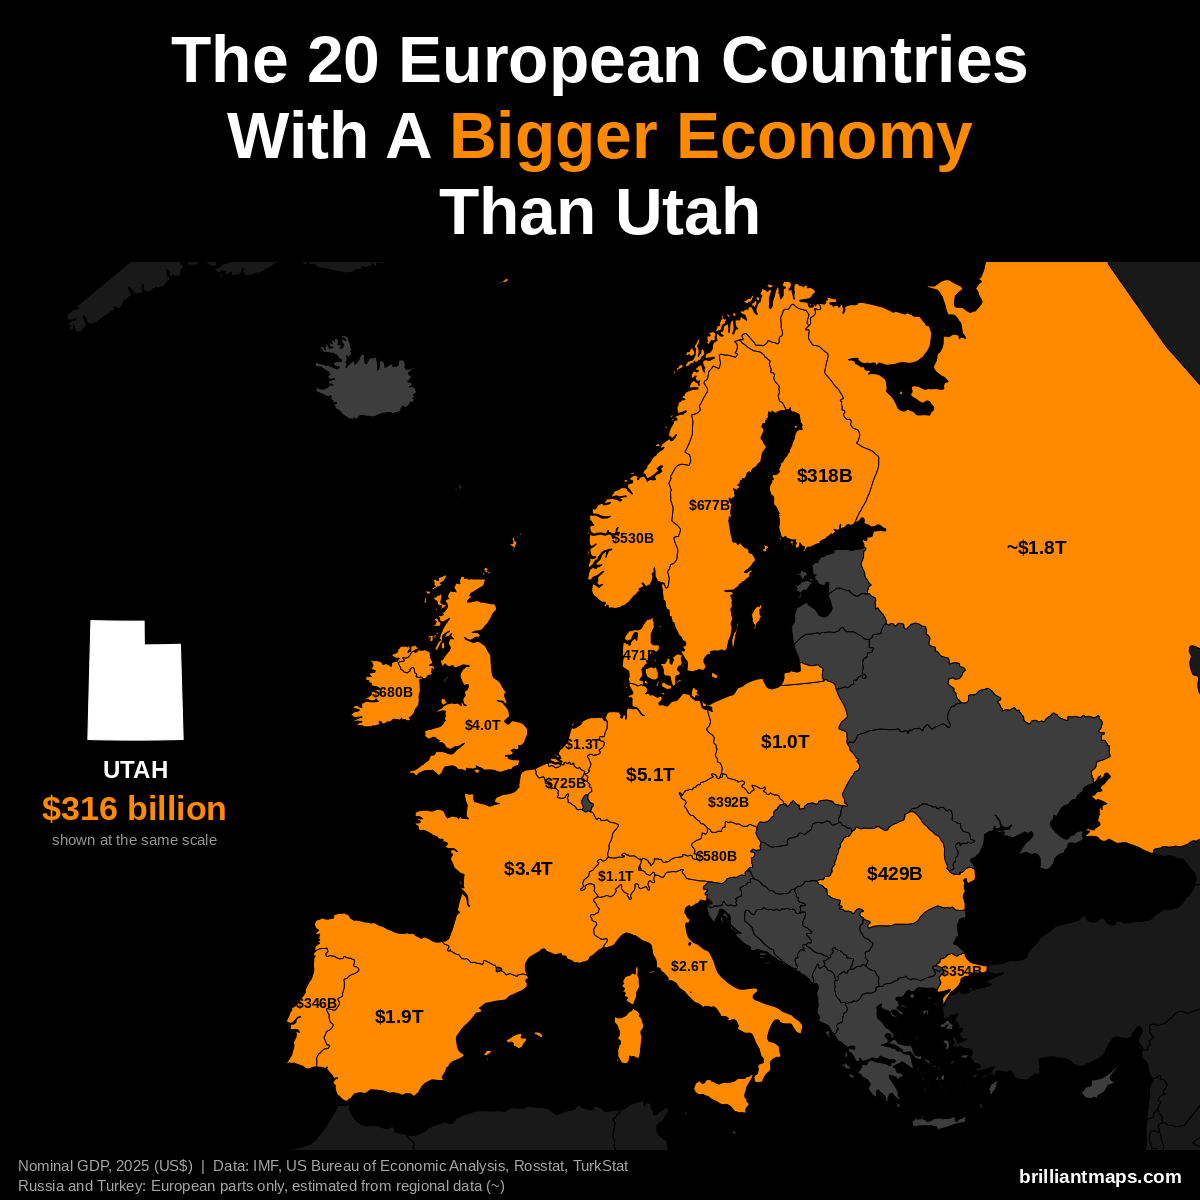
Utah has a nominal GDP of $316 billion (2025). 20 European countries have a bigger economy:
- Germany: $5.12 trillion
- United Kingdom: $4.01 trillion
- France: $3.38 trillion
- Italy: $2.55 trillion
- Spain: $1.91 trillion
- Russia (European part): ~$1.83 trillion
- Netherlands: $1.32 trillion
- Switzerland: $1.06 trillion
- Poland: $1.04 trillion
- Belgium: $725 billion
- Ireland: $680 billion
- Sweden: $677 billion
- Austria: $580 billion
- Norway: $530 billion
- Denmark: $471 billion
- Romania: $429 billion
- Czechia: $392 billion
- Turkey (European part): ~$354 billion
- Portugal: $346 billion
- Finland: $318 billion
Utah Vs European GDP (PPP)
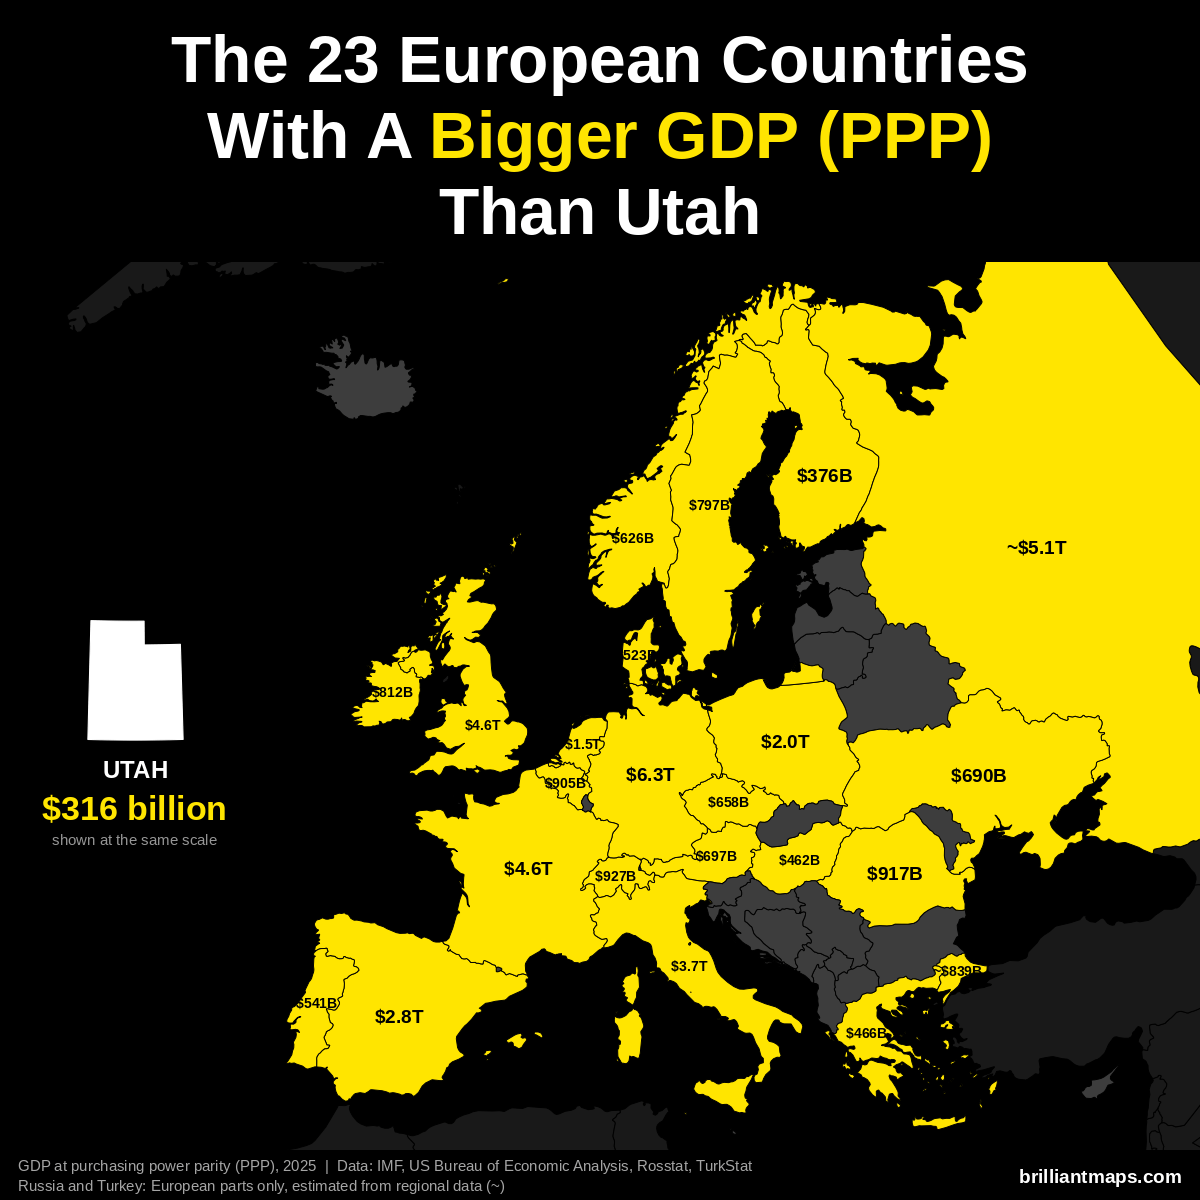
Utah has a GDP of $316 billion (2025). US states are already measured in the dollars PPP is based on, so the figure is the same as nominal GDP. 23 European countries have a bigger GDP at purchasing power parity:
- Germany: $6.26 trillion
- Russia (European part): ~$5.14 trillion
- France: $4.58 trillion
- United Kingdom: $4.57 trillion
- Italy: $3.74 trillion
- Spain: $2.83 trillion
- Poland: $2.04 trillion
- Netherlands: $1.52 trillion
- Switzerland: $927 billion
- Romania: $917 billion
- Belgium: $905 billion
- Turkey (European part): ~$839 billion
- Ireland: $812 billion
- Sweden: $797 billion
- Austria: $697 billion
- Ukraine: $690 billion
- Czechia: $658 billion
- Norway: $626 billion
- Portugal: $541 billion
- Denmark: $523 billion
- Greece: $466 billion
- Hungary: $462 billion
- Finland: $376 billion
Utah Vs European GDP Per Capita (PPP)
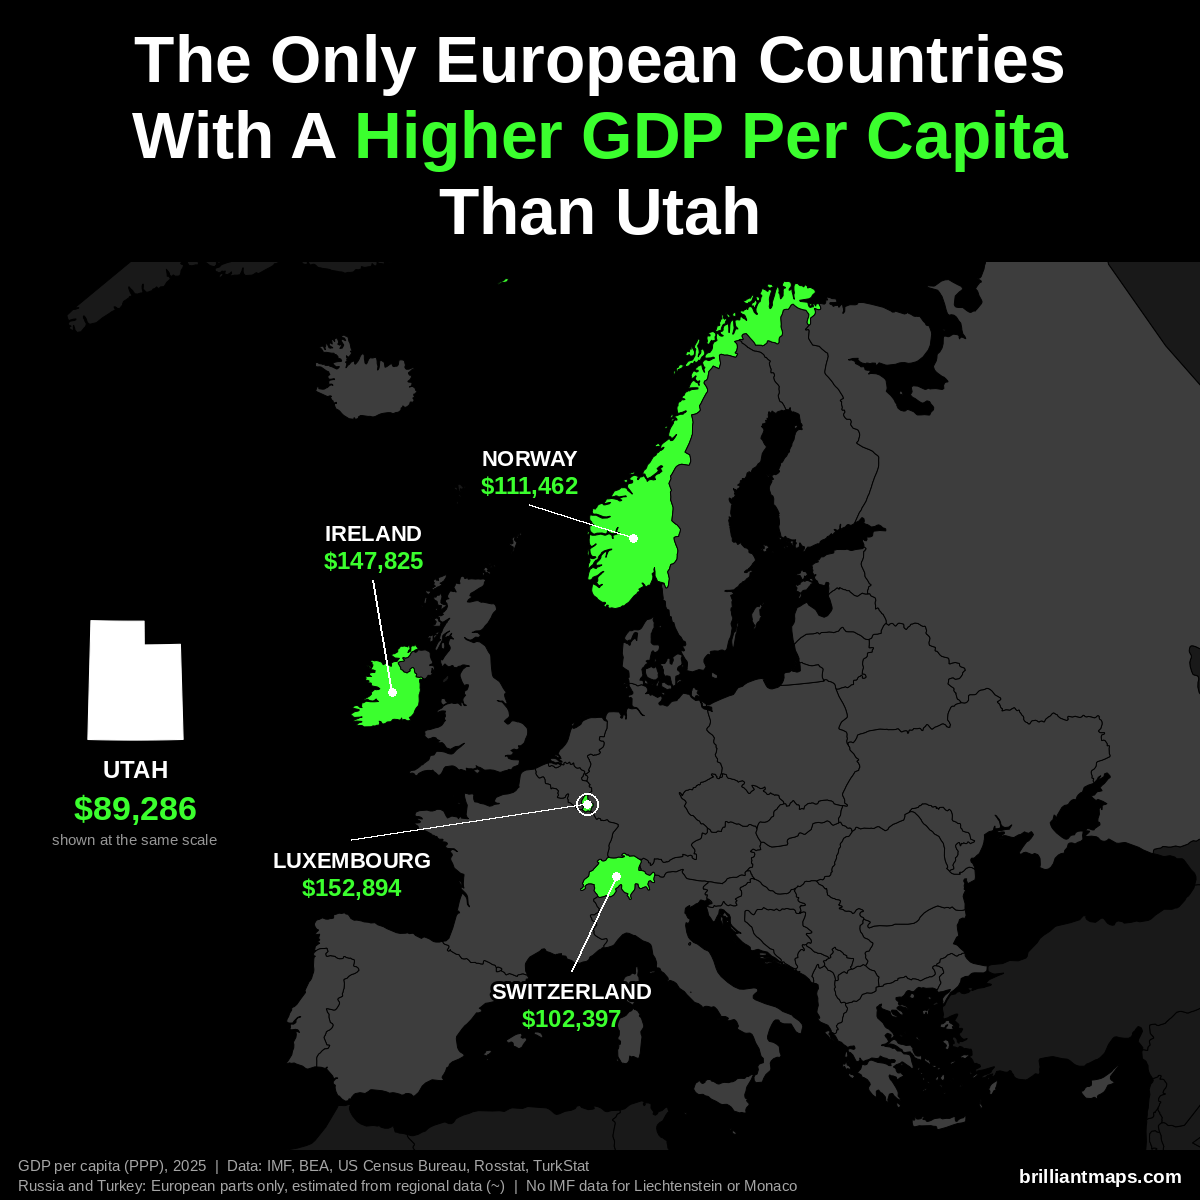
Utah has a GDP per capita of $89,286 (2025). Only 4 European countries have a higher GDP per capita at purchasing power parity:
- Luxembourg: $152,894
- Ireland: $147,825
- Norway: $111,462
- Switzerland: $102,397
Liechtenstein and Monaco are not covered by the IMF data and are not counted here.
Utah Vs European Size
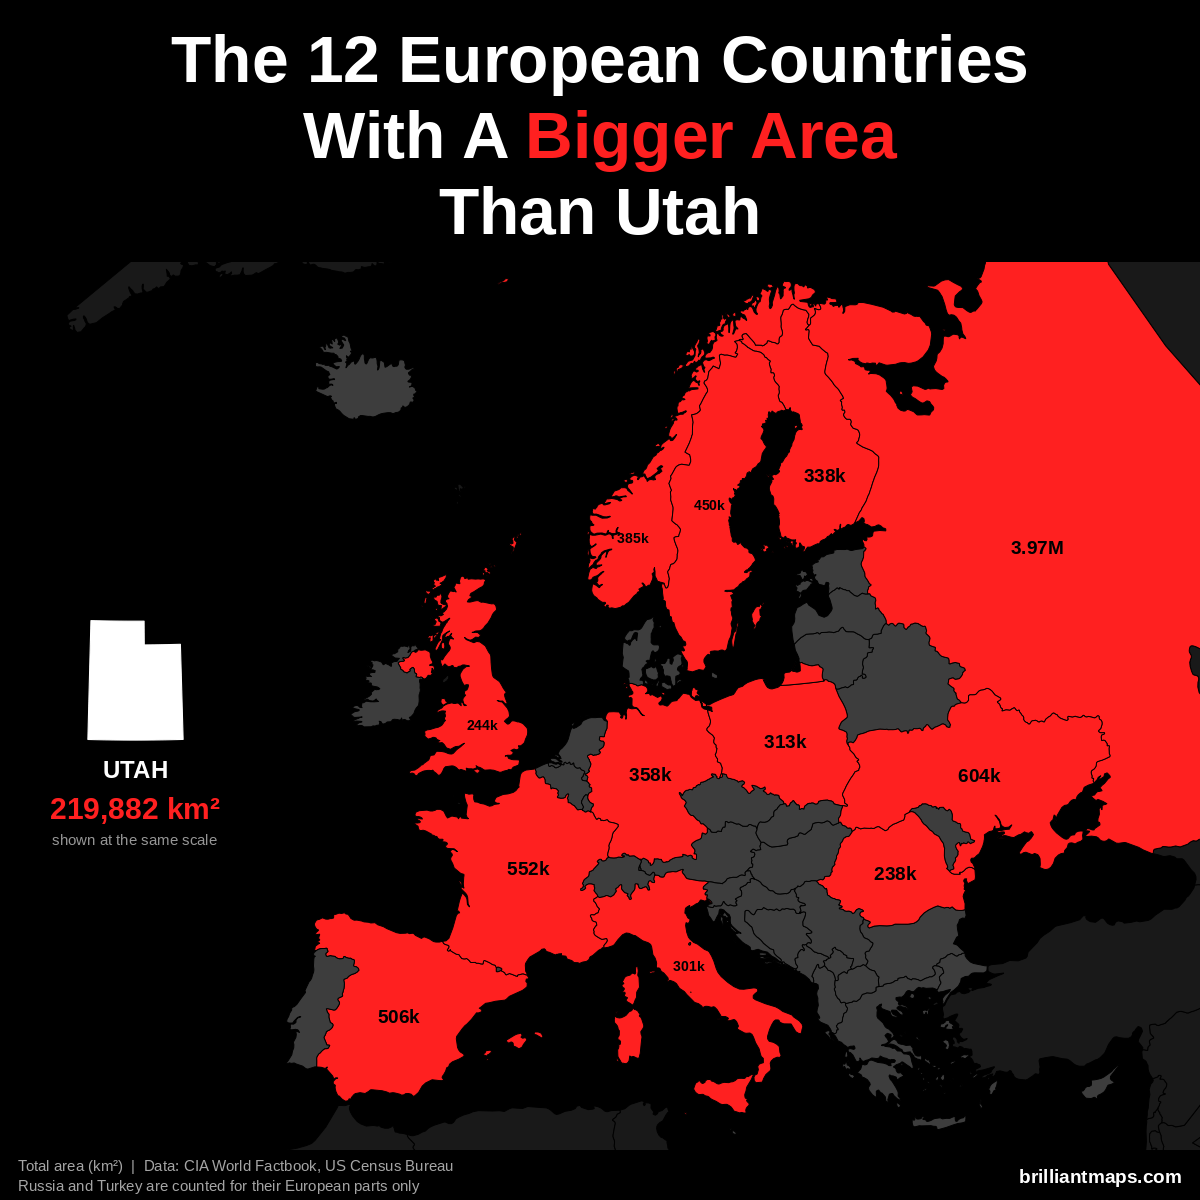
Utah has a total area of 219,882 km² (84,897 sq mi). 12 European countries have a bigger area:
- Russia (European part): 3,969,100 km² (1,532,477 sq mi)
- Ukraine: 603,550 km² (233,032 sq mi)
- France: 551,695 km² (213,010 sq mi)
- Spain: 505,990 km² (195,364 sq mi)
- Sweden: 450,295 km² (173,860 sq mi)
- Norway: 385,207 km² (148,729 sq mi)
- Germany: 357,588 km² (138,065 sq mi)
- Finland: 338,455 km² (130,678 sq mi)
- Poland: 312,696 km² (120,733 sq mi)
- Italy: 301,340 km² (116,348 sq mi)
- United Kingdom: 243,610 km² (94,058 sq mi)
- Romania: 238,397 km² (92,046 sq mi)
Utah Vs European Life Expectancy
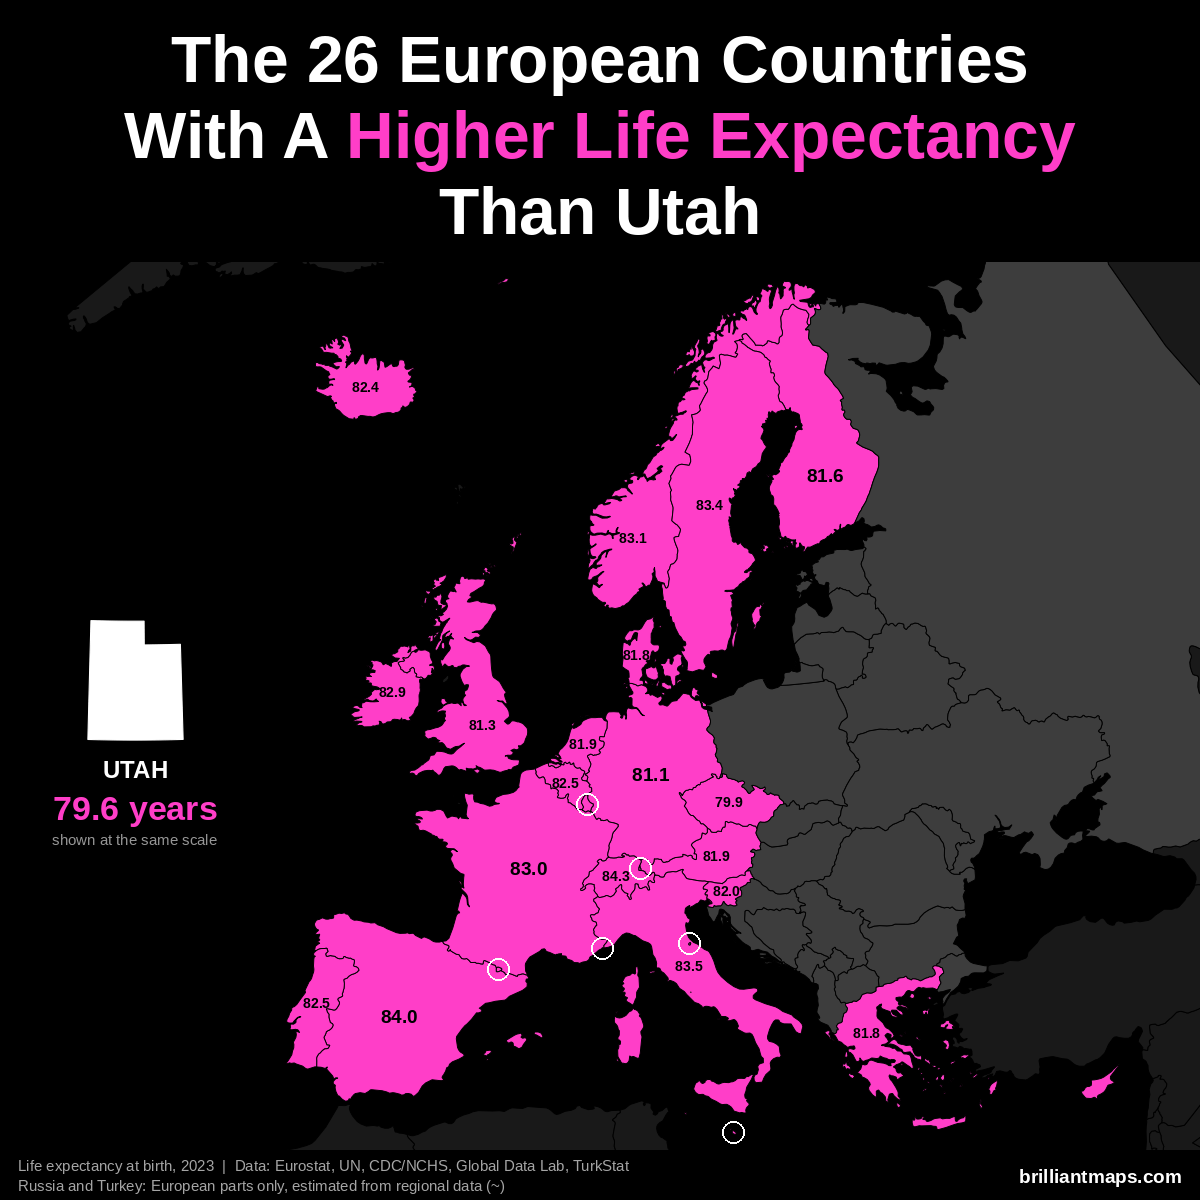
Utah has a life expectancy at birth of 79.6 years (2023). 26 European countries have a higher life expectancy:
- Monaco: 86.4 years
- San Marino: 85.7 years
- Liechtenstein: 84.6 years
- Switzerland: 84.3 years
- Andorra: 84.0 years
- Spain: 84.0 years
- Italy: 83.5 years
- Luxembourg: 83.4 years
- Malta: 83.4 years
- Sweden: 83.4 years
- Norway: 83.1 years
- France: 83.0 years
- Cyprus: 82.9 years
- Ireland: 82.9 years
- Belgium: 82.5 years
- Portugal: 82.5 years
- Iceland: 82.4 years
- Slovenia: 82.0 years
- Austria: 81.9 years
- Netherlands: 81.9 years
- Denmark: 81.8 years
- Greece: 81.8 years
- Finland: 81.6 years
- United Kingdom: 81.3 years
- Germany: 81.1 years
- Czechia: 79.9 years
Vermont vs Europe
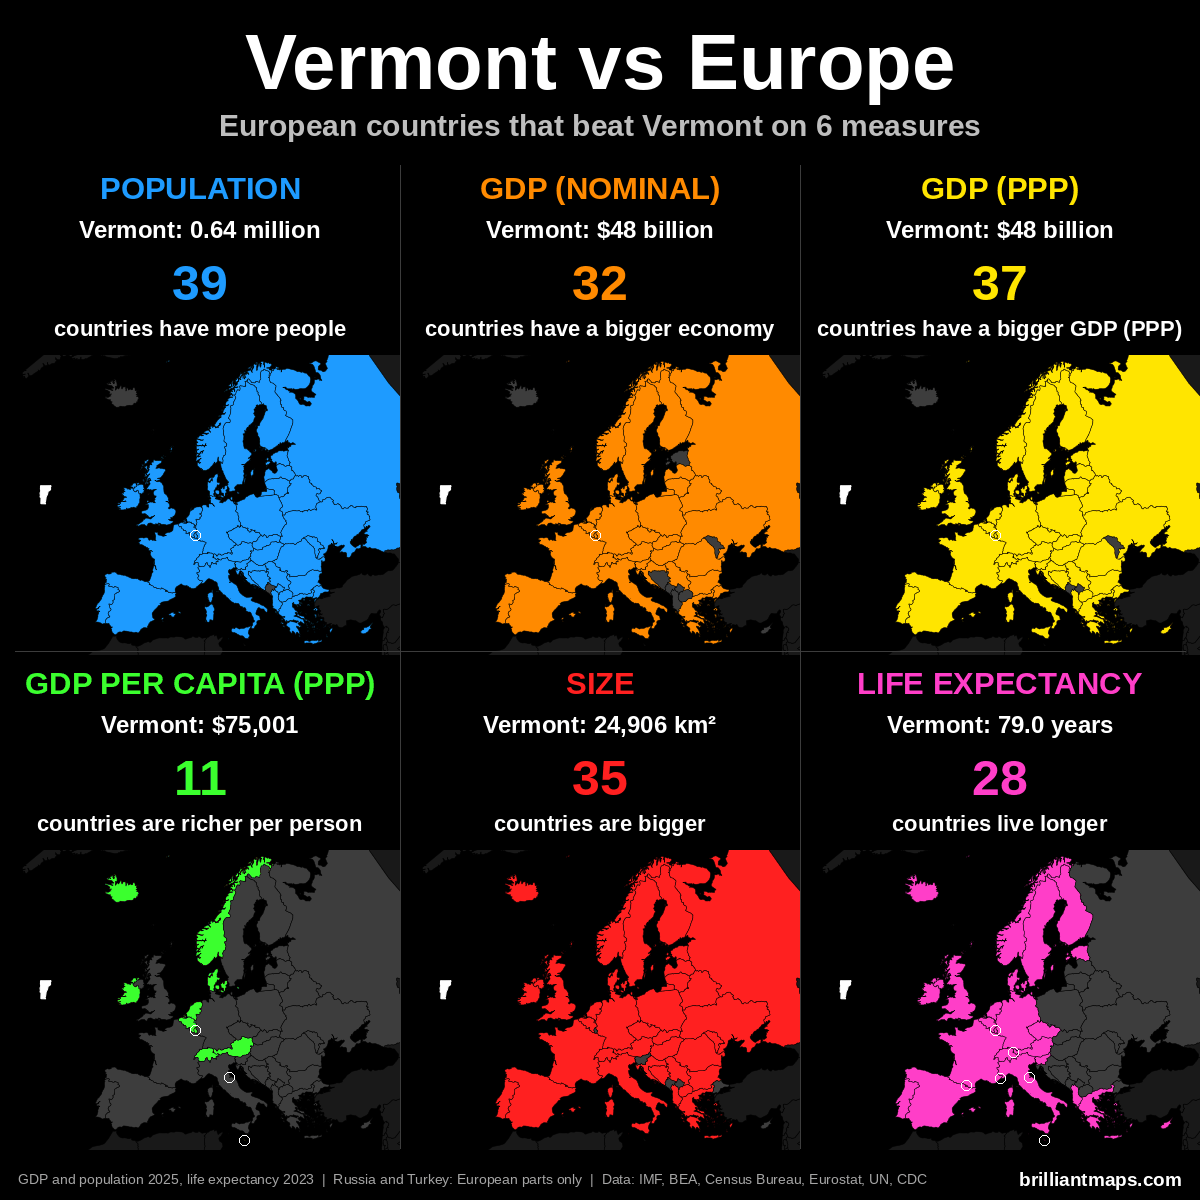
Vermont Vs European Population
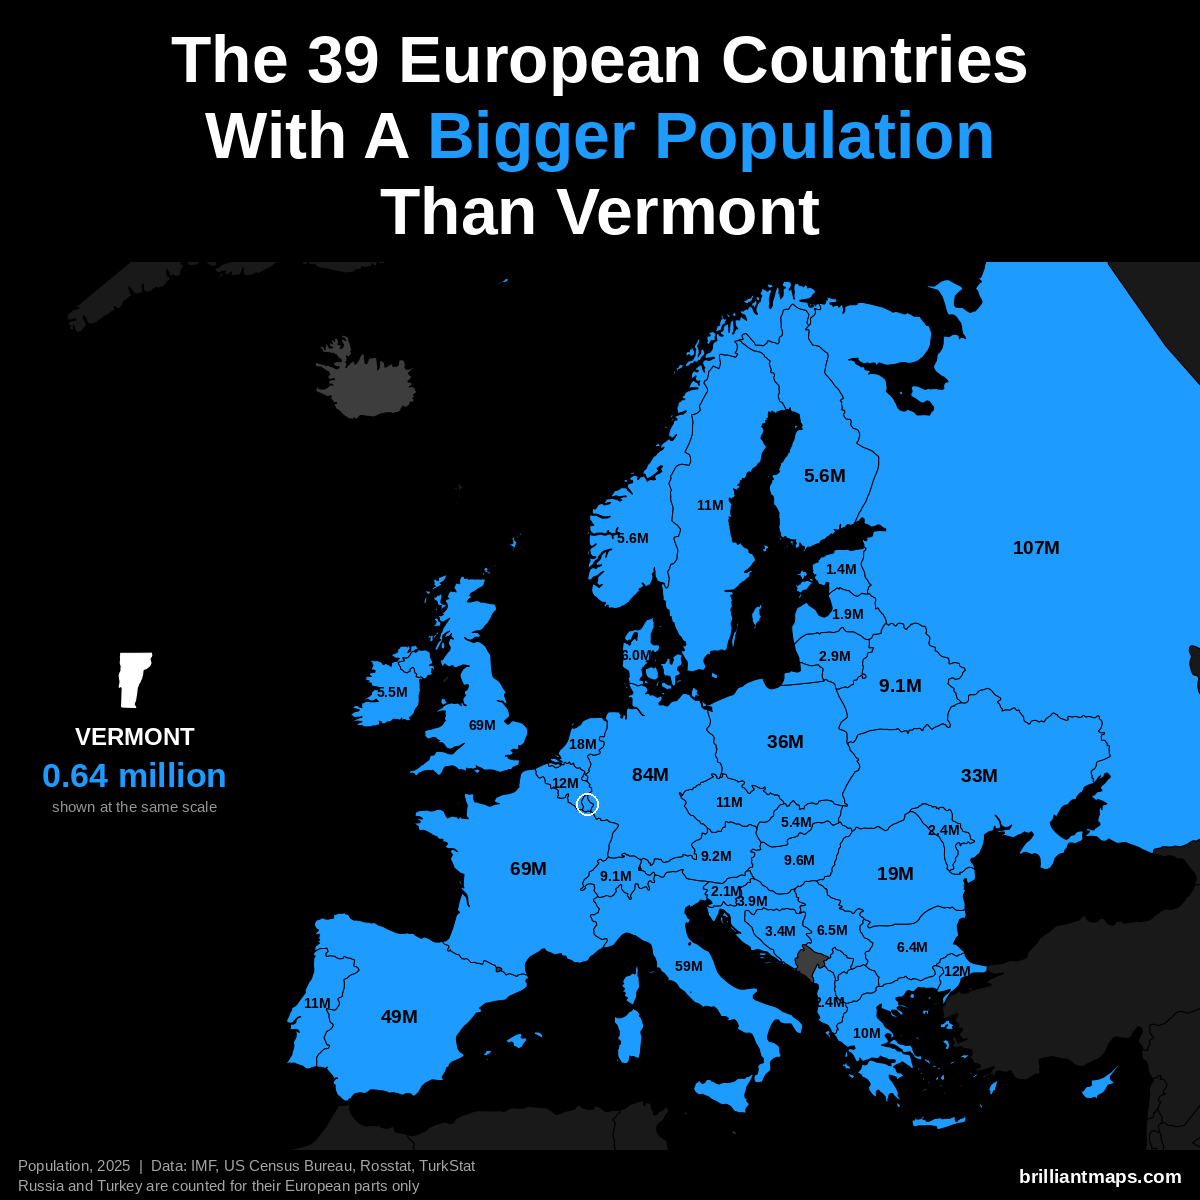
Vermont has a population of 644,663 (2025). 39 European countries have a bigger population:
- Russia (European part): 107.0 million
- Germany: 83.5 million
- United Kingdom: 69.5 million
- France: 68.9 million
- Italy: 58.9 million
- Spain: 49.5 million
- Poland: 36.5 million
- Ukraine: 32.9 million
- Romania: 19.0 million
- Netherlands: 18.0 million
- Turkey (European part): 12.2 million
- Belgium: 11.9 million
- Portugal: 10.8 million
- Czechia: 10.8 million
- Sweden: 10.7 million
- Greece: 10.4 million
- Hungary: 9.6 million
- Austria: 9.2 million
- Belarus: 9.1 million
- Switzerland: 9.1 million
- Serbia: 6.5 million
- Bulgaria: 6.4 million
- Denmark: 6.0 million
- Norway: 5.6 million
- Finland: 5.6 million
- Ireland: 5.5 million
- Slovakia: 5.4 million
- Croatia: 3.9 million
- Bosnia and Herzegovina: 3.4 million
- Lithuania: 2.9 million
- Moldova: 2.4 million
- Albania: 2.4 million
- Slovenia: 2.1 million
- Latvia: 1.9 million
- North Macedonia: 1.8 million
- Kosovo: 1.6 million
- Estonia: 1.4 million
- Cyprus: 983,000
- Luxembourg: 682,000
Vermont Vs European GDP (Nominal)
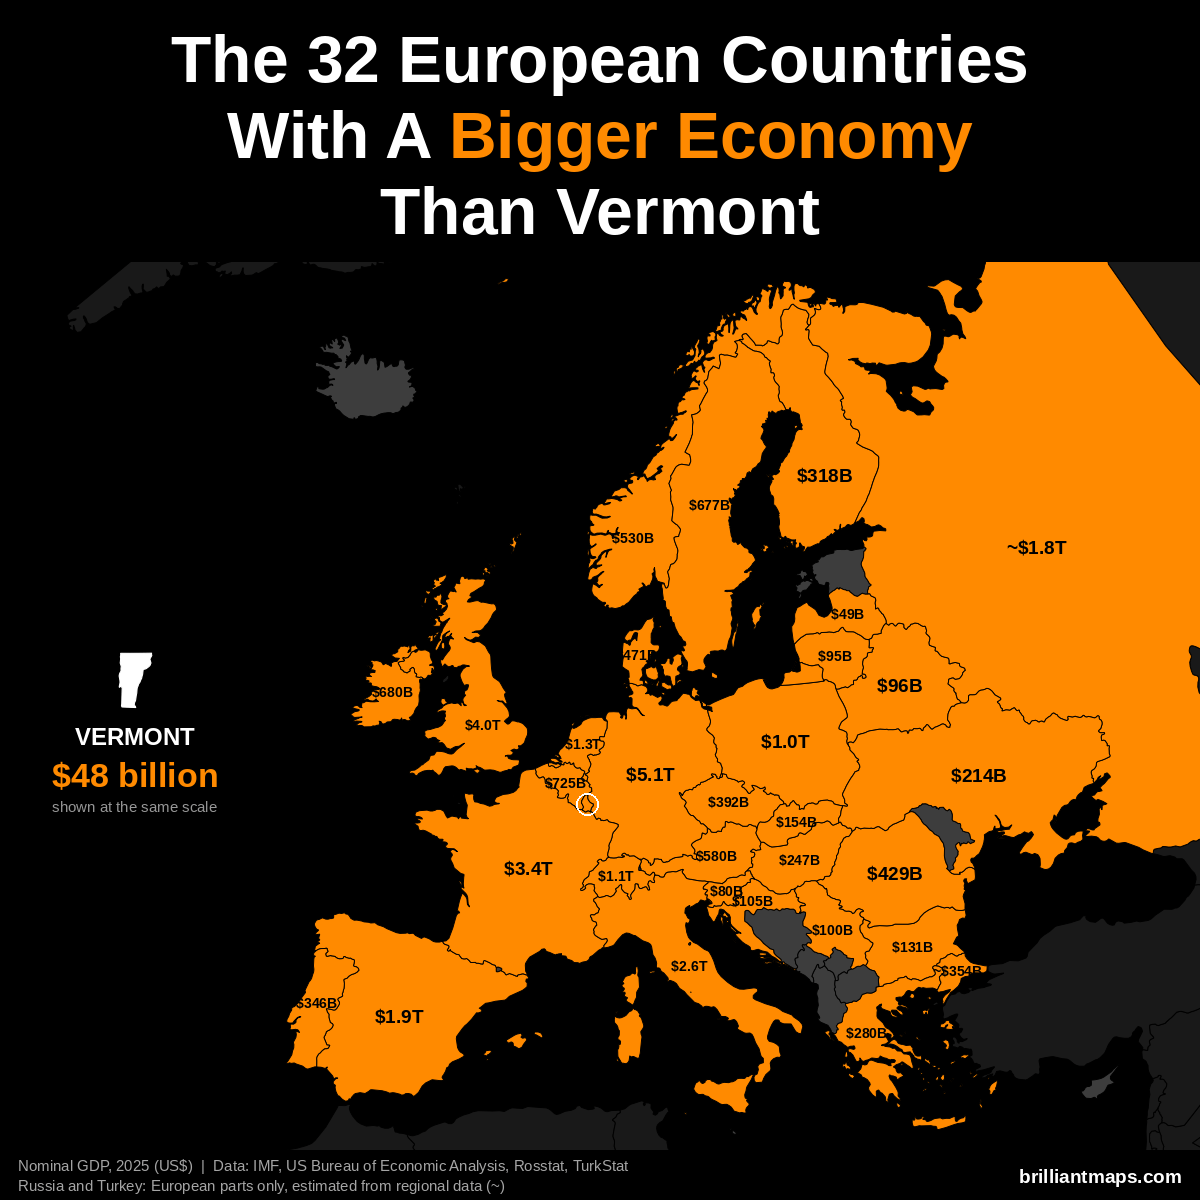
Vermont has a nominal GDP of $48 billion (2025). 32 European countries have a bigger economy:
- Germany: $5.12 trillion
- United Kingdom: $4.01 trillion
- France: $3.38 trillion
- Italy: $2.55 trillion
- Spain: $1.91 trillion
- Russia (European part): ~$1.83 trillion
- Netherlands: $1.32 trillion
- Switzerland: $1.06 trillion
- Poland: $1.04 trillion
- Belgium: $725 billion
- Ireland: $680 billion
- Sweden: $677 billion
- Austria: $580 billion
- Norway: $530 billion
- Denmark: $471 billion
- Romania: $429 billion
- Czechia: $392 billion
- Turkey (European part): ~$354 billion
- Portugal: $346 billion
- Finland: $318 billion
- Greece: $280 billion
- Hungary: $247 billion
- Ukraine: $214 billion
- Slovakia: $154 billion
- Bulgaria: $131 billion
- Croatia: $105 billion
- Luxembourg: $101 billion
- Serbia: $100 billion
- Belarus: $96 billion
- Lithuania: $95 billion
- Slovenia: $80 billion
- Latvia: $49 billion
Vermont Vs European GDP (PPP)
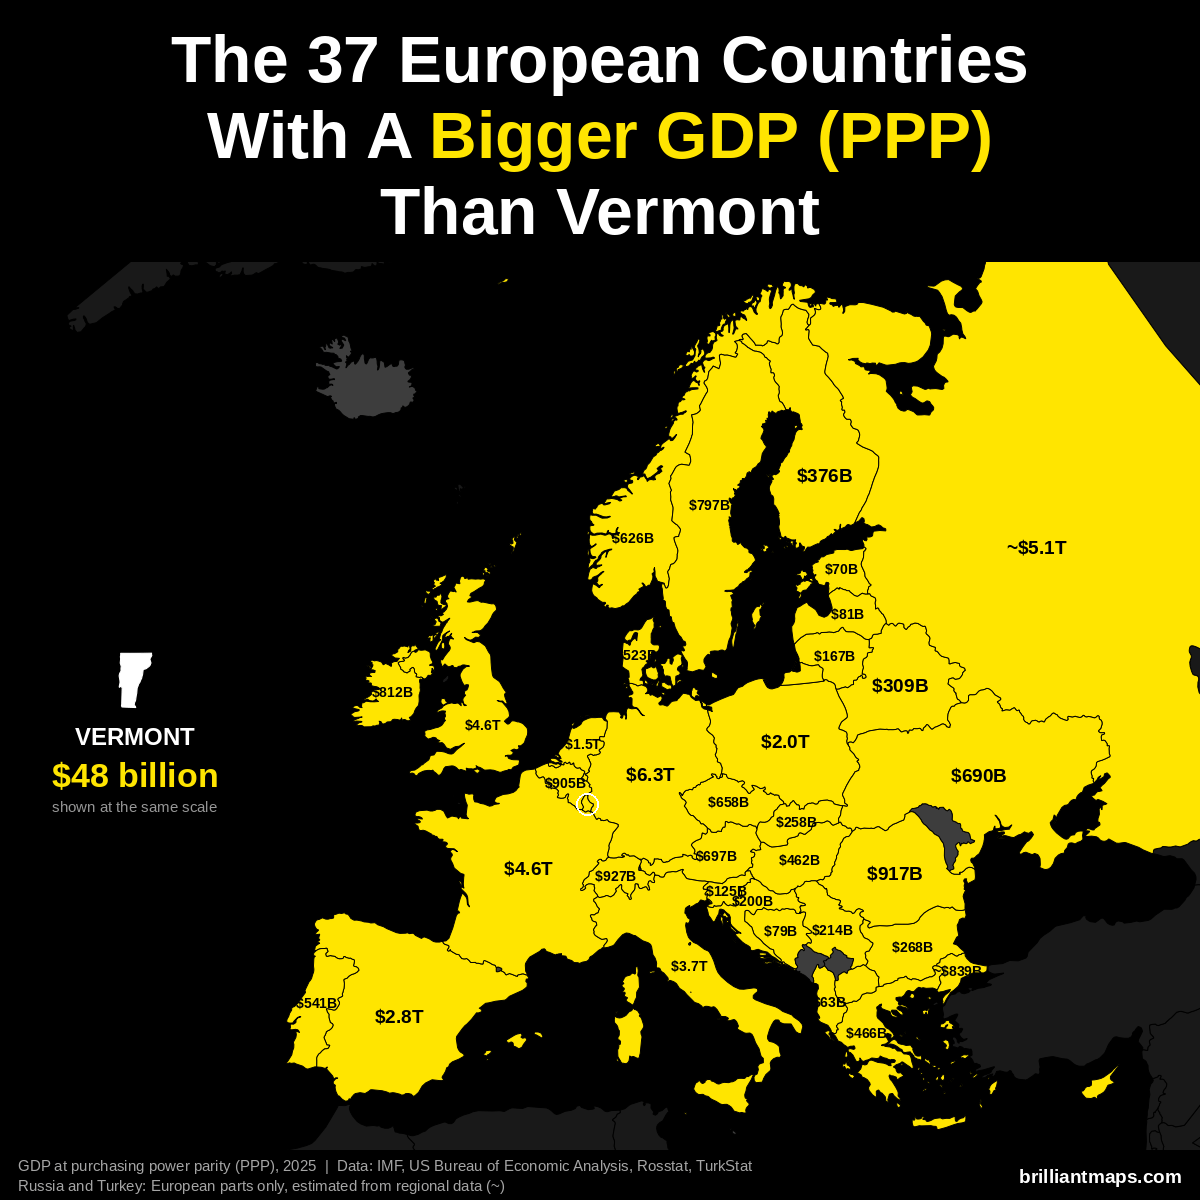
Vermont has a GDP of $48 billion (2025). US states are already measured in the dollars PPP is based on, so the figure is the same as nominal GDP. 37 European countries have a bigger GDP at purchasing power parity:
- Germany: $6.26 trillion
- Russia (European part): ~$5.14 trillion
- France: $4.58 trillion
- United Kingdom: $4.57 trillion
- Italy: $3.74 trillion
- Spain: $2.83 trillion
- Poland: $2.04 trillion
- Netherlands: $1.52 trillion
- Switzerland: $927 billion
- Romania: $917 billion
- Belgium: $905 billion
- Turkey (European part): ~$839 billion
- Ireland: $812 billion
- Sweden: $797 billion
- Austria: $697 billion
- Ukraine: $690 billion
- Czechia: $658 billion
- Norway: $626 billion
- Portugal: $541 billion
- Denmark: $523 billion
- Greece: $466 billion
- Hungary: $462 billion
- Finland: $376 billion
- Belarus: $309 billion
- Bulgaria: $268 billion
- Slovakia: $258 billion
- Serbia: $214 billion
- Croatia: $200 billion
- Lithuania: $167 billion
- Slovenia: $125 billion
- Luxembourg: $104 billion
- Latvia: $81 billion
- Bosnia and Herzegovina: $79 billion
- Estonia: $70 billion
- Cyprus: $64 billion
- Albania: $63 billion
- North Macedonia: $54 billion
Vermont Vs European GDP Per Capita (PPP)
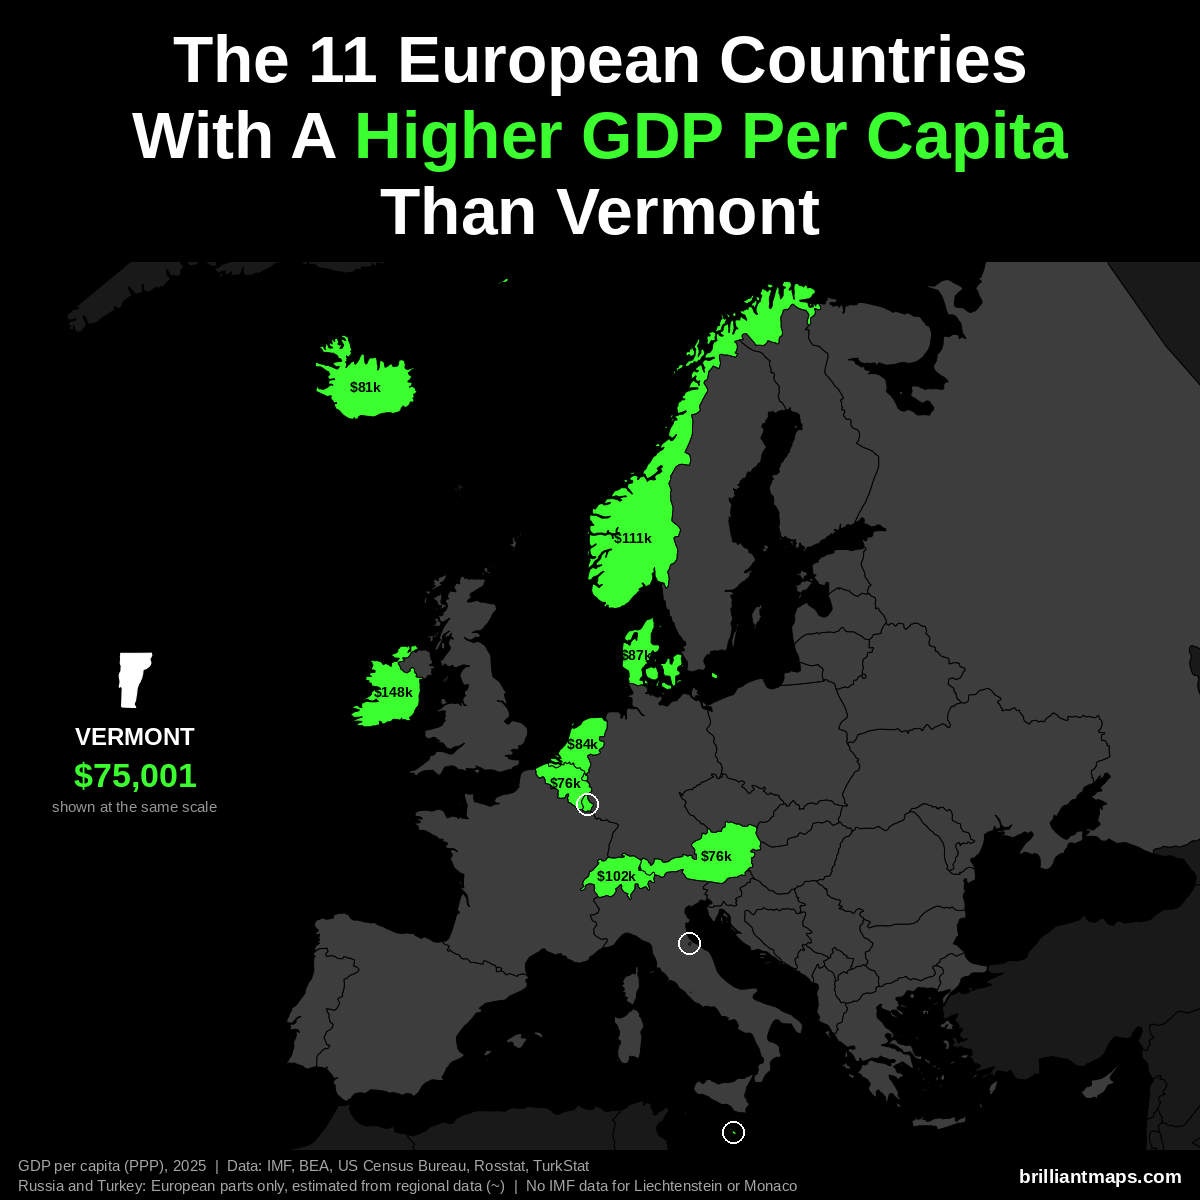
Vermont has a GDP per capita of $75,001 (2025). 11 European countries have a higher GDP per capita at purchasing power parity:
- Luxembourg: $152,894
- Ireland: $147,825
- Norway: $111,462
- Switzerland: $102,397
- Denmark: $87,303
- Netherlands: $84,445
- San Marino: $83,838
- Iceland: $80,915
- Belgium: $76,136
- Austria: $75,965
- Malta: $75,687
Liechtenstein and Monaco are not covered by the IMF data and are not counted here.
Vermont Vs European Size
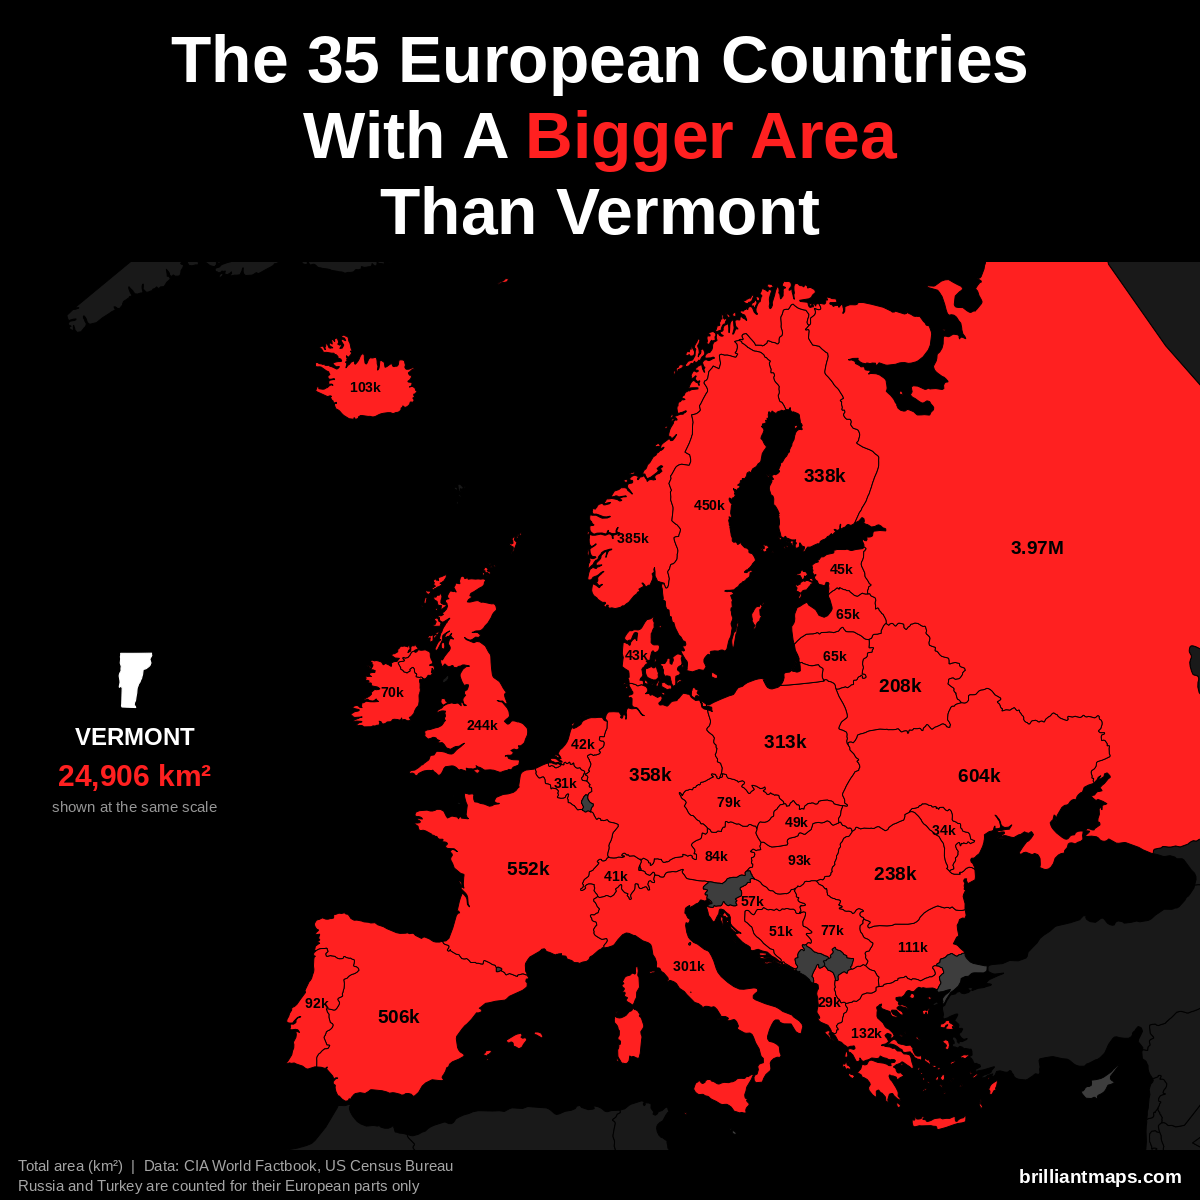
Vermont has a total area of 24,906 km² (9,616 sq mi). 35 European countries have a bigger area:
- Russia (European part): 3,969,100 km² (1,532,477 sq mi)
- Ukraine: 603,550 km² (233,032 sq mi)
- France: 551,695 km² (213,010 sq mi)
- Spain: 505,990 km² (195,364 sq mi)
- Sweden: 450,295 km² (173,860 sq mi)
- Norway: 385,207 km² (148,729 sq mi)
- Germany: 357,588 km² (138,065 sq mi)
- Finland: 338,455 km² (130,678 sq mi)
- Poland: 312,696 km² (120,733 sq mi)
- Italy: 301,340 km² (116,348 sq mi)
- United Kingdom: 243,610 km² (94,058 sq mi)
- Romania: 238,397 km² (92,046 sq mi)
- Belarus: 207,600 km² (80,155 sq mi)
- Greece: 131,957 km² (50,949 sq mi)
- Bulgaria: 110,994 km² (42,855 sq mi)
- Iceland: 103,000 km² (39,768 sq mi)
- Hungary: 93,028 km² (35,918 sq mi)
- Portugal: 92,212 km² (35,603 sq mi)
- Austria: 83,871 km² (32,383 sq mi)
- Czechia: 78,867 km² (30,451 sq mi)
- Serbia: 77,474 km² (29,913 sq mi)
- Ireland: 70,273 km² (27,133 sq mi)
- Lithuania: 65,300 km² (25,212 sq mi)
- Latvia: 64,589 km² (24,938 sq mi)
- Croatia: 56,594 km² (21,851 sq mi)
- Bosnia and Herzegovina: 51,197 km² (19,767 sq mi)
- Slovakia: 49,035 km² (18,933 sq mi)
- Estonia: 45,339 km² (17,505 sq mi)
- Denmark: 43,094 km² (16,639 sq mi)
- Netherlands: 41,850 km² (16,158 sq mi)
- Switzerland: 41,285 km² (15,940 sq mi)
- Moldova: 33,846 km² (13,068 sq mi)
- Belgium: 30,528 km² (11,787 sq mi)
- Albania: 28,748 km² (11,100 sq mi)
- North Macedonia: 25,713 km² (9,928 sq mi)
Vermont Vs European Life Expectancy
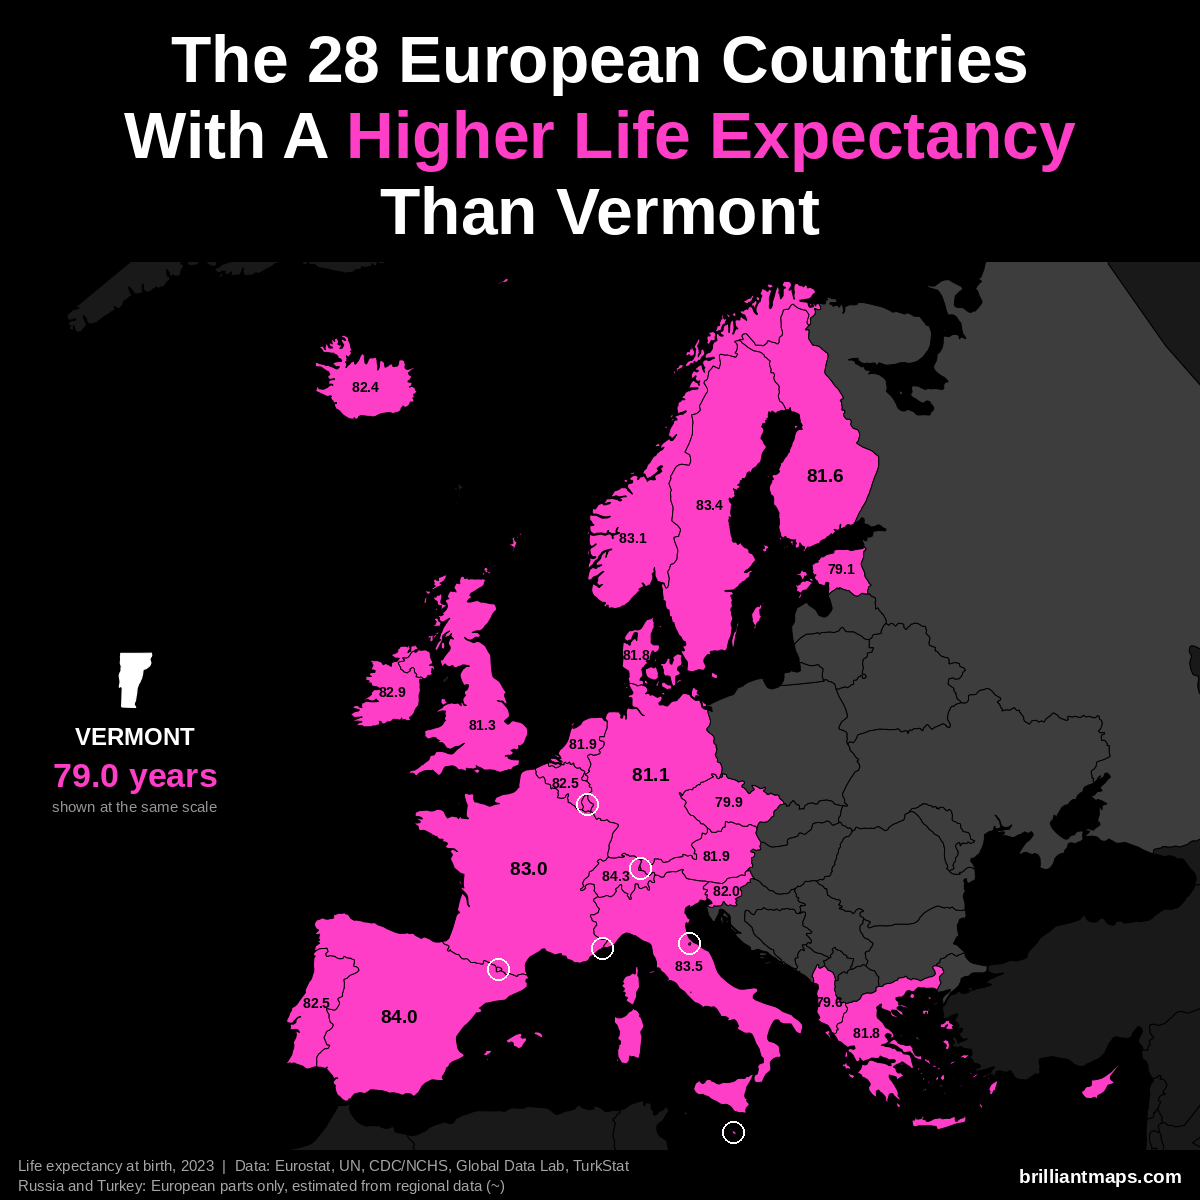
Vermont has a life expectancy at birth of 79.0 years (2023). 28 European countries have a higher life expectancy:
- Monaco: 86.4 years
- San Marino: 85.7 years
- Liechtenstein: 84.6 years
- Switzerland: 84.3 years
- Andorra: 84.0 years
- Spain: 84.0 years
- Italy: 83.5 years
- Luxembourg: 83.4 years
- Malta: 83.4 years
- Sweden: 83.4 years
- Norway: 83.1 years
- France: 83.0 years
- Cyprus: 82.9 years
- Ireland: 82.9 years
- Belgium: 82.5 years
- Portugal: 82.5 years
- Iceland: 82.4 years
- Slovenia: 82.0 years
- Austria: 81.9 years
- Netherlands: 81.9 years
- Denmark: 81.8 years
- Greece: 81.8 years
- Finland: 81.6 years
- United Kingdom: 81.3 years
- Germany: 81.1 years
- Czechia: 79.9 years
- Albania: 79.6 years
- Estonia: 79.1 years
Virginia vs Europe
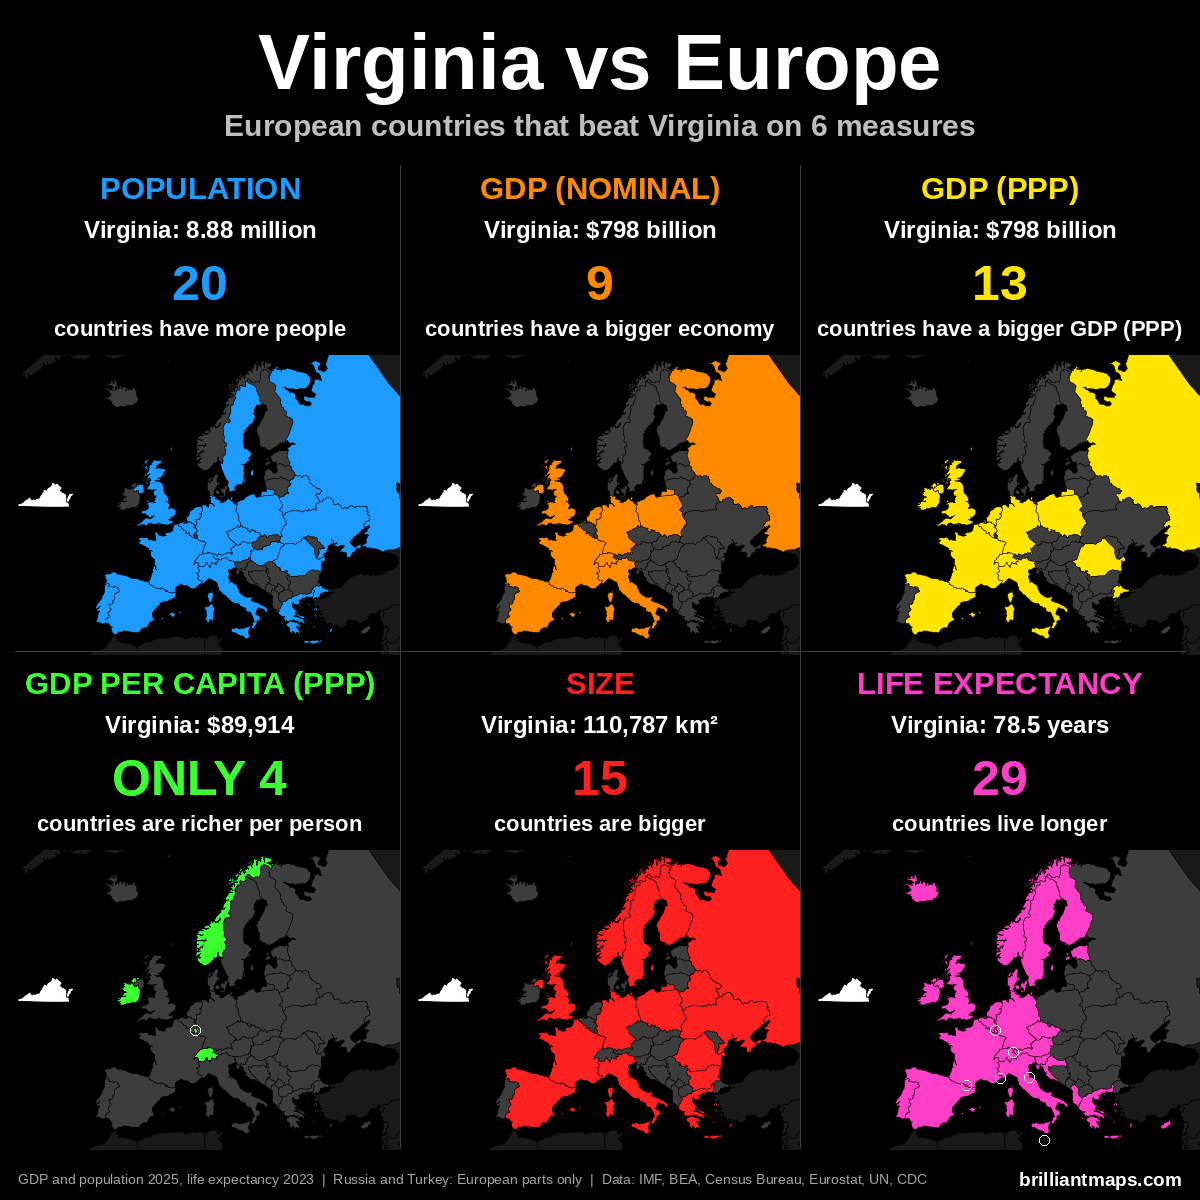
Virginia Vs European Population
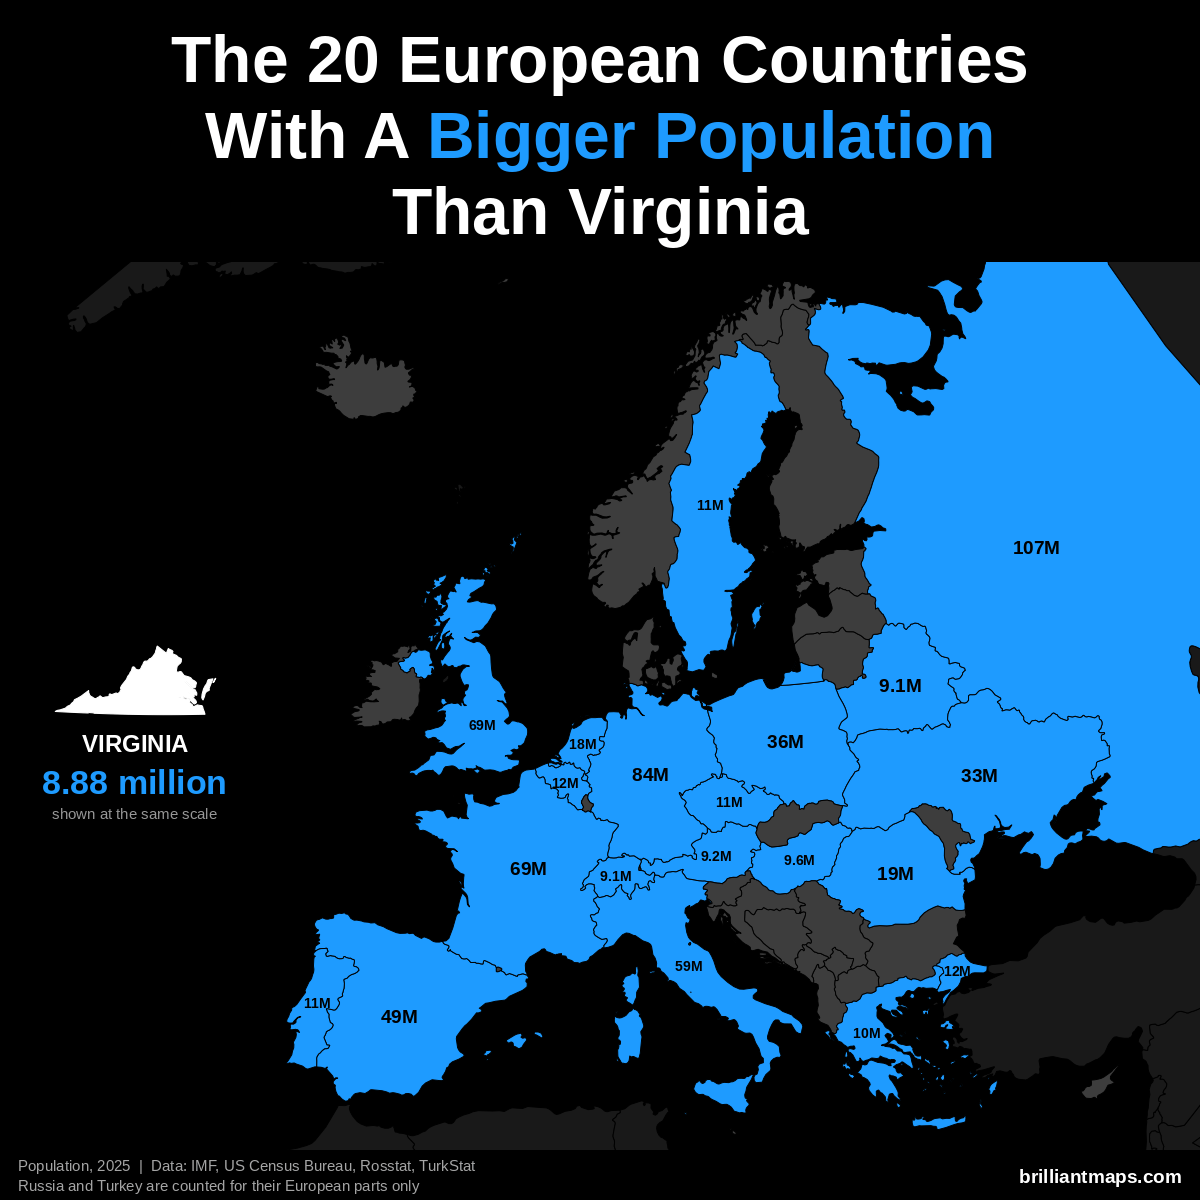
Virginia has a population of 8.9 million (2025). 20 European countries have a bigger population:
- Russia (European part): 107.0 million
- Germany: 83.5 million
- United Kingdom: 69.5 million
- France: 68.9 million
- Italy: 58.9 million
- Spain: 49.5 million
- Poland: 36.5 million
- Ukraine: 32.9 million
- Romania: 19.0 million
- Netherlands: 18.0 million
- Turkey (European part): 12.2 million
- Belgium: 11.9 million
- Portugal: 10.8 million
- Czechia: 10.8 million
- Sweden: 10.7 million
- Greece: 10.4 million
- Hungary: 9.6 million
- Austria: 9.2 million
- Belarus: 9.1 million
- Switzerland: 9.1 million
Virginia Vs European GDP (Nominal)
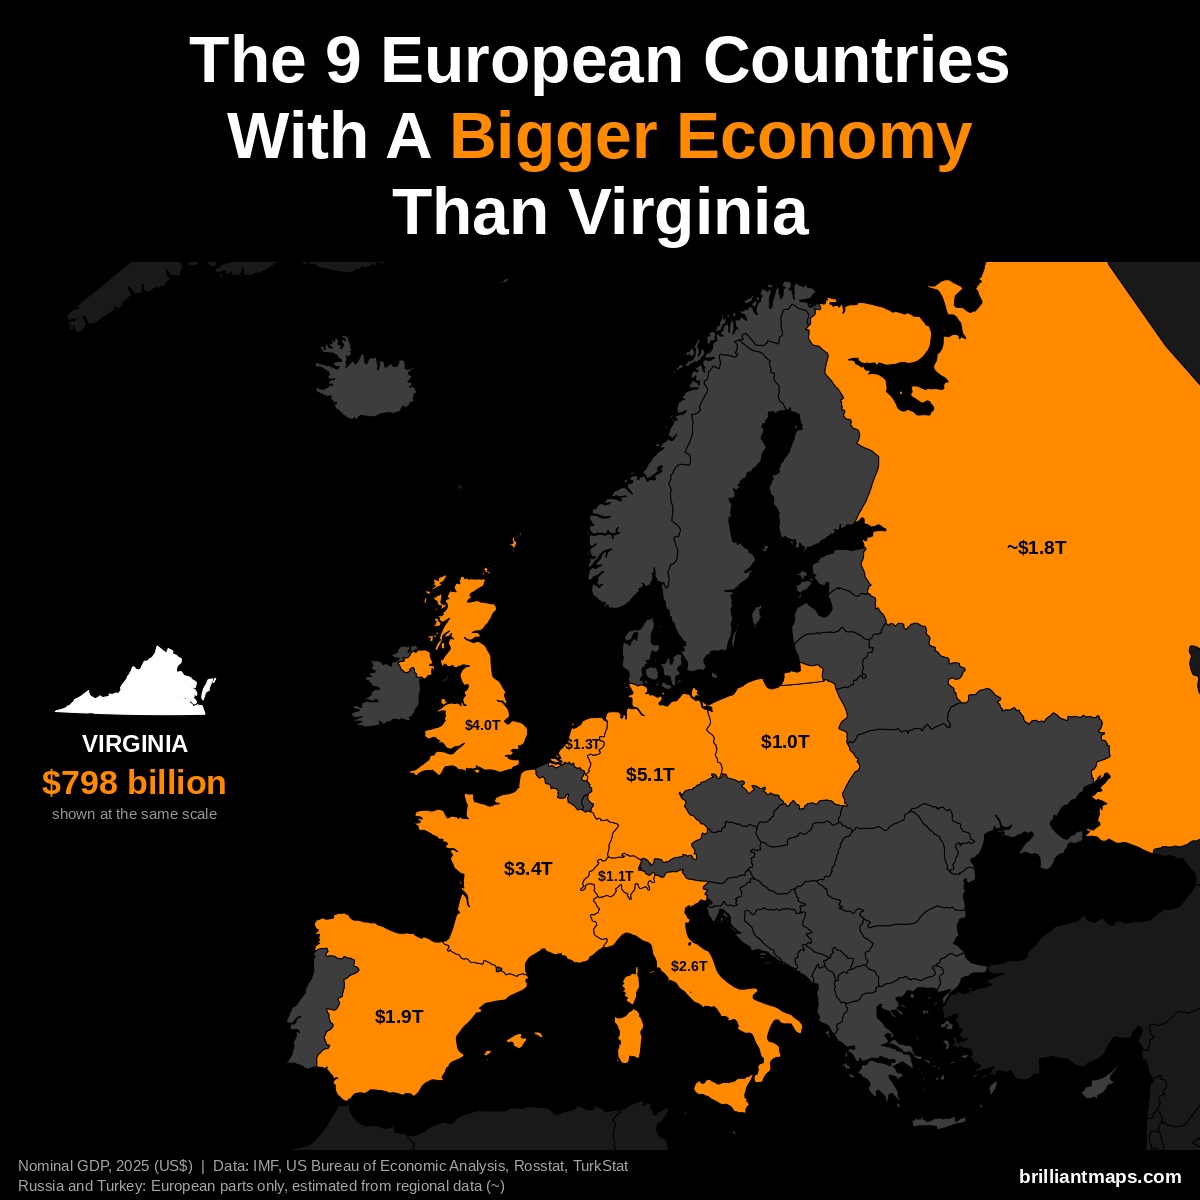
Virginia has a nominal GDP of $798 billion (2025). 9 European countries have a bigger economy:
- Germany: $5.12 trillion
- United Kingdom: $4.01 trillion
- France: $3.38 trillion
- Italy: $2.55 trillion
- Spain: $1.91 trillion
- Russia (European part): ~$1.83 trillion
- Netherlands: $1.32 trillion
- Switzerland: $1.06 trillion
- Poland: $1.04 trillion
Virginia Vs European GDP (PPP)
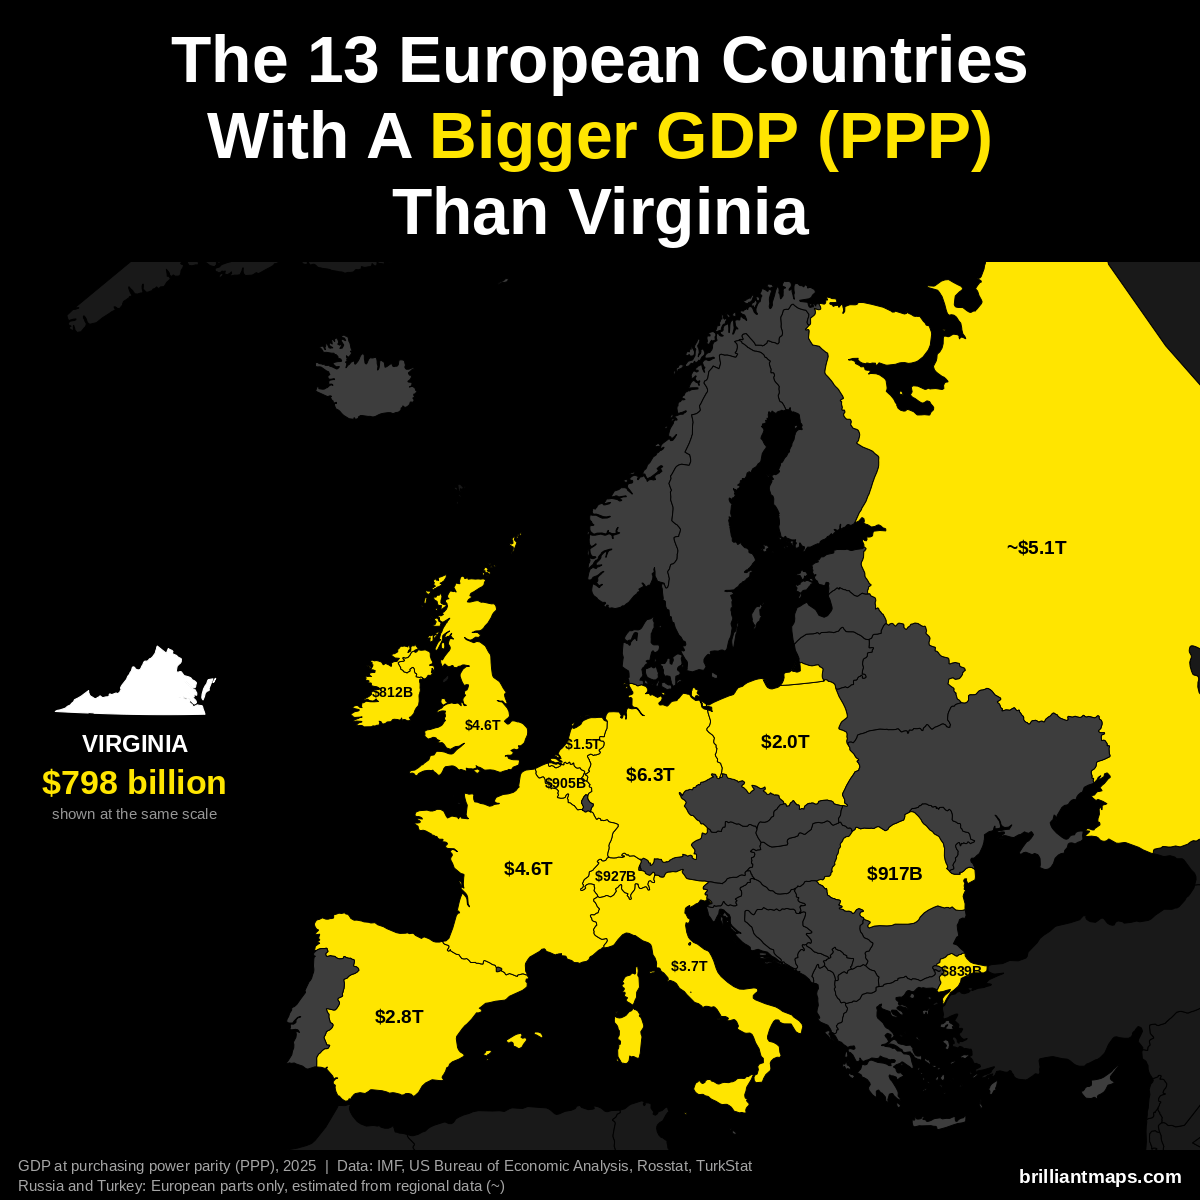
Virginia has a GDP of $798 billion (2025). US states are already measured in the dollars PPP is based on, so the figure is the same as nominal GDP. 13 European countries have a bigger GDP at purchasing power parity:
- Germany: $6.26 trillion
- Russia (European part): ~$5.14 trillion
- France: $4.58 trillion
- United Kingdom: $4.57 trillion
- Italy: $3.74 trillion
- Spain: $2.83 trillion
- Poland: $2.04 trillion
- Netherlands: $1.52 trillion
- Switzerland: $927 billion
- Romania: $917 billion
- Belgium: $905 billion
- Turkey (European part): ~$839 billion
- Ireland: $812 billion
Virginia Vs European GDP Per Capita (PPP)
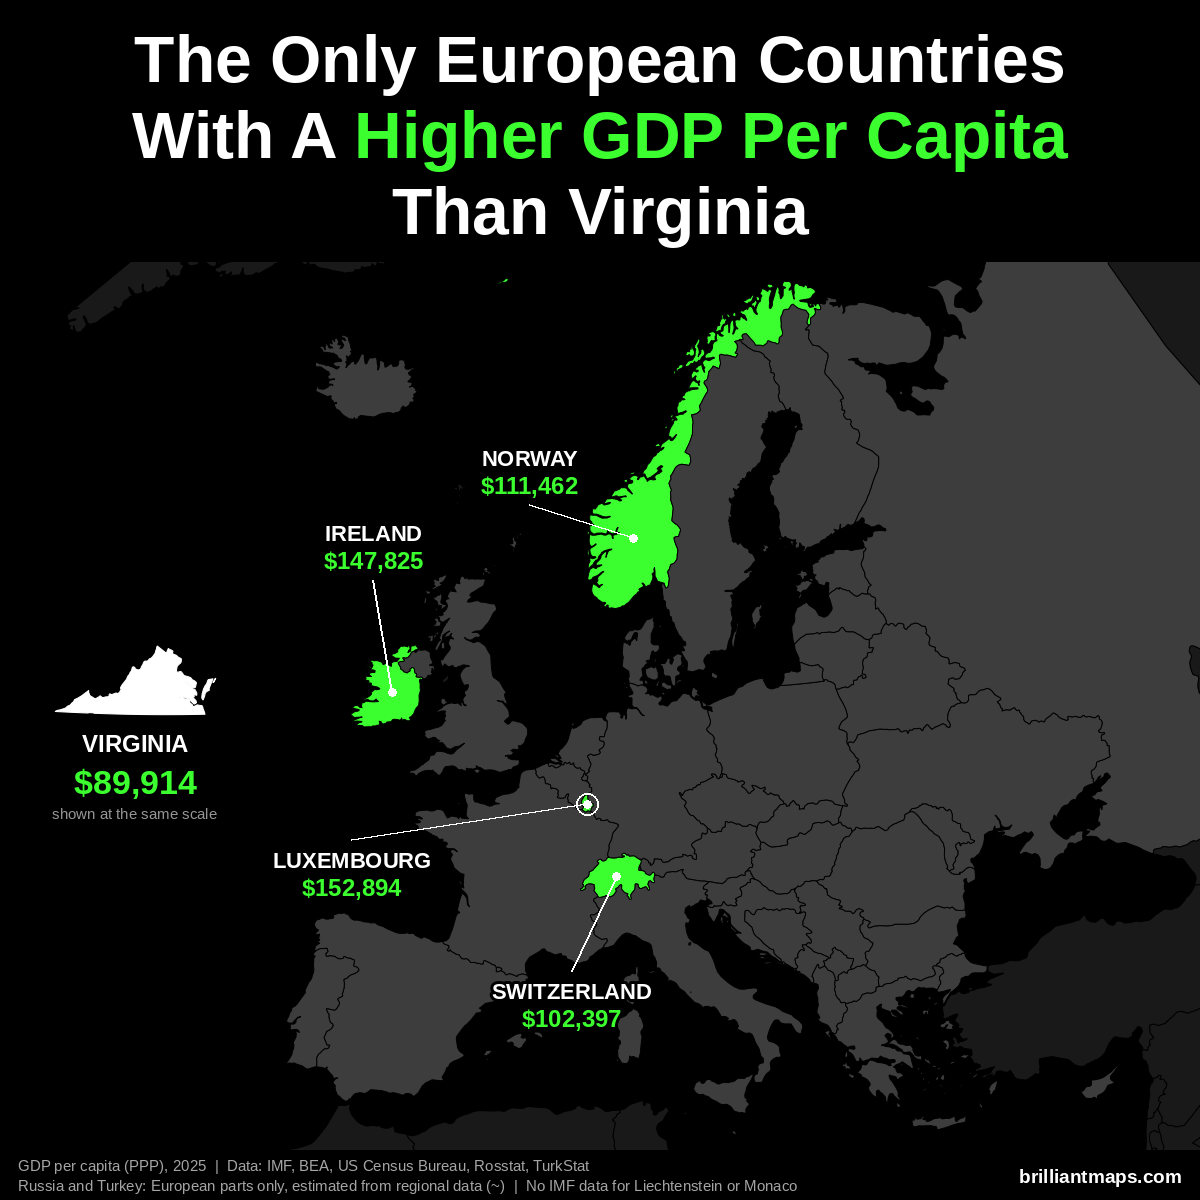
Virginia has a GDP per capita of $89,914 (2025). Only 4 European countries have a higher GDP per capita at purchasing power parity:
- Luxembourg: $152,894
- Ireland: $147,825
- Norway: $111,462
- Switzerland: $102,397
Liechtenstein and Monaco are not covered by the IMF data and are not counted here.
Virginia Vs European Size
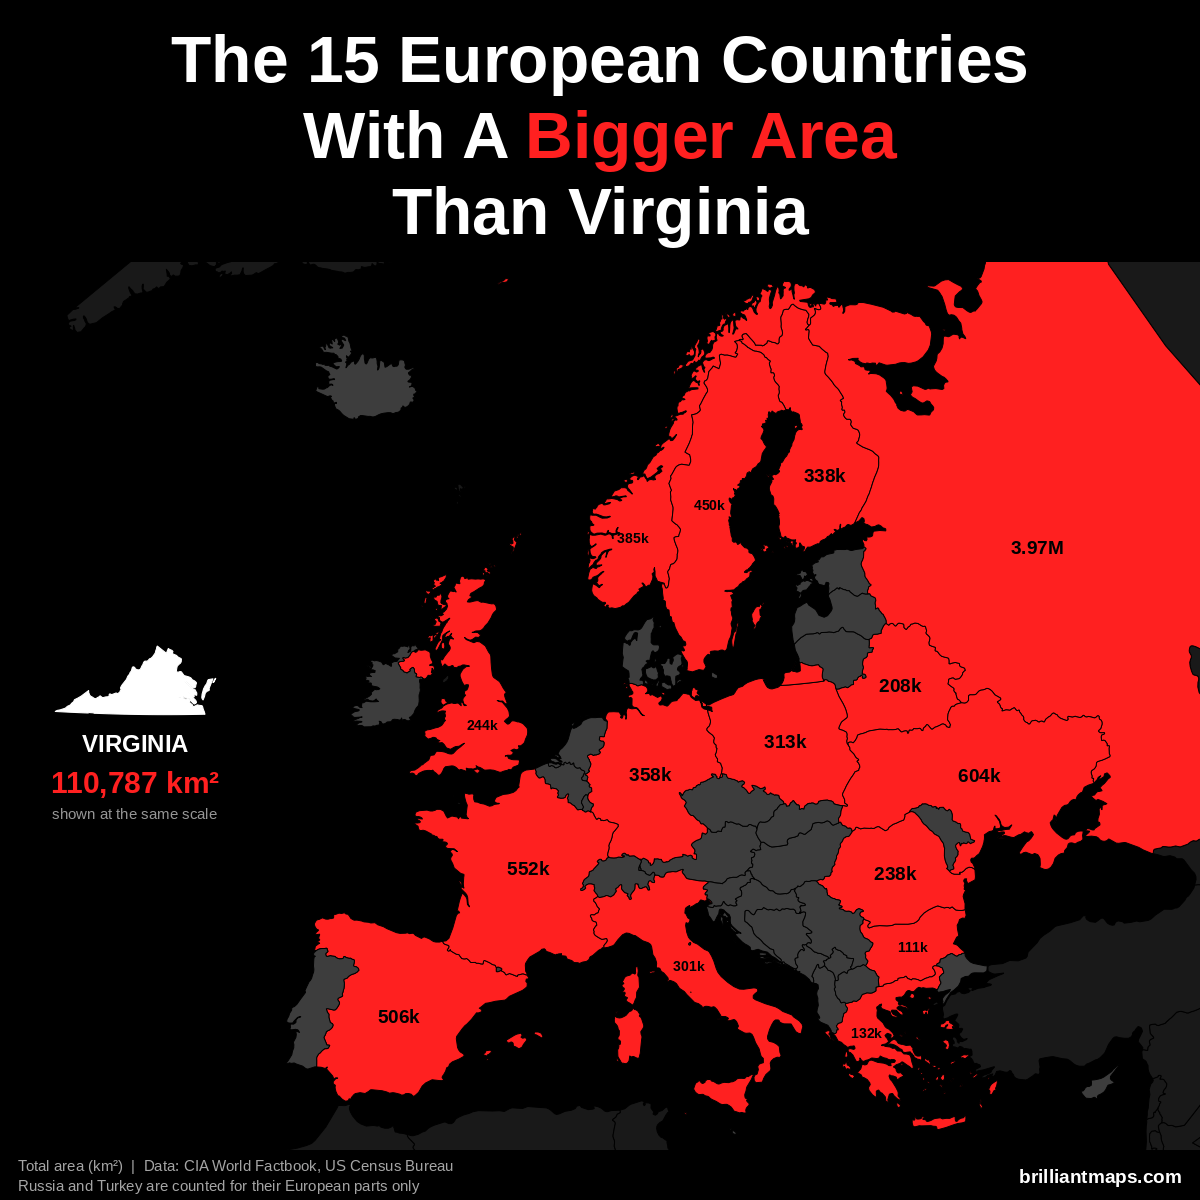
Virginia has a total area of 110,787 km² (42,775 sq mi). 15 European countries have a bigger area:
- Russia (European part): 3,969,100 km² (1,532,477 sq mi)
- Ukraine: 603,550 km² (233,032 sq mi)
- France: 551,695 km² (213,010 sq mi)
- Spain: 505,990 km² (195,364 sq mi)
- Sweden: 450,295 km² (173,860 sq mi)
- Norway: 385,207 km² (148,729 sq mi)
- Germany: 357,588 km² (138,065 sq mi)
- Finland: 338,455 km² (130,678 sq mi)
- Poland: 312,696 km² (120,733 sq mi)
- Italy: 301,340 km² (116,348 sq mi)
- United Kingdom: 243,610 km² (94,058 sq mi)
- Romania: 238,397 km² (92,046 sq mi)
- Belarus: 207,600 km² (80,155 sq mi)
- Greece: 131,957 km² (50,949 sq mi)
- Bulgaria: 110,994 km² (42,855 sq mi)
Virginia Vs European Life Expectancy
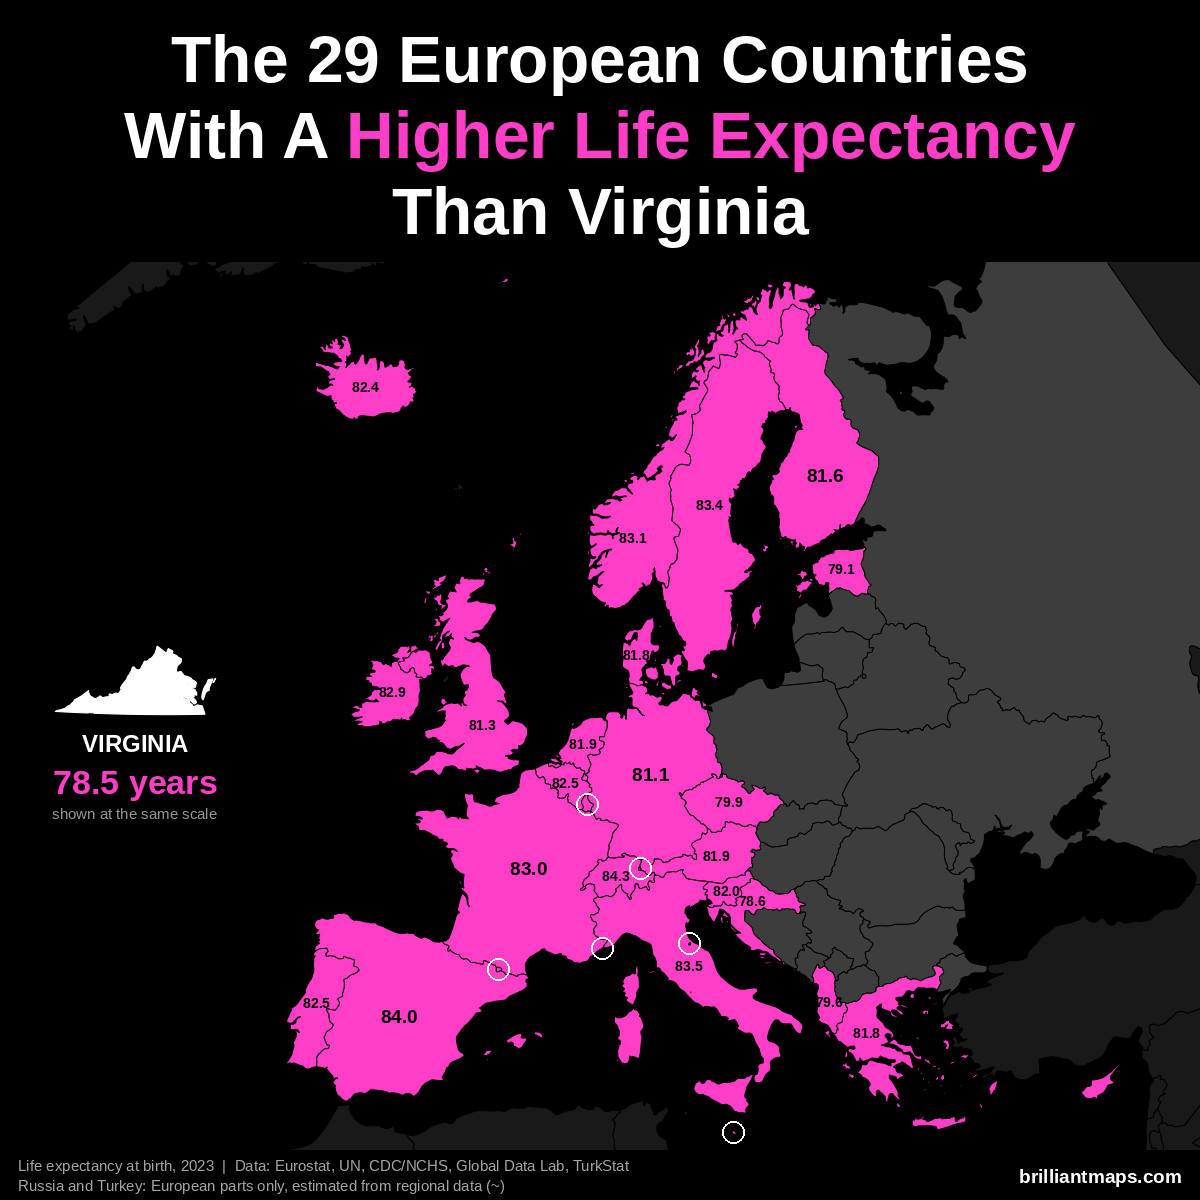
Virginia has a life expectancy at birth of 78.5 years (2023). 29 European countries have a higher life expectancy:
- Monaco: 86.4 years
- San Marino: 85.7 years
- Liechtenstein: 84.6 years
- Switzerland: 84.3 years
- Andorra: 84.0 years
- Spain: 84.0 years
- Italy: 83.5 years
- Luxembourg: 83.4 years
- Malta: 83.4 years
- Sweden: 83.4 years
- Norway: 83.1 years
- France: 83.0 years
- Cyprus: 82.9 years
- Ireland: 82.9 years
- Belgium: 82.5 years
- Portugal: 82.5 years
- Iceland: 82.4 years
- Slovenia: 82.0 years
- Austria: 81.9 years
- Netherlands: 81.9 years
- Denmark: 81.8 years
- Greece: 81.8 years
- Finland: 81.6 years
- United Kingdom: 81.3 years
- Germany: 81.1 years
- Czechia: 79.9 years
- Albania: 79.6 years
- Estonia: 79.1 years
- Croatia: 78.6 years
Washington vs Europe
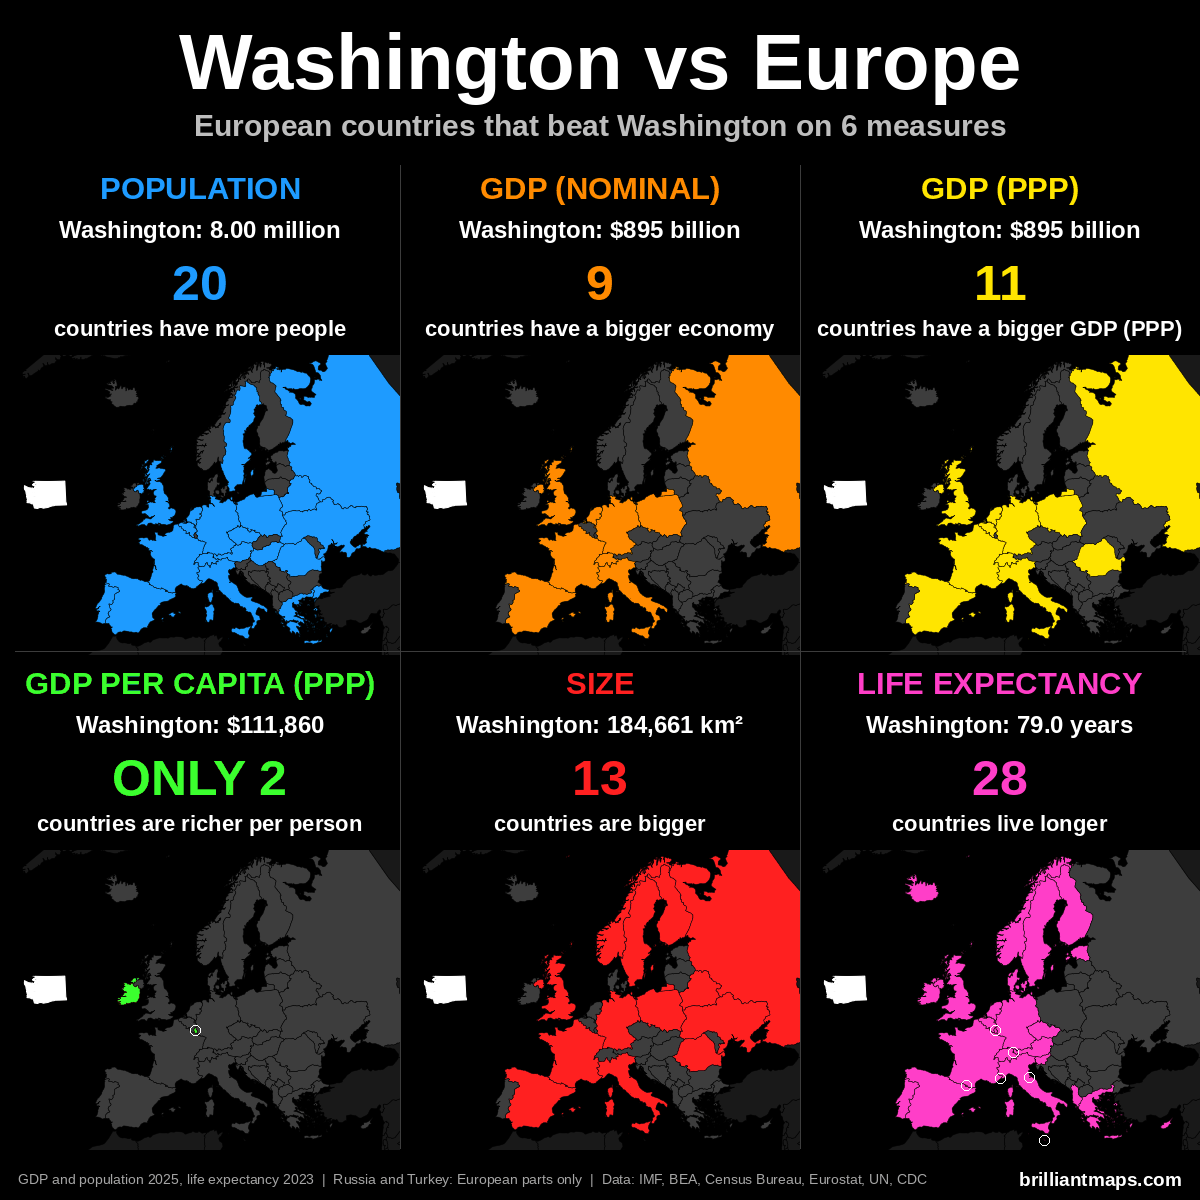
Washington Vs European Population
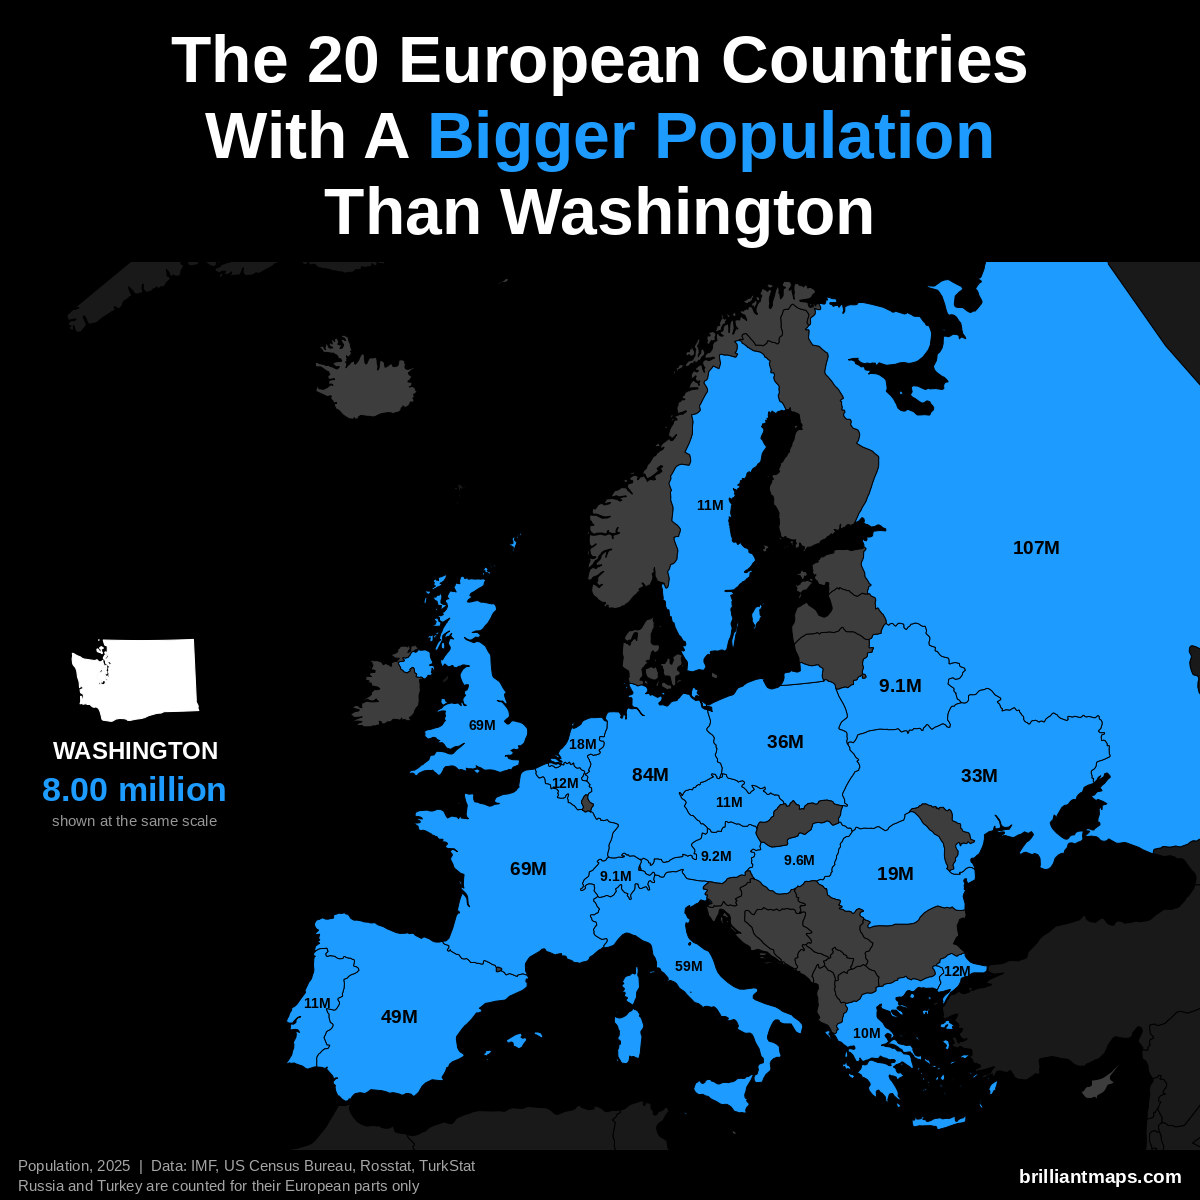
Washington has a population of 8.0 million (2025). 20 European countries have a bigger population:
- Russia (European part): 107.0 million
- Germany: 83.5 million
- United Kingdom: 69.5 million
- France: 68.9 million
- Italy: 58.9 million
- Spain: 49.5 million
- Poland: 36.5 million
- Ukraine: 32.9 million
- Romania: 19.0 million
- Netherlands: 18.0 million
- Turkey (European part): 12.2 million
- Belgium: 11.9 million
- Portugal: 10.8 million
- Czechia: 10.8 million
- Sweden: 10.7 million
- Greece: 10.4 million
- Hungary: 9.6 million
- Austria: 9.2 million
- Belarus: 9.1 million
- Switzerland: 9.1 million
Washington Vs European GDP (Nominal)
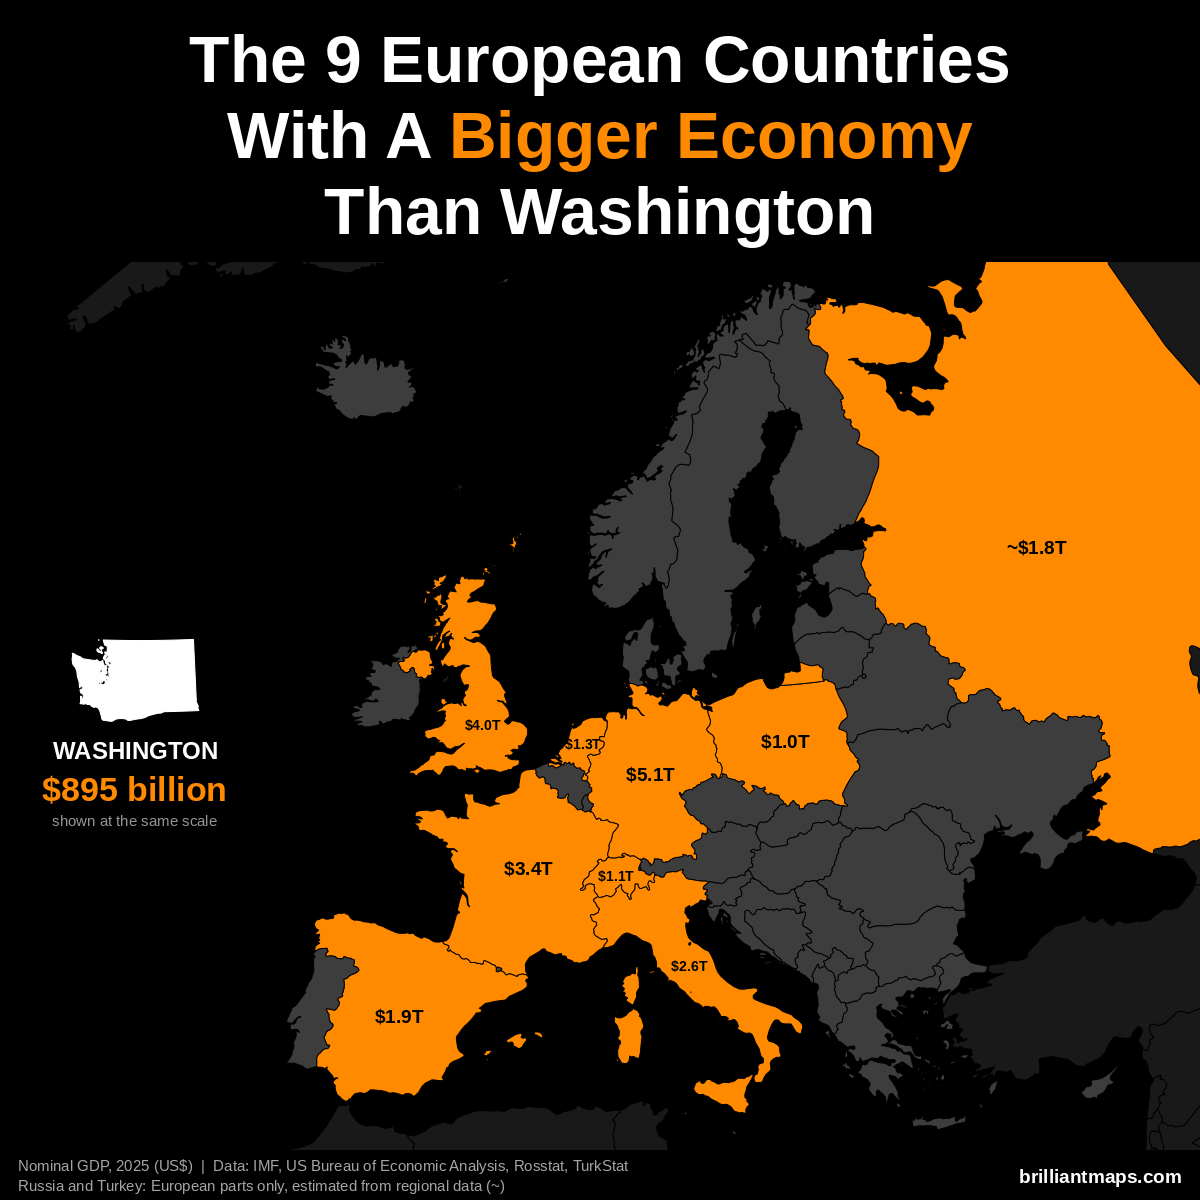
Washington has a nominal GDP of $895 billion (2025). 9 European countries have a bigger economy:
- Germany: $5.12 trillion
- United Kingdom: $4.01 trillion
- France: $3.38 trillion
- Italy: $2.55 trillion
- Spain: $1.91 trillion
- Russia (European part): ~$1.83 trillion
- Netherlands: $1.32 trillion
- Switzerland: $1.06 trillion
- Poland: $1.04 trillion
Washington Vs European GDP (PPP)
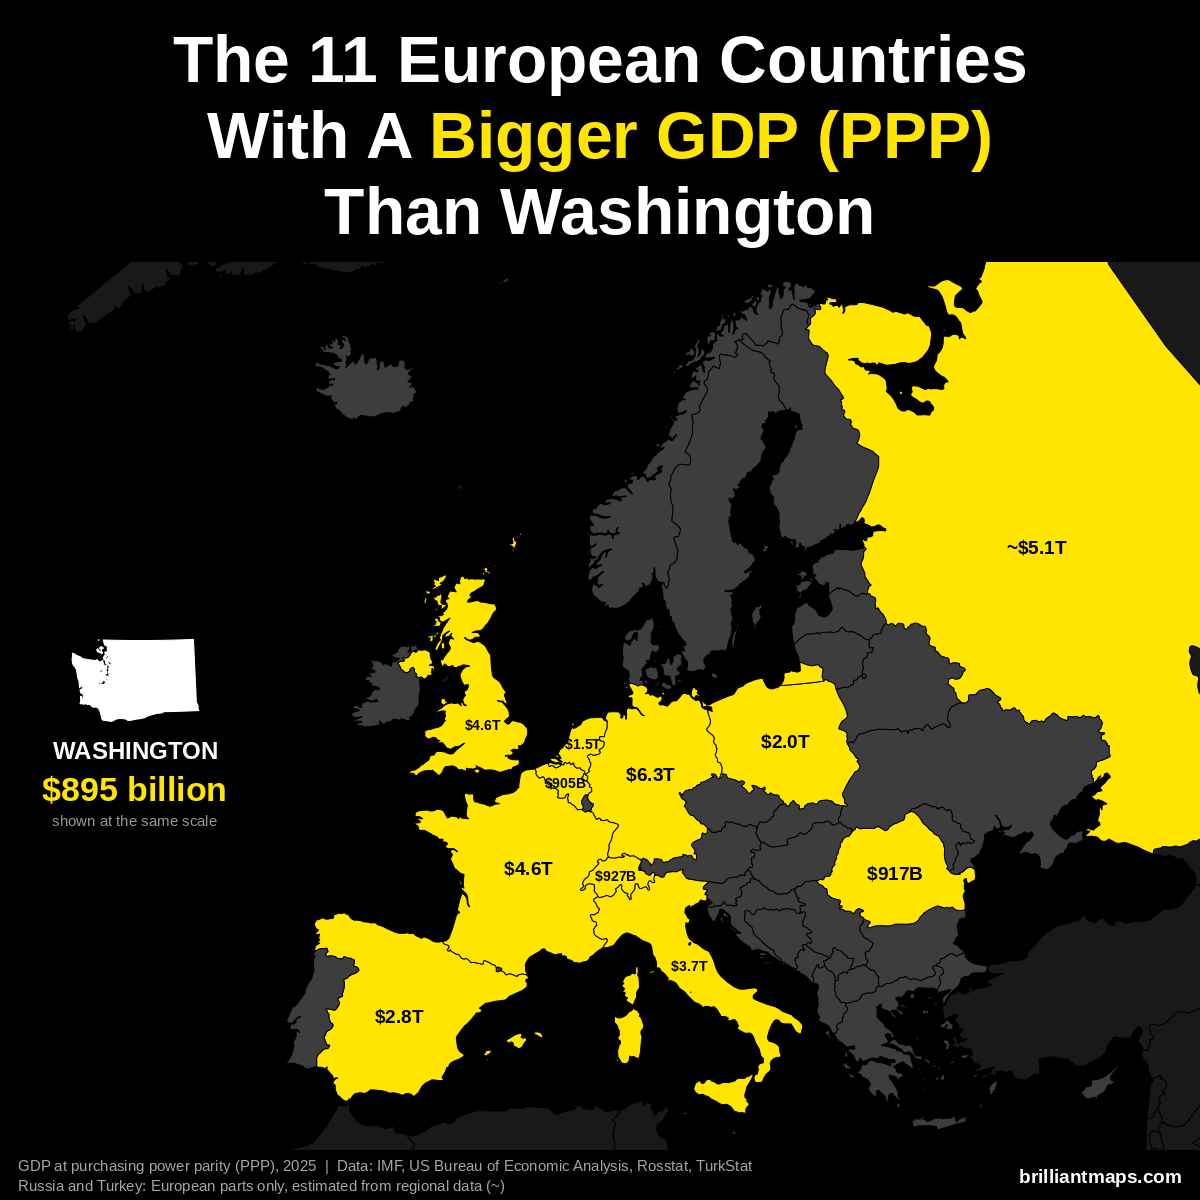
Washington has a GDP of $895 billion (2025). US states are already measured in the dollars PPP is based on, so the figure is the same as nominal GDP. 11 European countries have a bigger GDP at purchasing power parity:
- Germany: $6.26 trillion
- Russia (European part): ~$5.14 trillion
- France: $4.58 trillion
- United Kingdom: $4.57 trillion
- Italy: $3.74 trillion
- Spain: $2.83 trillion
- Poland: $2.04 trillion
- Netherlands: $1.52 trillion
- Switzerland: $927 billion
- Romania: $917 billion
- Belgium: $905 billion
Washington Vs European GDP Per Capita (PPP)
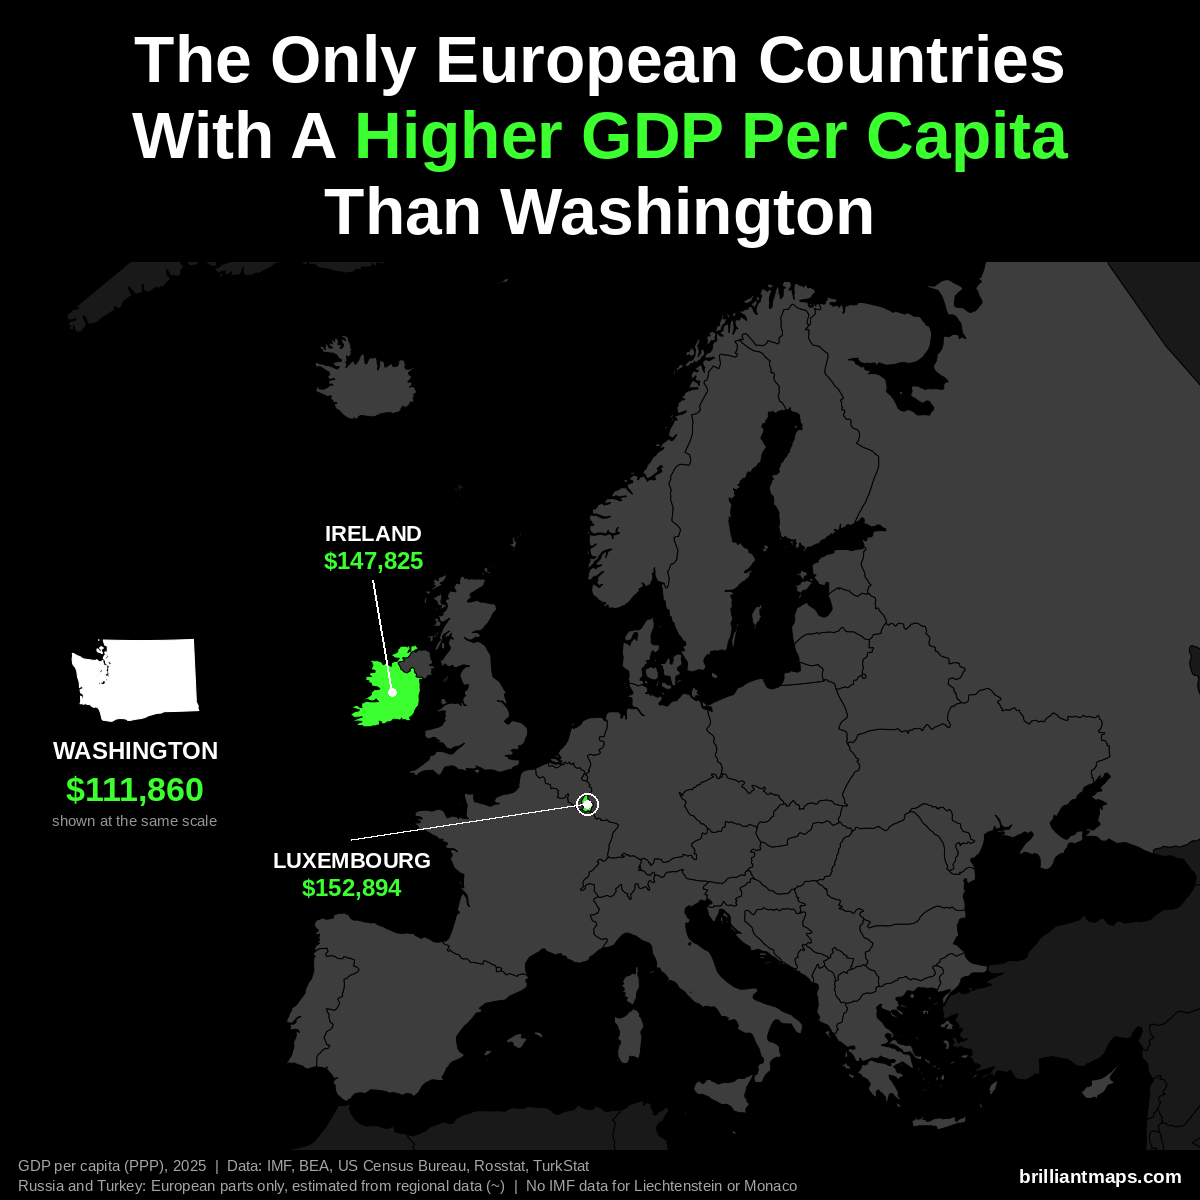
Washington has a GDP per capita of $111,860 (2025). Only 2 European countries have a higher GDP per capita at purchasing power parity:
- Luxembourg: $152,894
- Ireland: $147,825
Liechtenstein and Monaco are not covered by the IMF data and are not counted here.
Washington Vs European Size
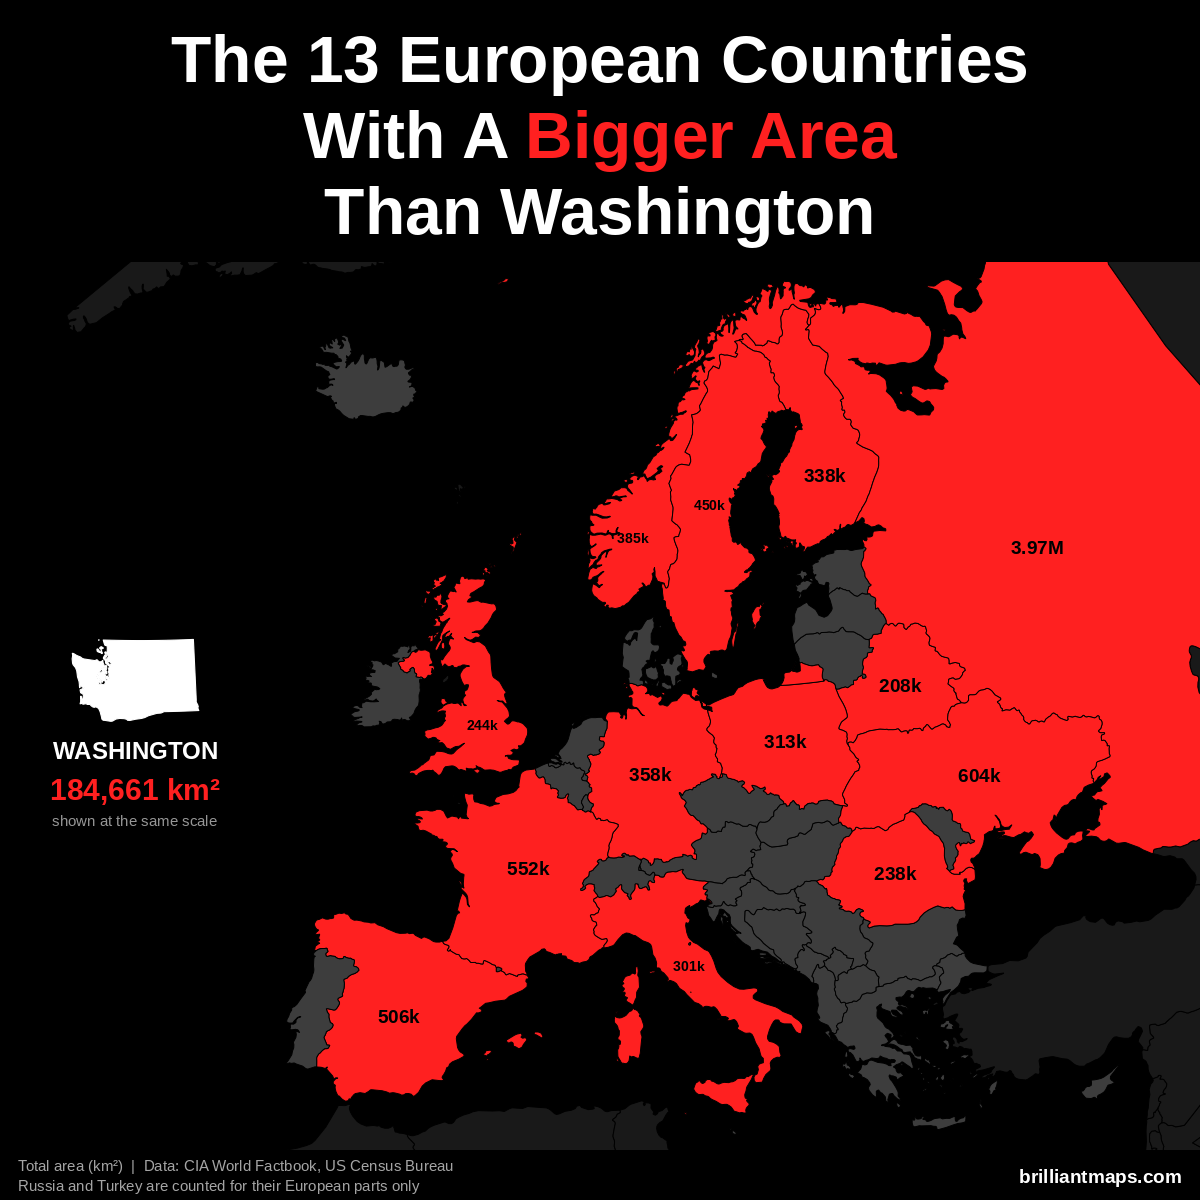
Washington has a total area of 184,661 km² (71,298 sq mi). 13 European countries have a bigger area:
- Russia (European part): 3,969,100 km² (1,532,477 sq mi)
- Ukraine: 603,550 km² (233,032 sq mi)
- France: 551,695 km² (213,010 sq mi)
- Spain: 505,990 km² (195,364 sq mi)
- Sweden: 450,295 km² (173,860 sq mi)
- Norway: 385,207 km² (148,729 sq mi)
- Germany: 357,588 km² (138,065 sq mi)
- Finland: 338,455 km² (130,678 sq mi)
- Poland: 312,696 km² (120,733 sq mi)
- Italy: 301,340 km² (116,348 sq mi)
- United Kingdom: 243,610 km² (94,058 sq mi)
- Romania: 238,397 km² (92,046 sq mi)
- Belarus: 207,600 km² (80,155 sq mi)
Washington Vs European Life Expectancy
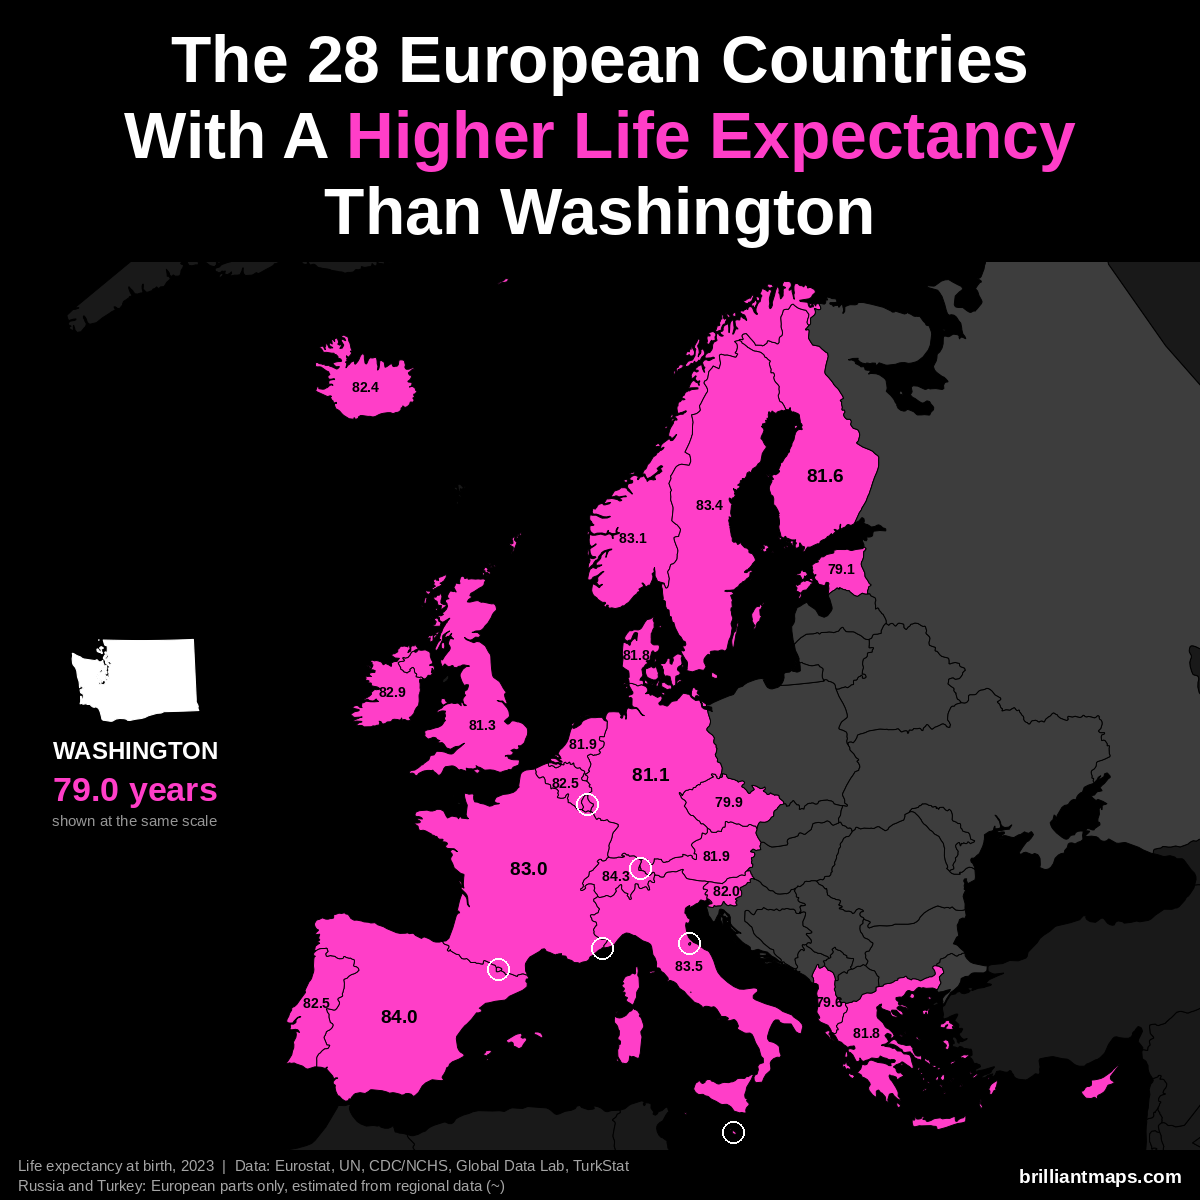
Washington has a life expectancy at birth of 79.0 years (2023). 28 European countries have a higher life expectancy:
- Monaco: 86.4 years
- San Marino: 85.7 years
- Liechtenstein: 84.6 years
- Switzerland: 84.3 years
- Andorra: 84.0 years
- Spain: 84.0 years
- Italy: 83.5 years
- Luxembourg: 83.4 years
- Malta: 83.4 years
- Sweden: 83.4 years
- Norway: 83.1 years
- France: 83.0 years
- Cyprus: 82.9 years
- Ireland: 82.9 years
- Belgium: 82.5 years
- Portugal: 82.5 years
- Iceland: 82.4 years
- Slovenia: 82.0 years
- Austria: 81.9 years
- Netherlands: 81.9 years
- Denmark: 81.8 years
- Greece: 81.8 years
- Finland: 81.6 years
- United Kingdom: 81.3 years
- Germany: 81.1 years
- Czechia: 79.9 years
- Albania: 79.6 years
- Estonia: 79.1 years
West Virginia vs Europe
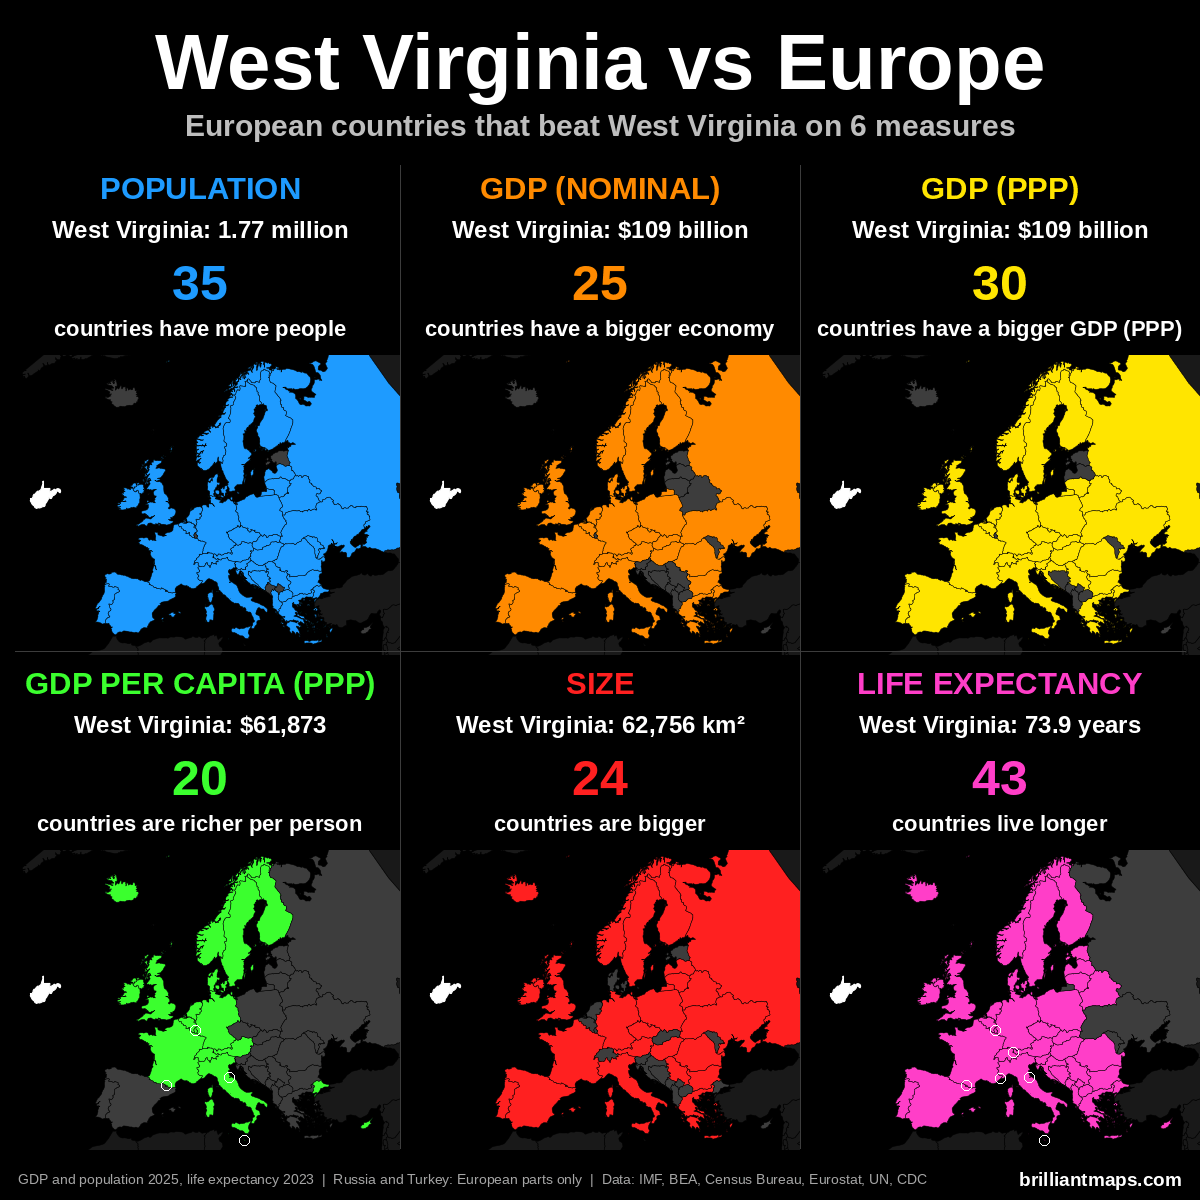
West Virginia Vs European Population
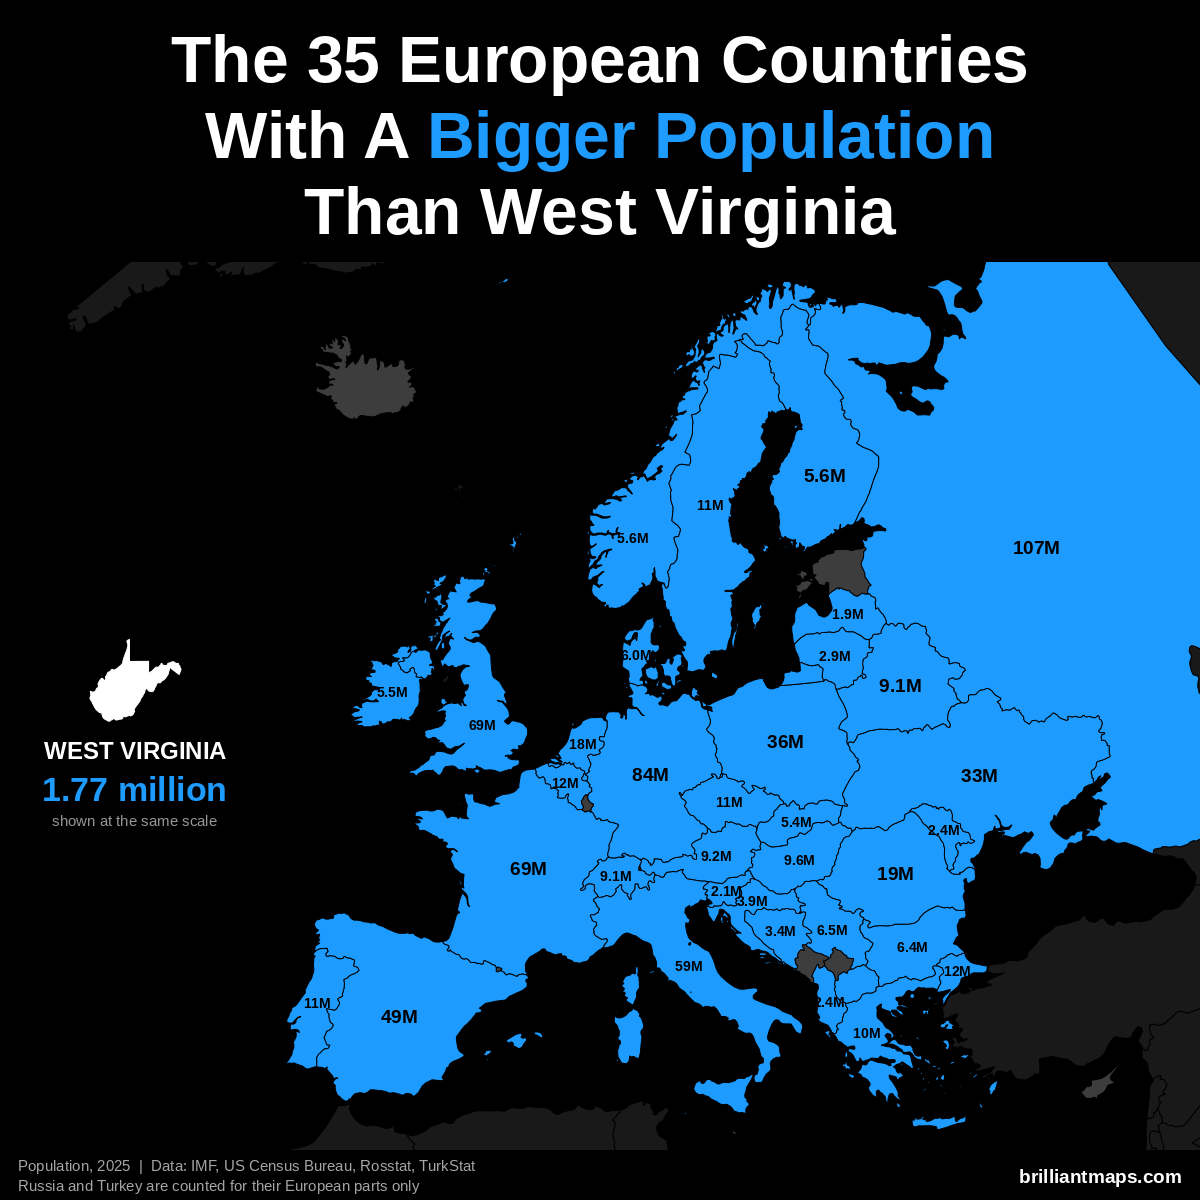
West Virginia has a population of 1.8 million (2025). 35 European countries have a bigger population:
- Russia (European part): 107.0 million
- Germany: 83.5 million
- United Kingdom: 69.5 million
- France: 68.9 million
- Italy: 58.9 million
- Spain: 49.5 million
- Poland: 36.5 million
- Ukraine: 32.9 million
- Romania: 19.0 million
- Netherlands: 18.0 million
- Turkey (European part): 12.2 million
- Belgium: 11.9 million
- Portugal: 10.8 million
- Czechia: 10.8 million
- Sweden: 10.7 million
- Greece: 10.4 million
- Hungary: 9.6 million
- Austria: 9.2 million
- Belarus: 9.1 million
- Switzerland: 9.1 million
- Serbia: 6.5 million
- Bulgaria: 6.4 million
- Denmark: 6.0 million
- Norway: 5.6 million
- Finland: 5.6 million
- Ireland: 5.5 million
- Slovakia: 5.4 million
- Croatia: 3.9 million
- Bosnia and Herzegovina: 3.4 million
- Lithuania: 2.9 million
- Moldova: 2.4 million
- Albania: 2.4 million
- Slovenia: 2.1 million
- Latvia: 1.9 million
- North Macedonia: 1.8 million
West Virginia Vs European GDP (Nominal)
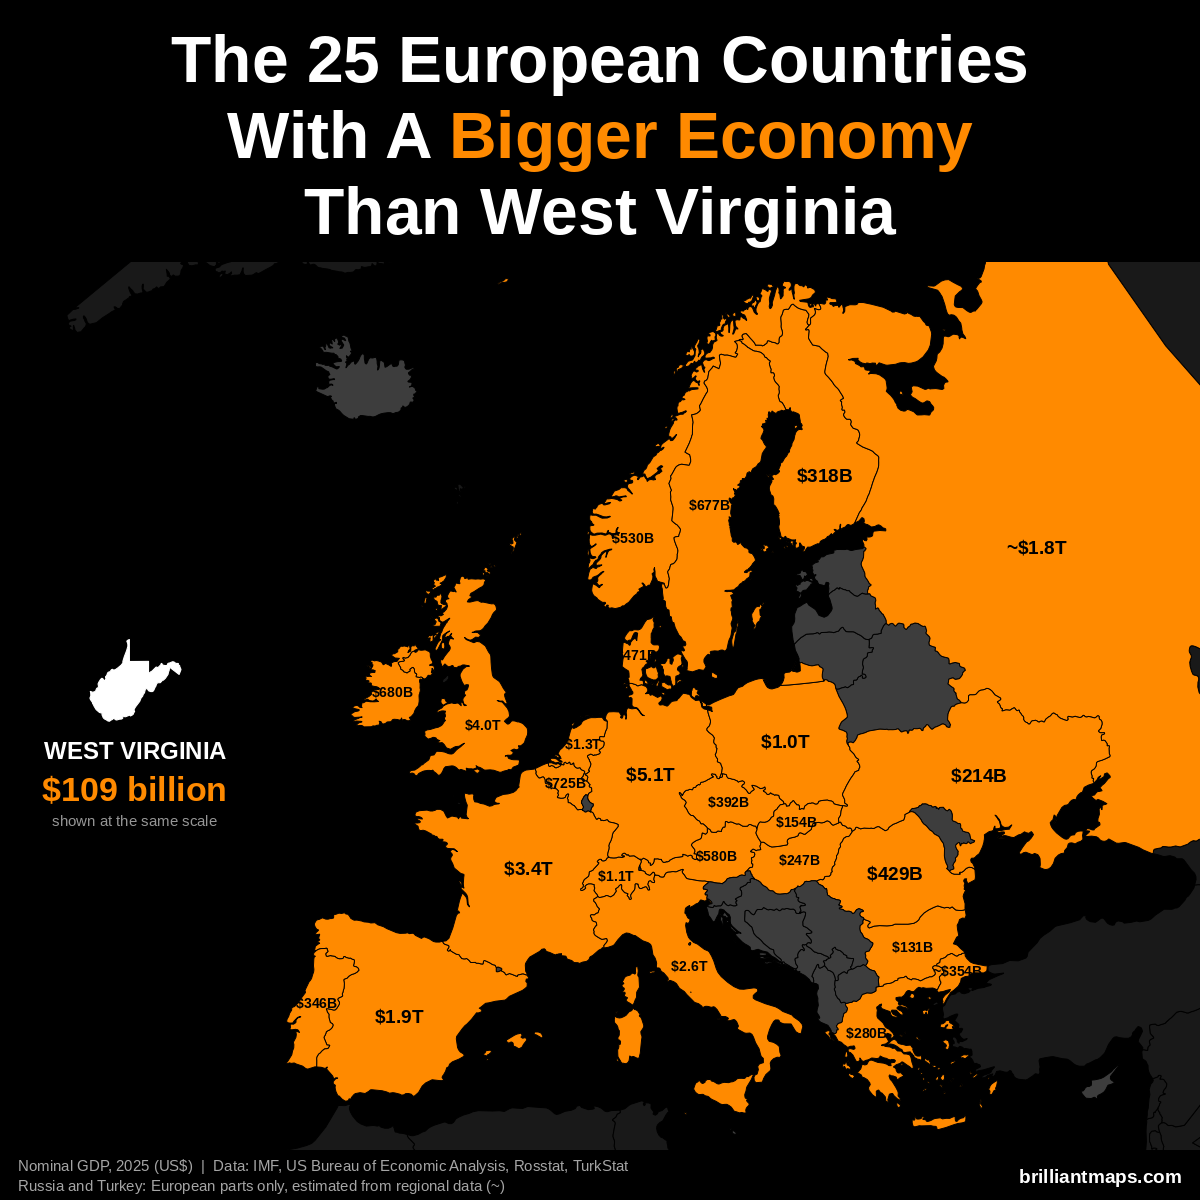
West Virginia has a nominal GDP of $109 billion (2025). 25 European countries have a bigger economy:
- Germany: $5.12 trillion
- United Kingdom: $4.01 trillion
- France: $3.38 trillion
- Italy: $2.55 trillion
- Spain: $1.91 trillion
- Russia (European part): ~$1.83 trillion
- Netherlands: $1.32 trillion
- Switzerland: $1.06 trillion
- Poland: $1.04 trillion
- Belgium: $725 billion
- Ireland: $680 billion
- Sweden: $677 billion
- Austria: $580 billion
- Norway: $530 billion
- Denmark: $471 billion
- Romania: $429 billion
- Czechia: $392 billion
- Turkey (European part): ~$354 billion
- Portugal: $346 billion
- Finland: $318 billion
- Greece: $280 billion
- Hungary: $247 billion
- Ukraine: $214 billion
- Slovakia: $154 billion
- Bulgaria: $131 billion
West Virginia Vs European GDP (PPP)
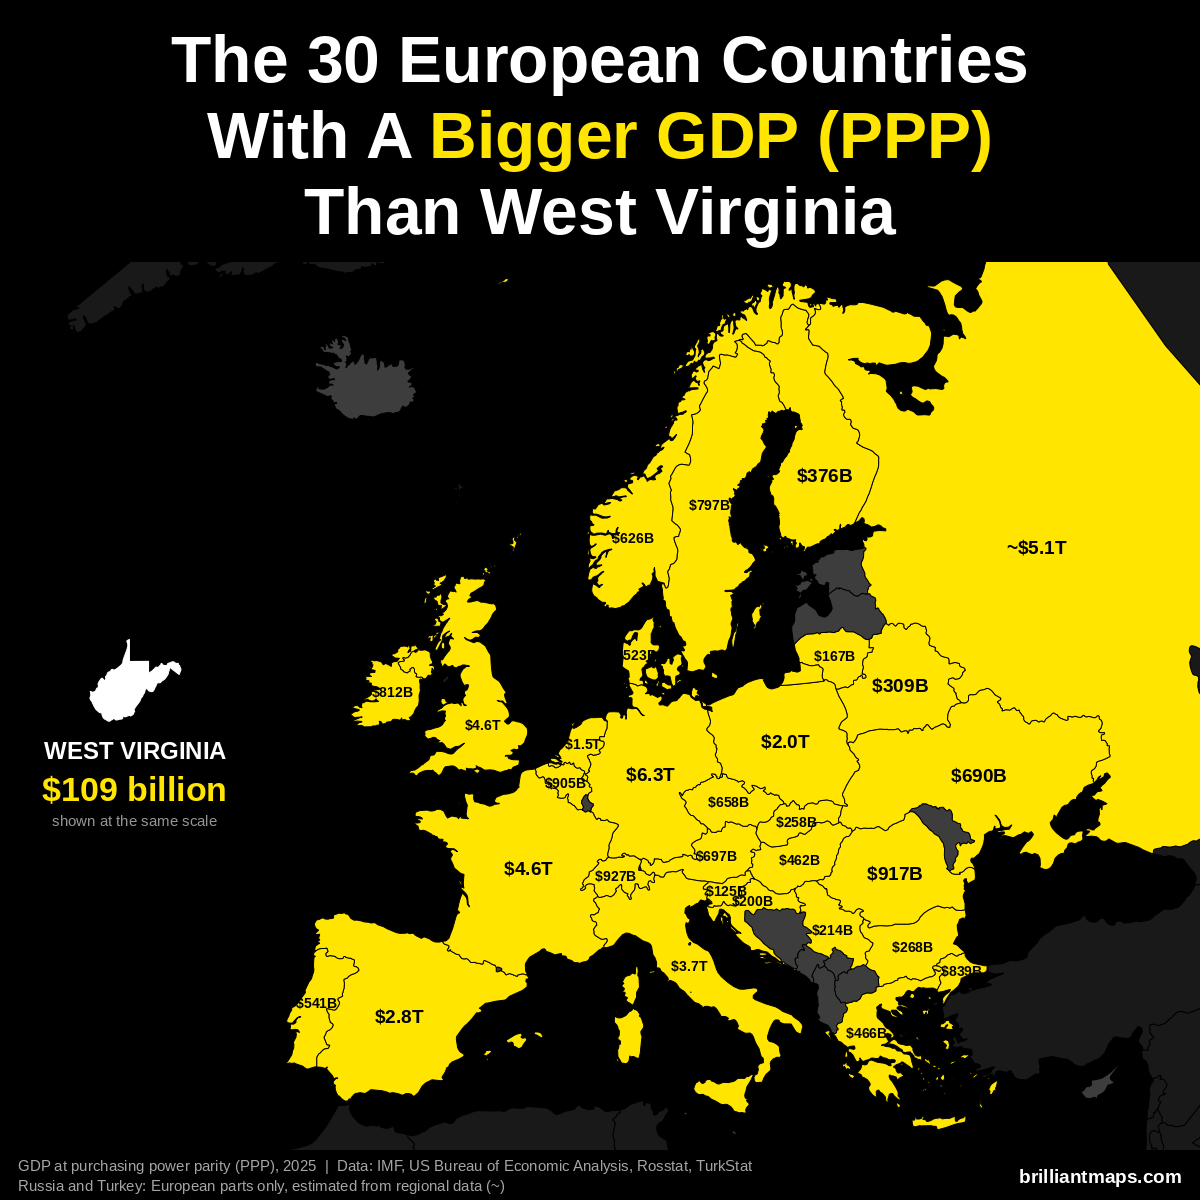
West Virginia has a GDP of $109 billion (2025). US states are already measured in the dollars PPP is based on, so the figure is the same as nominal GDP. 30 European countries have a bigger GDP at purchasing power parity:
- Germany: $6.26 trillion
- Russia (European part): ~$5.14 trillion
- France: $4.58 trillion
- United Kingdom: $4.57 trillion
- Italy: $3.74 trillion
- Spain: $2.83 trillion
- Poland: $2.04 trillion
- Netherlands: $1.52 trillion
- Switzerland: $927 billion
- Romania: $917 billion
- Belgium: $905 billion
- Turkey (European part): ~$839 billion
- Ireland: $812 billion
- Sweden: $797 billion
- Austria: $697 billion
- Ukraine: $690 billion
- Czechia: $658 billion
- Norway: $626 billion
- Portugal: $541 billion
- Denmark: $523 billion
- Greece: $466 billion
- Hungary: $462 billion
- Finland: $376 billion
- Belarus: $309 billion
- Bulgaria: $268 billion
- Slovakia: $258 billion
- Serbia: $214 billion
- Croatia: $200 billion
- Lithuania: $167 billion
- Slovenia: $125 billion
West Virginia Vs European GDP Per Capita (PPP)
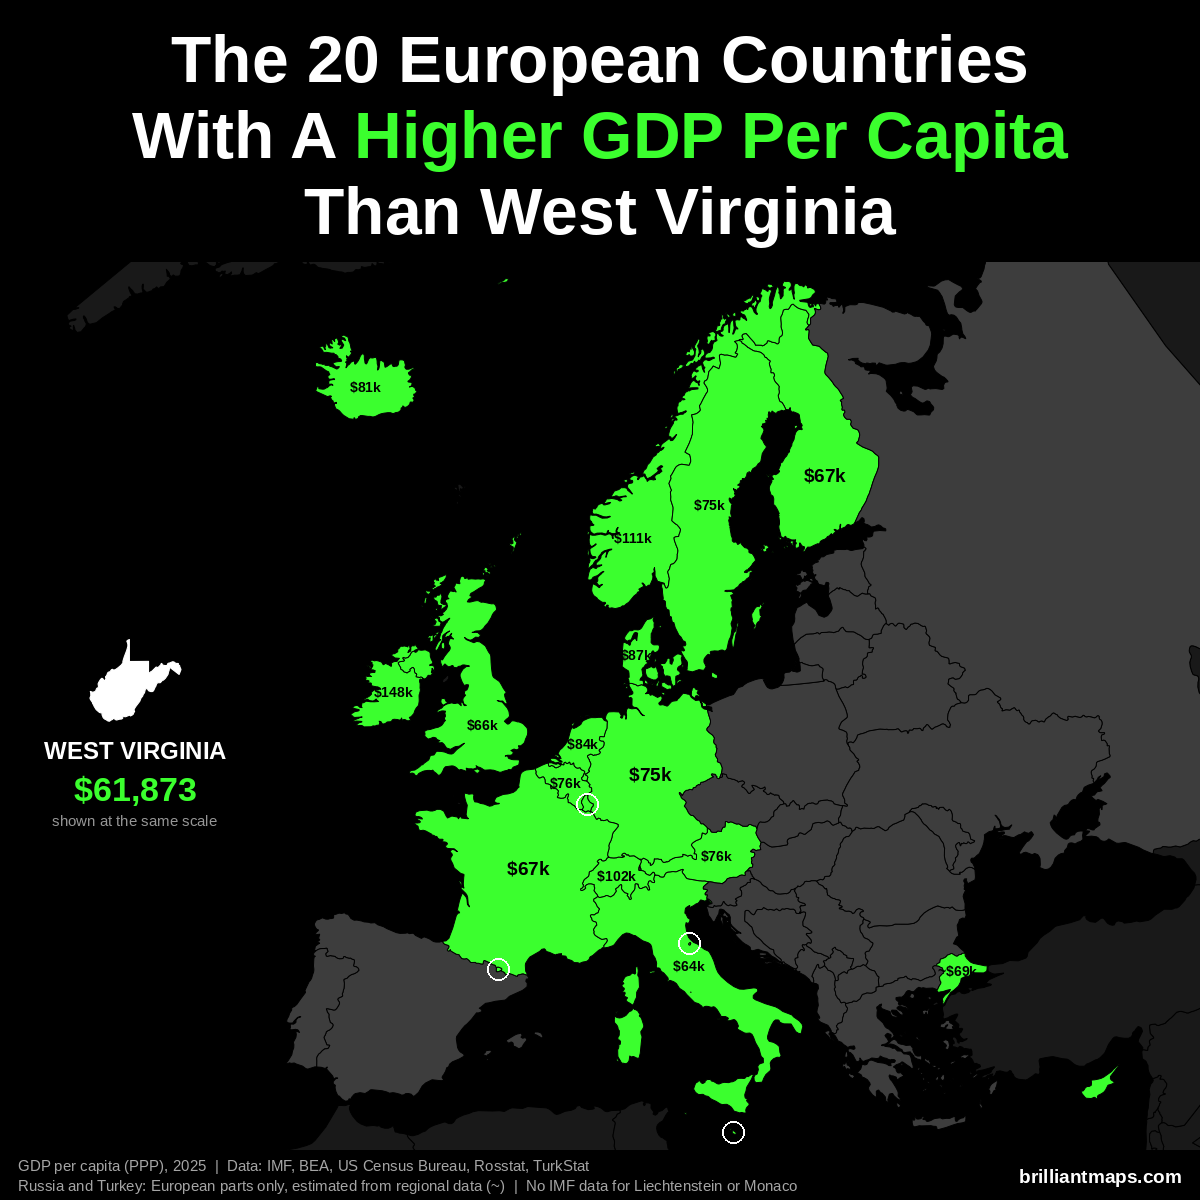
West Virginia has a GDP per capita of $61,873 (2025). 20 European countries have a higher GDP per capita at purchasing power parity:
- Luxembourg: $152,894
- Ireland: $147,825
- Norway: $111,462
- Switzerland: $102,397
- Denmark: $87,303
- Netherlands: $84,445
- San Marino: $83,838
- Iceland: $80,915
- Belgium: $76,136
- Austria: $75,965
- Malta: $75,687
- Germany: $74,901
- Sweden: $74,651
- Andorra: $74,059
- Turkey (European part): ~$68,800
- Finland: $67,097
- France: $66,559
- United Kingdom: $65,758
- Cyprus: $65,038
- Italy: $63,508
Liechtenstein and Monaco are not covered by the IMF data and are not counted here.
West Virginia Vs European Size
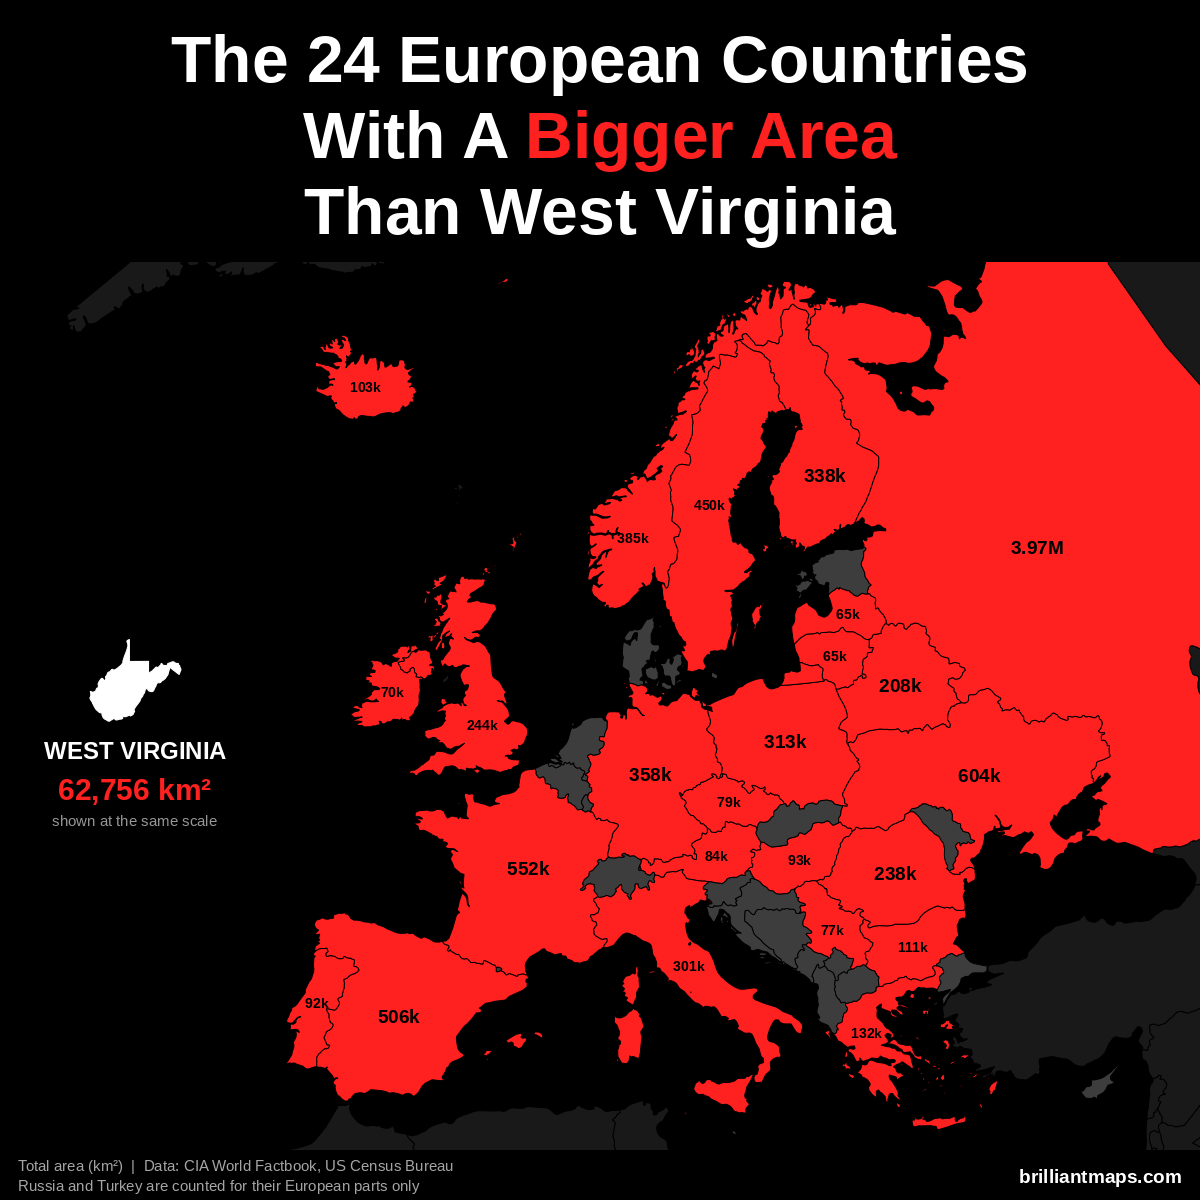
West Virginia has a total area of 62,756 km² (24,230 sq mi). 24 European countries have a bigger area:
- Russia (European part): 3,969,100 km² (1,532,477 sq mi)
- Ukraine: 603,550 km² (233,032 sq mi)
- France: 551,695 km² (213,010 sq mi)
- Spain: 505,990 km² (195,364 sq mi)
- Sweden: 450,295 km² (173,860 sq mi)
- Norway: 385,207 km² (148,729 sq mi)
- Germany: 357,588 km² (138,065 sq mi)
- Finland: 338,455 km² (130,678 sq mi)
- Poland: 312,696 km² (120,733 sq mi)
- Italy: 301,340 km² (116,348 sq mi)
- United Kingdom: 243,610 km² (94,058 sq mi)
- Romania: 238,397 km² (92,046 sq mi)
- Belarus: 207,600 km² (80,155 sq mi)
- Greece: 131,957 km² (50,949 sq mi)
- Bulgaria: 110,994 km² (42,855 sq mi)
- Iceland: 103,000 km² (39,768 sq mi)
- Hungary: 93,028 km² (35,918 sq mi)
- Portugal: 92,212 km² (35,603 sq mi)
- Austria: 83,871 km² (32,383 sq mi)
- Czechia: 78,867 km² (30,451 sq mi)
- Serbia: 77,474 km² (29,913 sq mi)
- Ireland: 70,273 km² (27,133 sq mi)
- Lithuania: 65,300 km² (25,212 sq mi)
- Latvia: 64,589 km² (24,938 sq mi)
West Virginia Vs European Life Expectancy
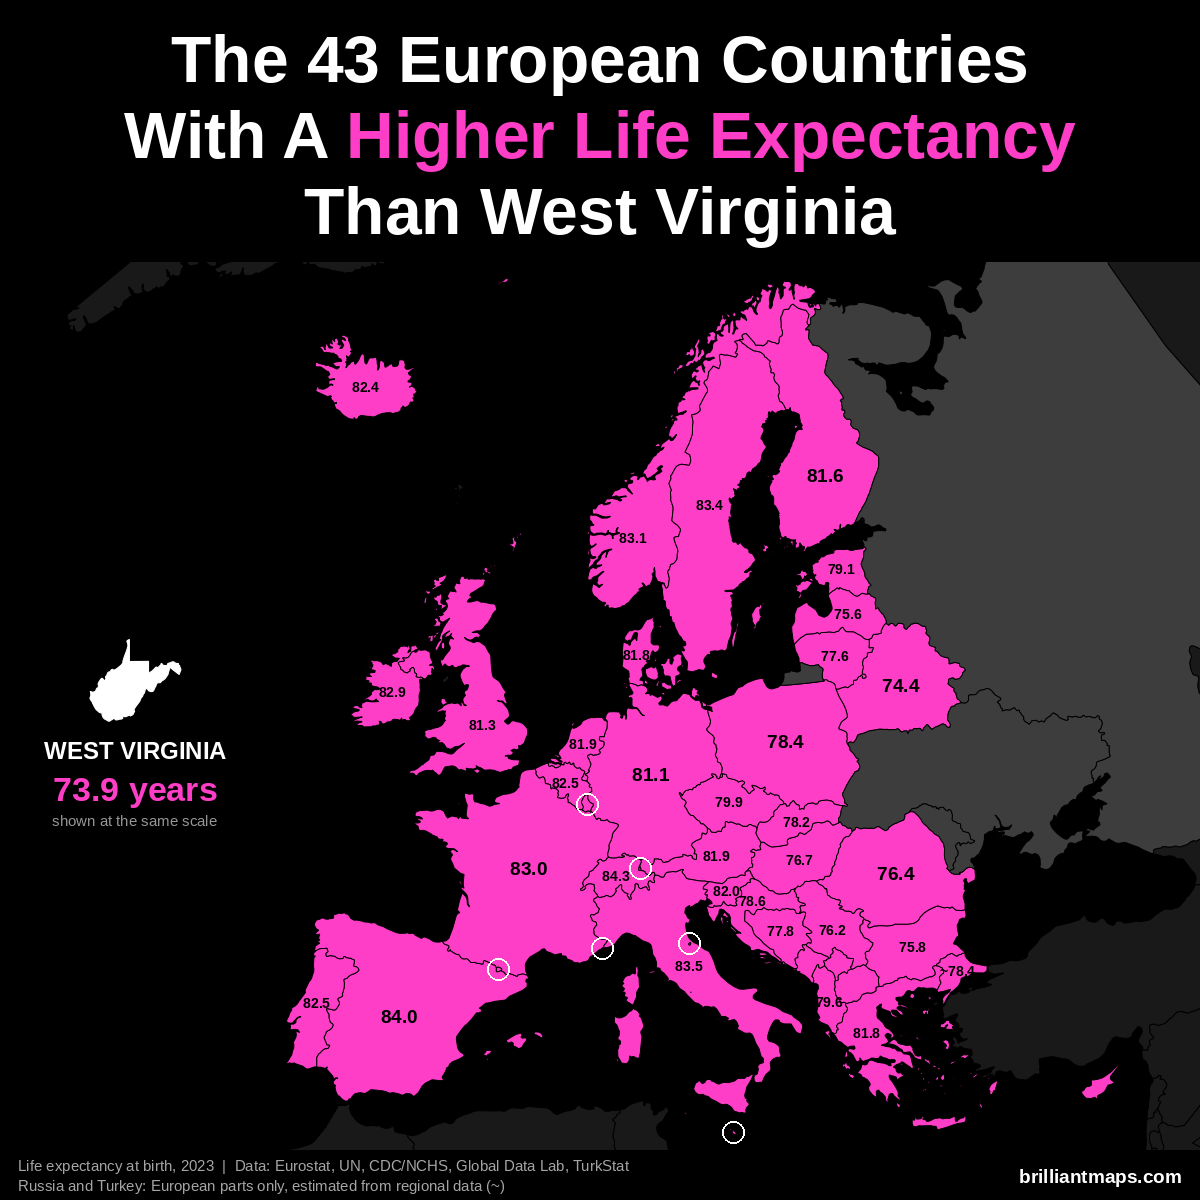
West Virginia has a life expectancy at birth of 73.9 years (2023). 43 European countries have a higher life expectancy:
- Monaco: 86.4 years
- San Marino: 85.7 years
- Liechtenstein: 84.6 years
- Switzerland: 84.3 years
- Andorra: 84.0 years
- Spain: 84.0 years
- Italy: 83.5 years
- Luxembourg: 83.4 years
- Malta: 83.4 years
- Sweden: 83.4 years
- Norway: 83.1 years
- France: 83.0 years
- Cyprus: 82.9 years
- Ireland: 82.9 years
- Belgium: 82.5 years
- Portugal: 82.5 years
- Iceland: 82.4 years
- Slovenia: 82.0 years
- Austria: 81.9 years
- Netherlands: 81.9 years
- Denmark: 81.8 years
- Greece: 81.8 years
- Finland: 81.6 years
- United Kingdom: 81.3 years
- Germany: 81.1 years
- Czechia: 79.9 years
- Albania: 79.6 years
- Estonia: 79.1 years
- Croatia: 78.6 years
- Poland: 78.4 years
- Turkey (European part): ~78.4 years
- Slovakia: 78.2 years
- Kosovo: 78.0 years
- Bosnia and Herzegovina: 77.8 years
- Lithuania: 77.6 years
- Montenegro: 77.6 years
- North Macedonia: 77.4 years
- Hungary: 76.7 years
- Romania: 76.4 years
- Serbia: 76.2 years
- Bulgaria: 75.8 years
- Latvia: 75.6 years
- Belarus: 74.4 years
Wisconsin vs Europe
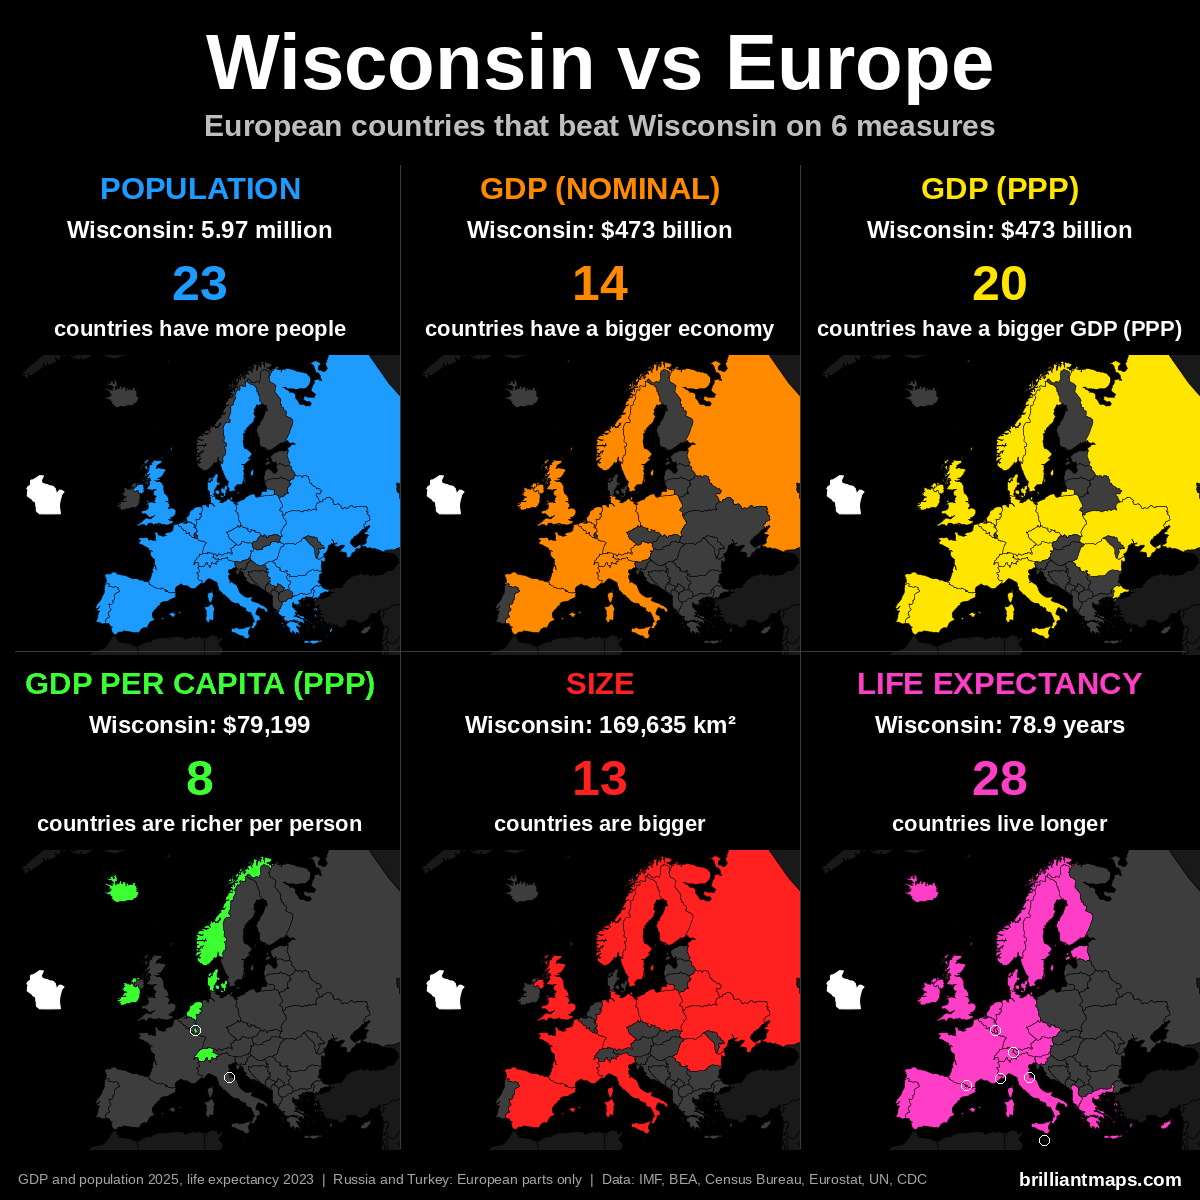
Wisconsin Vs European Population
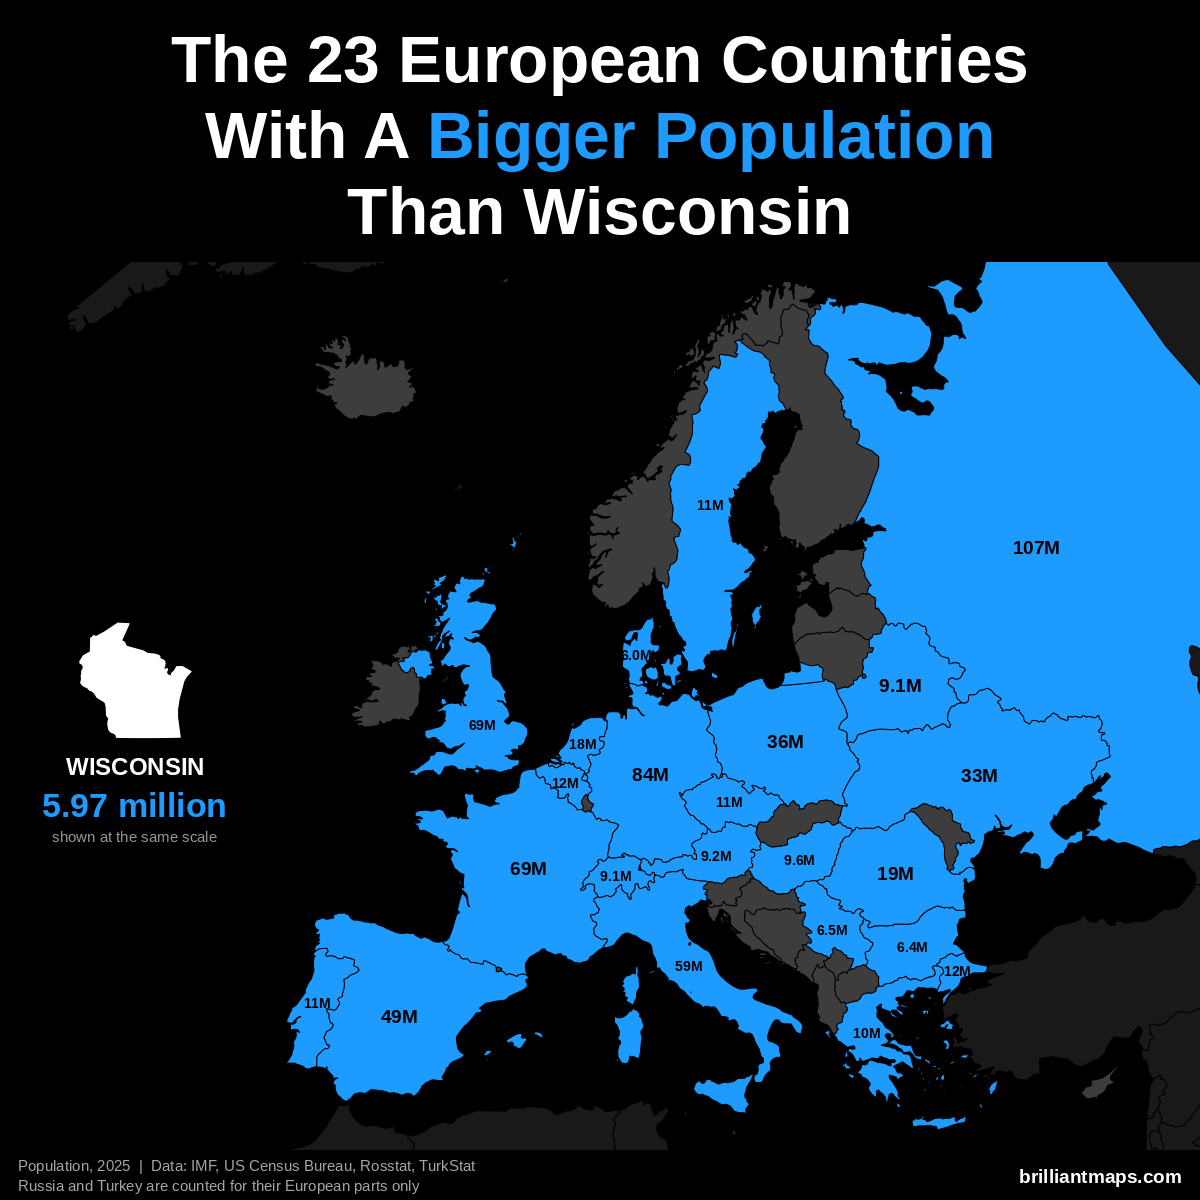
Wisconsin has a population of 6.0 million (2025). 23 European countries have a bigger population:
- Russia (European part): 107.0 million
- Germany: 83.5 million
- United Kingdom: 69.5 million
- France: 68.9 million
- Italy: 58.9 million
- Spain: 49.5 million
- Poland: 36.5 million
- Ukraine: 32.9 million
- Romania: 19.0 million
- Netherlands: 18.0 million
- Turkey (European part): 12.2 million
- Belgium: 11.9 million
- Portugal: 10.8 million
- Czechia: 10.8 million
- Sweden: 10.7 million
- Greece: 10.4 million
- Hungary: 9.6 million
- Austria: 9.2 million
- Belarus: 9.1 million
- Switzerland: 9.1 million
- Serbia: 6.5 million
- Bulgaria: 6.4 million
- Denmark: 6.0 million
Wisconsin Vs European GDP (Nominal)
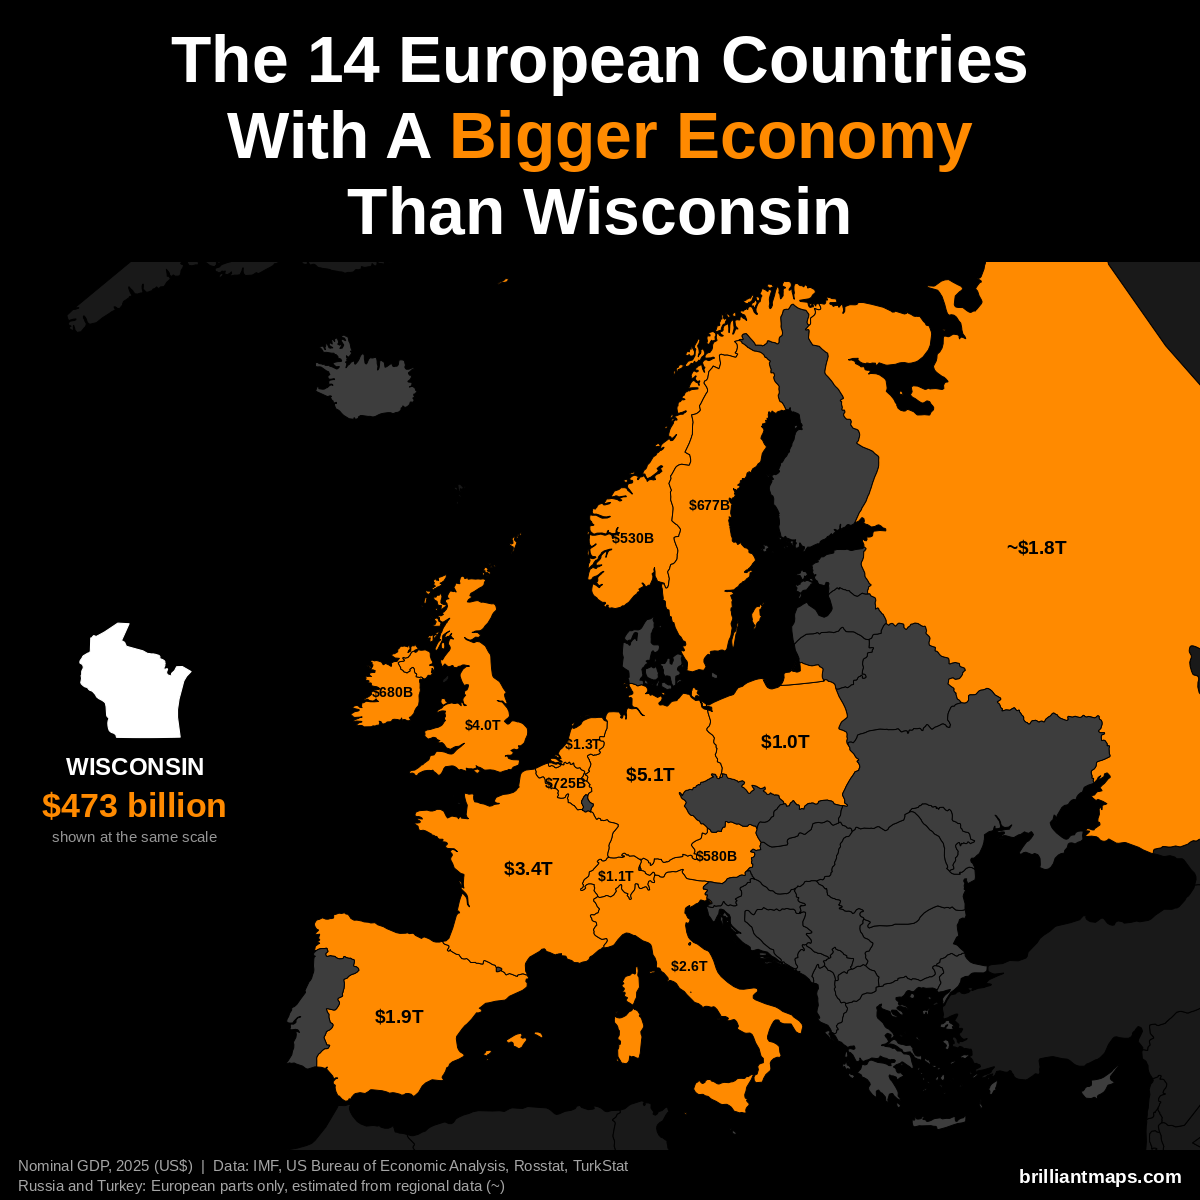
Wisconsin has a nominal GDP of $473 billion (2025). 14 European countries have a bigger economy:
- Germany: $5.12 trillion
- United Kingdom: $4.01 trillion
- France: $3.38 trillion
- Italy: $2.55 trillion
- Spain: $1.91 trillion
- Russia (European part): ~$1.83 trillion
- Netherlands: $1.32 trillion
- Switzerland: $1.06 trillion
- Poland: $1.04 trillion
- Belgium: $725 billion
- Ireland: $680 billion
- Sweden: $677 billion
- Austria: $580 billion
- Norway: $530 billion
Wisconsin Vs European GDP (PPP)
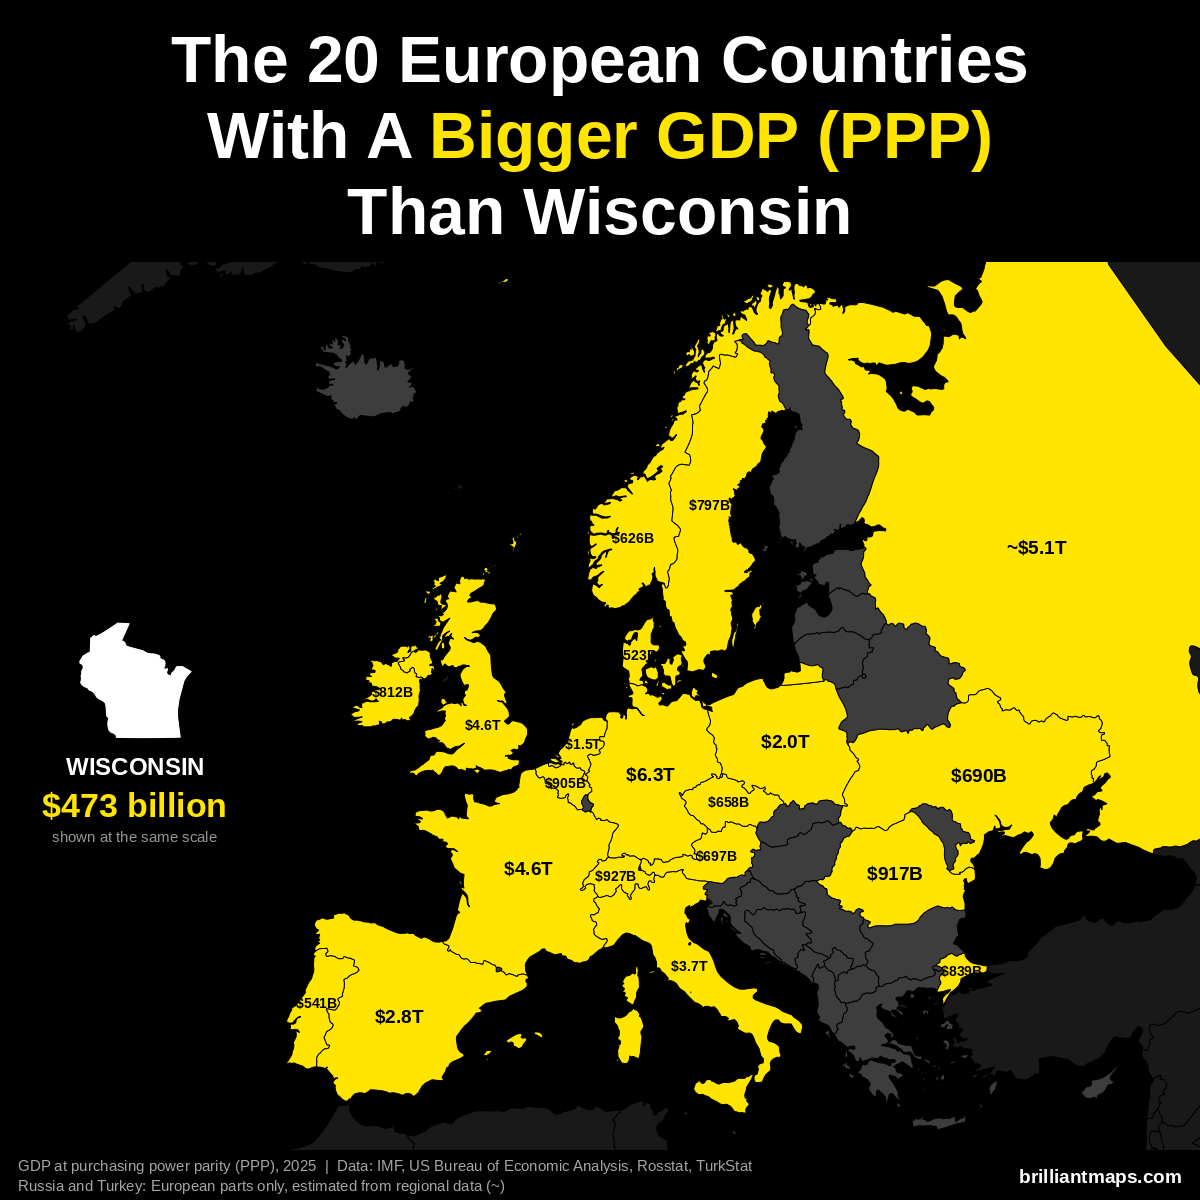
Wisconsin has a GDP of $473 billion (2025). US states are already measured in the dollars PPP is based on, so the figure is the same as nominal GDP. 20 European countries have a bigger GDP at purchasing power parity:
- Germany: $6.26 trillion
- Russia (European part): ~$5.14 trillion
- France: $4.58 trillion
- United Kingdom: $4.57 trillion
- Italy: $3.74 trillion
- Spain: $2.83 trillion
- Poland: $2.04 trillion
- Netherlands: $1.52 trillion
- Switzerland: $927 billion
- Romania: $917 billion
- Belgium: $905 billion
- Turkey (European part): ~$839 billion
- Ireland: $812 billion
- Sweden: $797 billion
- Austria: $697 billion
- Ukraine: $690 billion
- Czechia: $658 billion
- Norway: $626 billion
- Portugal: $541 billion
- Denmark: $523 billion
Wisconsin Vs European GDP Per Capita (PPP)
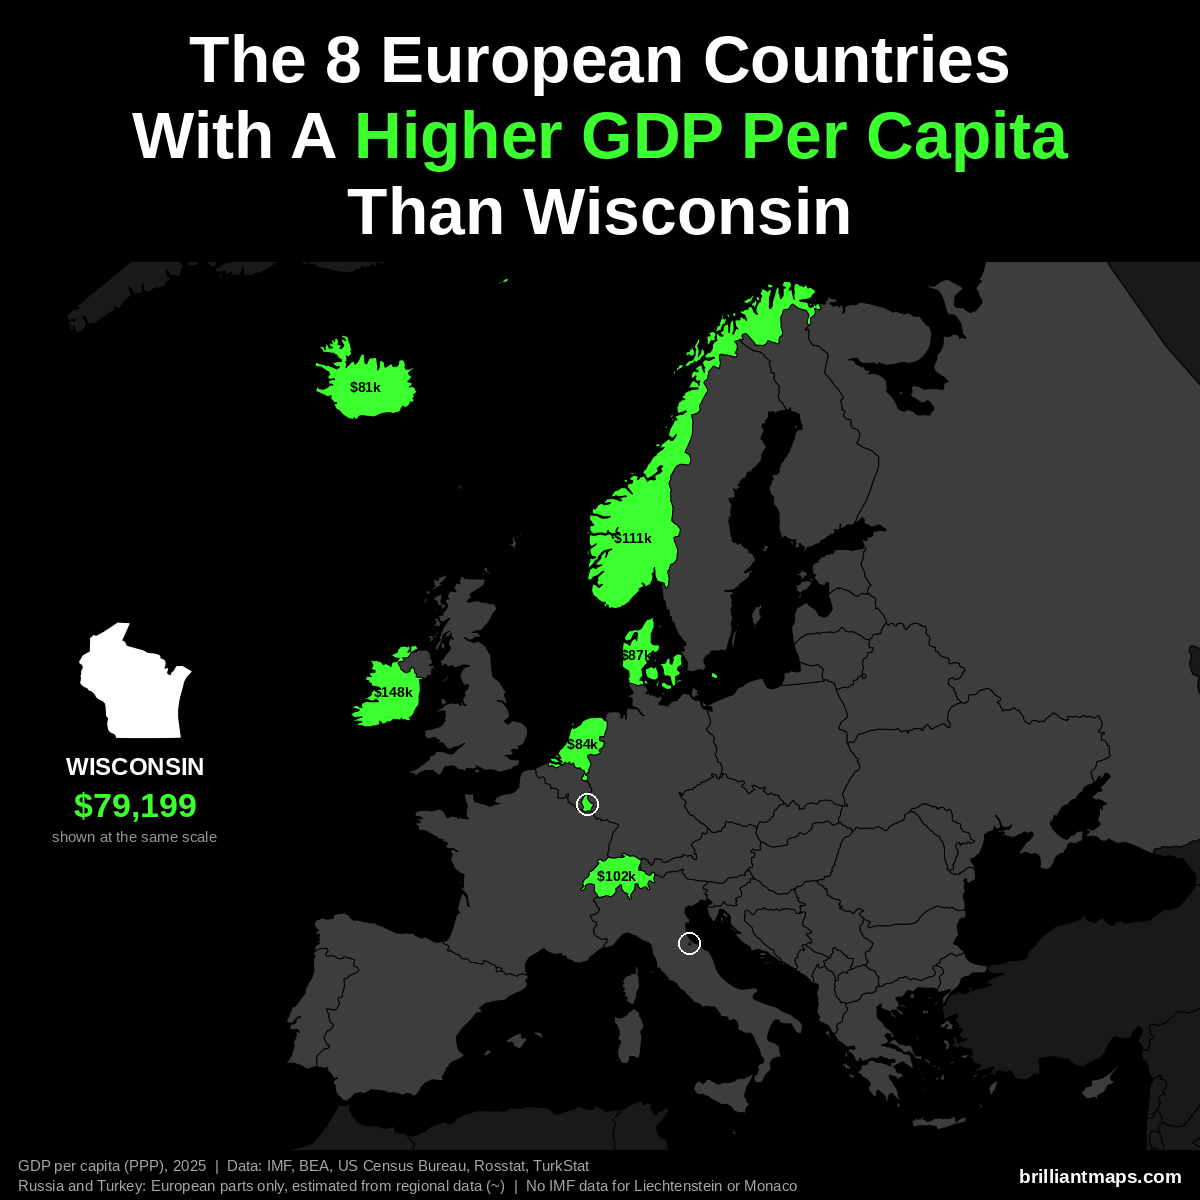
Wisconsin has a GDP per capita of $79,199 (2025). 8 European countries have a higher GDP per capita at purchasing power parity:
- Luxembourg: $152,894
- Ireland: $147,825
- Norway: $111,462
- Switzerland: $102,397
- Denmark: $87,303
- Netherlands: $84,445
- San Marino: $83,838
- Iceland: $80,915
Liechtenstein and Monaco are not covered by the IMF data and are not counted here.
Wisconsin Vs European Size
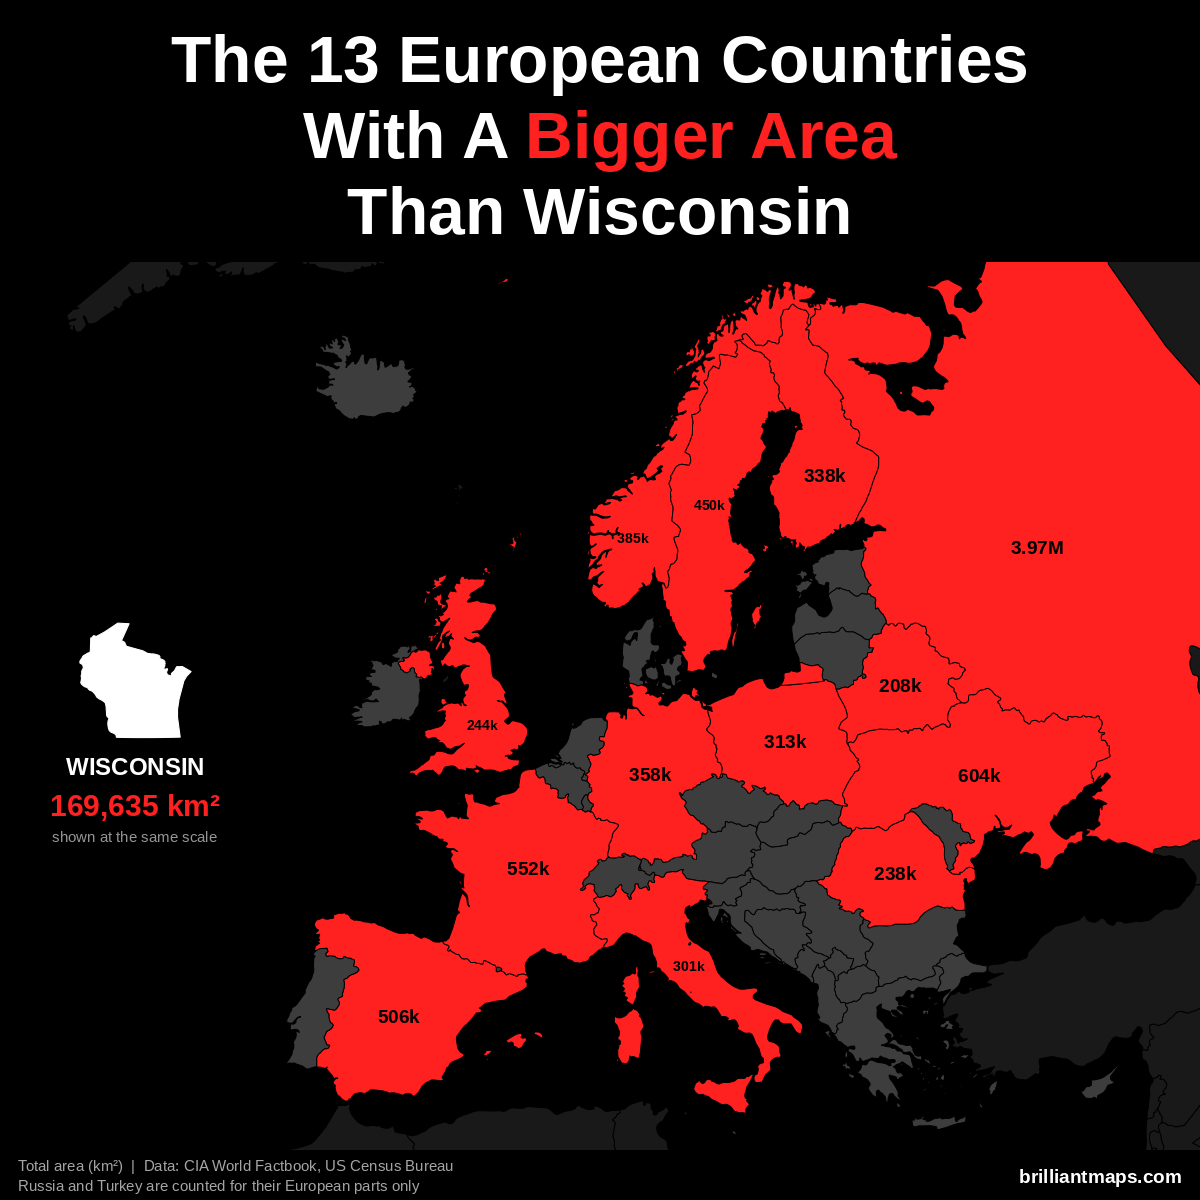
Wisconsin has a total area of 169,635 km² (65,496 sq mi). 13 European countries have a bigger area:
- Russia (European part): 3,969,100 km² (1,532,477 sq mi)
- Ukraine: 603,550 km² (233,032 sq mi)
- France: 551,695 km² (213,010 sq mi)
- Spain: 505,990 km² (195,364 sq mi)
- Sweden: 450,295 km² (173,860 sq mi)
- Norway: 385,207 km² (148,729 sq mi)
- Germany: 357,588 km² (138,065 sq mi)
- Finland: 338,455 km² (130,678 sq mi)
- Poland: 312,696 km² (120,733 sq mi)
- Italy: 301,340 km² (116,348 sq mi)
- United Kingdom: 243,610 km² (94,058 sq mi)
- Romania: 238,397 km² (92,046 sq mi)
- Belarus: 207,600 km² (80,155 sq mi)
Wisconsin Vs European Life Expectancy
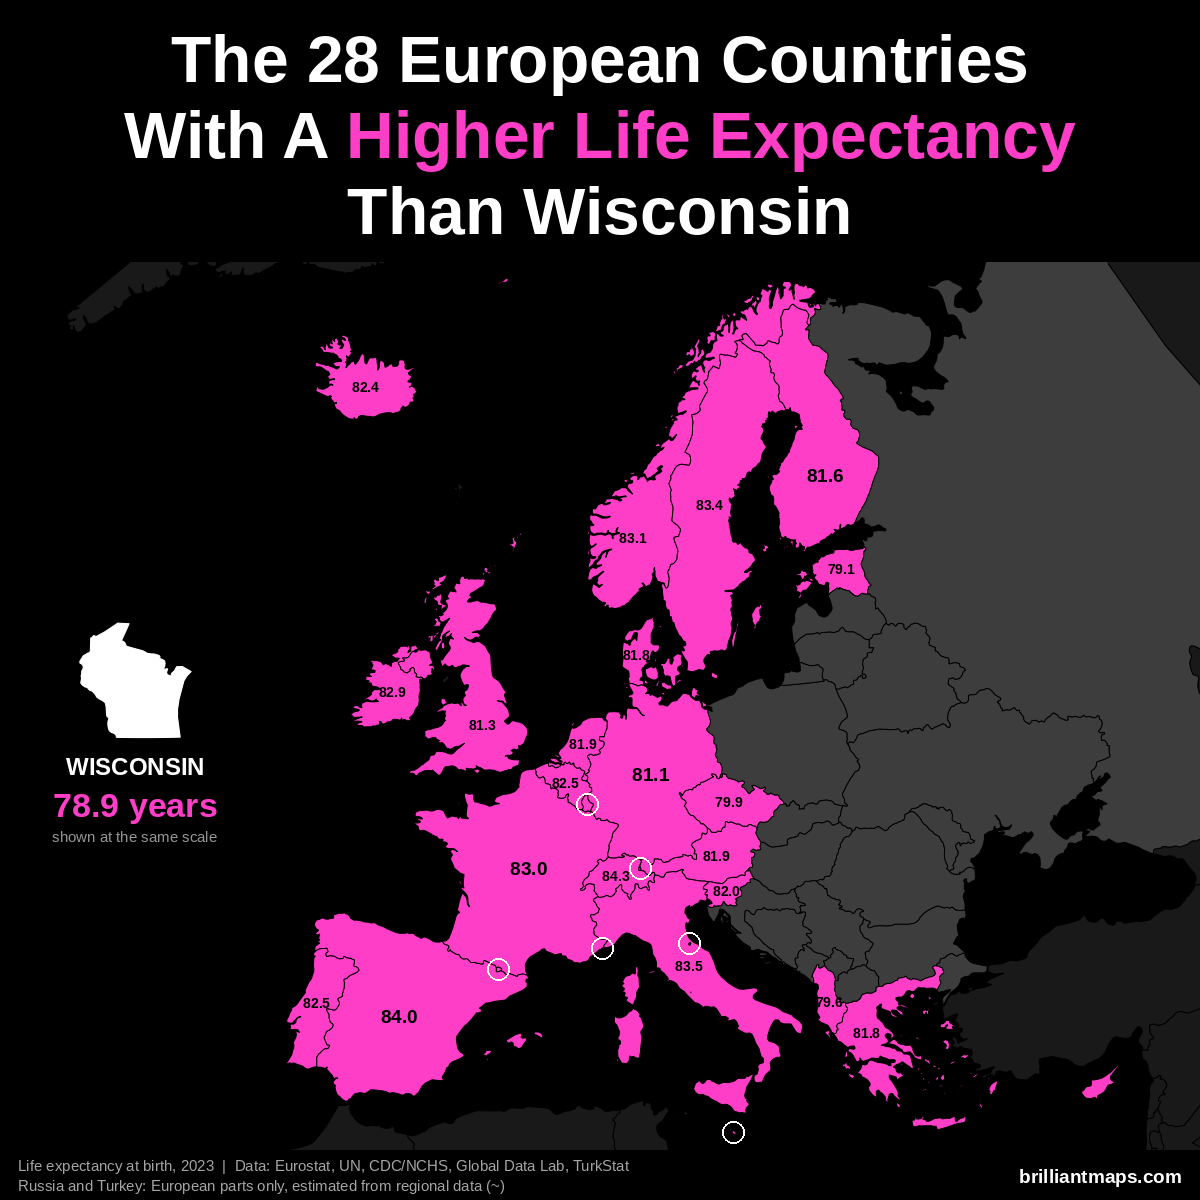
Wisconsin has a life expectancy at birth of 78.9 years (2023). 28 European countries have a higher life expectancy:
- Monaco: 86.4 years
- San Marino: 85.7 years
- Liechtenstein: 84.6 years
- Switzerland: 84.3 years
- Andorra: 84.0 years
- Spain: 84.0 years
- Italy: 83.5 years
- Luxembourg: 83.4 years
- Malta: 83.4 years
- Sweden: 83.4 years
- Norway: 83.1 years
- France: 83.0 years
- Cyprus: 82.9 years
- Ireland: 82.9 years
- Belgium: 82.5 years
- Portugal: 82.5 years
- Iceland: 82.4 years
- Slovenia: 82.0 years
- Austria: 81.9 years
- Netherlands: 81.9 years
- Denmark: 81.8 years
- Greece: 81.8 years
- Finland: 81.6 years
- United Kingdom: 81.3 years
- Germany: 81.1 years
- Czechia: 79.9 years
- Albania: 79.6 years
- Estonia: 79.1 years
Wyoming vs Europe
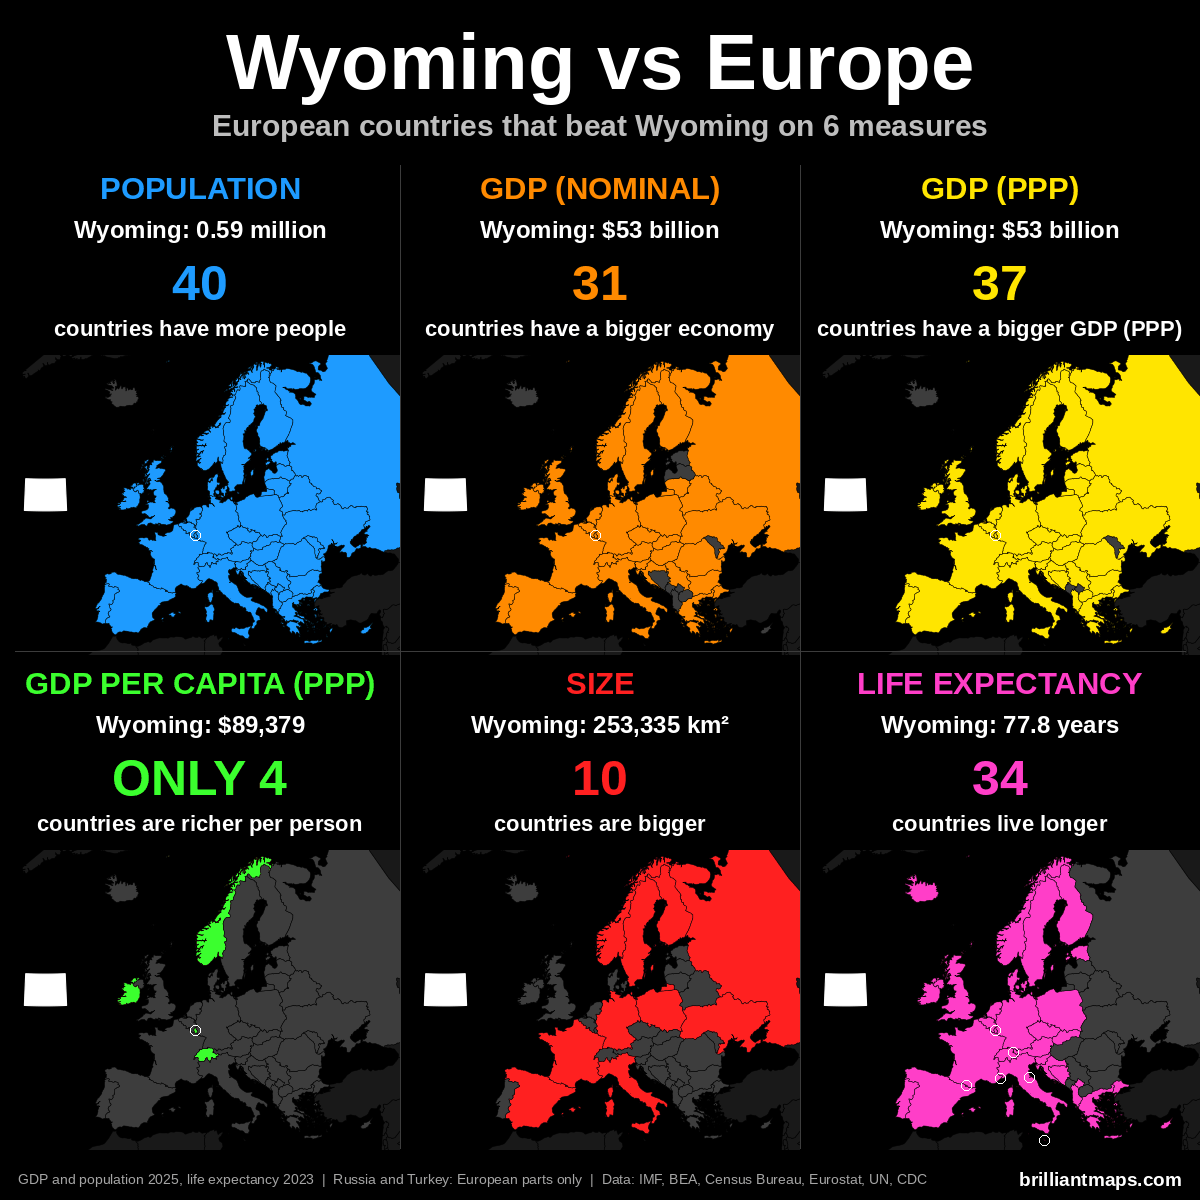
Wyoming Vs European Population
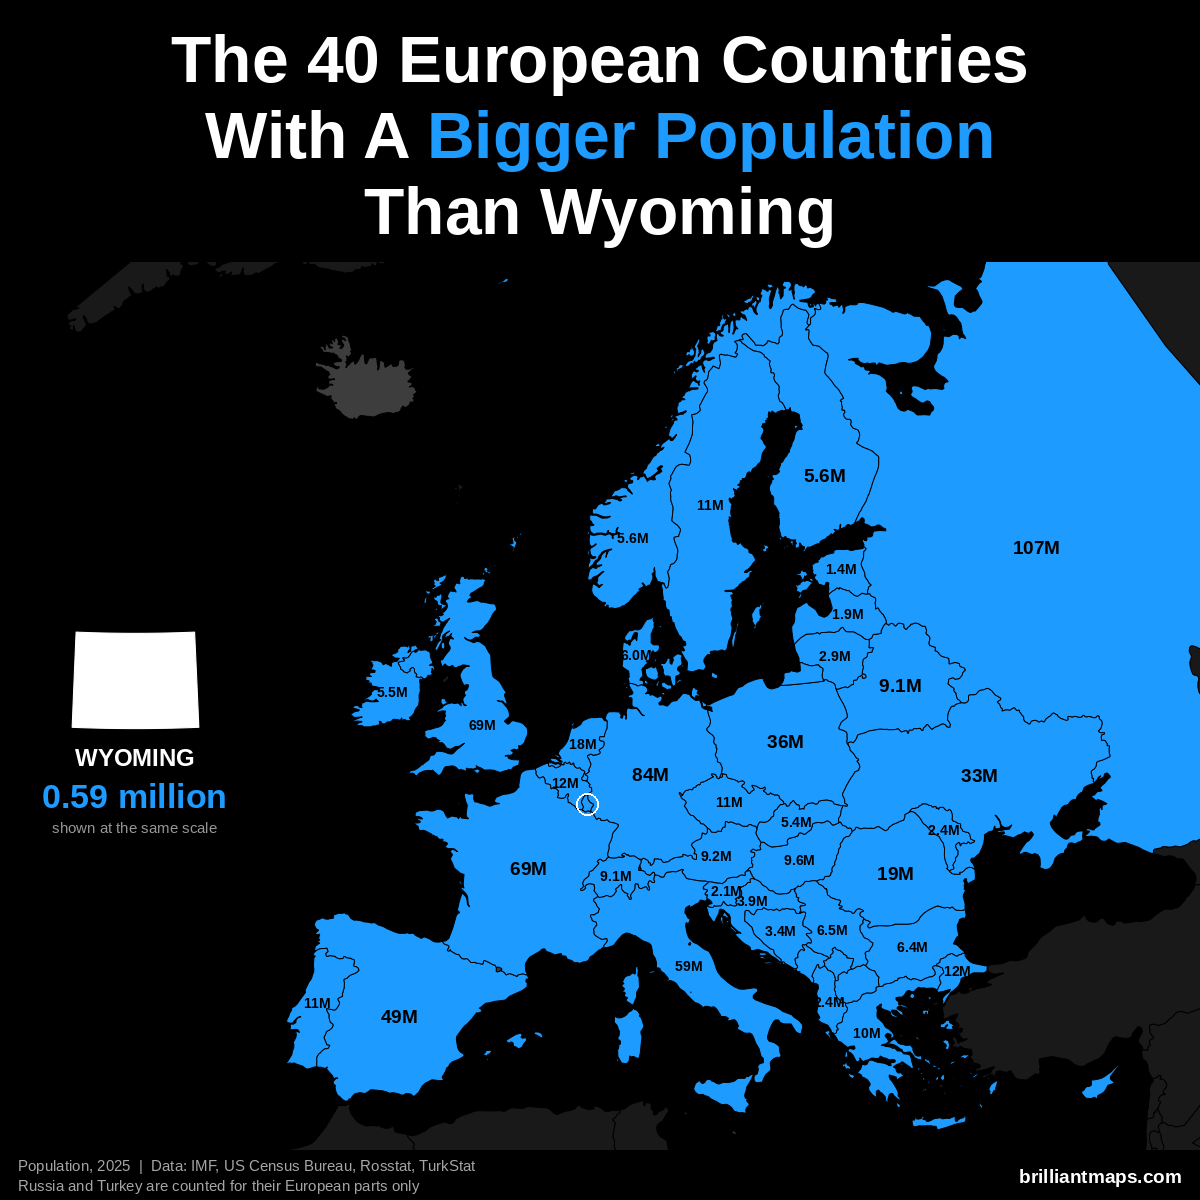
Wyoming has a population of 588,753 (2025). 40 European countries have a bigger population:
- Russia (European part): 107.0 million
- Germany: 83.5 million
- United Kingdom: 69.5 million
- France: 68.9 million
- Italy: 58.9 million
- Spain: 49.5 million
- Poland: 36.5 million
- Ukraine: 32.9 million
- Romania: 19.0 million
- Netherlands: 18.0 million
- Turkey (European part): 12.2 million
- Belgium: 11.9 million
- Portugal: 10.8 million
- Czechia: 10.8 million
- Sweden: 10.7 million
- Greece: 10.4 million
- Hungary: 9.6 million
- Austria: 9.2 million
- Belarus: 9.1 million
- Switzerland: 9.1 million
- Serbia: 6.5 million
- Bulgaria: 6.4 million
- Denmark: 6.0 million
- Norway: 5.6 million
- Finland: 5.6 million
- Ireland: 5.5 million
- Slovakia: 5.4 million
- Croatia: 3.9 million
- Bosnia and Herzegovina: 3.4 million
- Lithuania: 2.9 million
- Moldova: 2.4 million
- Albania: 2.4 million
- Slovenia: 2.1 million
- Latvia: 1.9 million
- North Macedonia: 1.8 million
- Kosovo: 1.6 million
- Estonia: 1.4 million
- Cyprus: 983,000
- Luxembourg: 682,000
- Montenegro: 624,000
Wyoming Vs European GDP (Nominal)
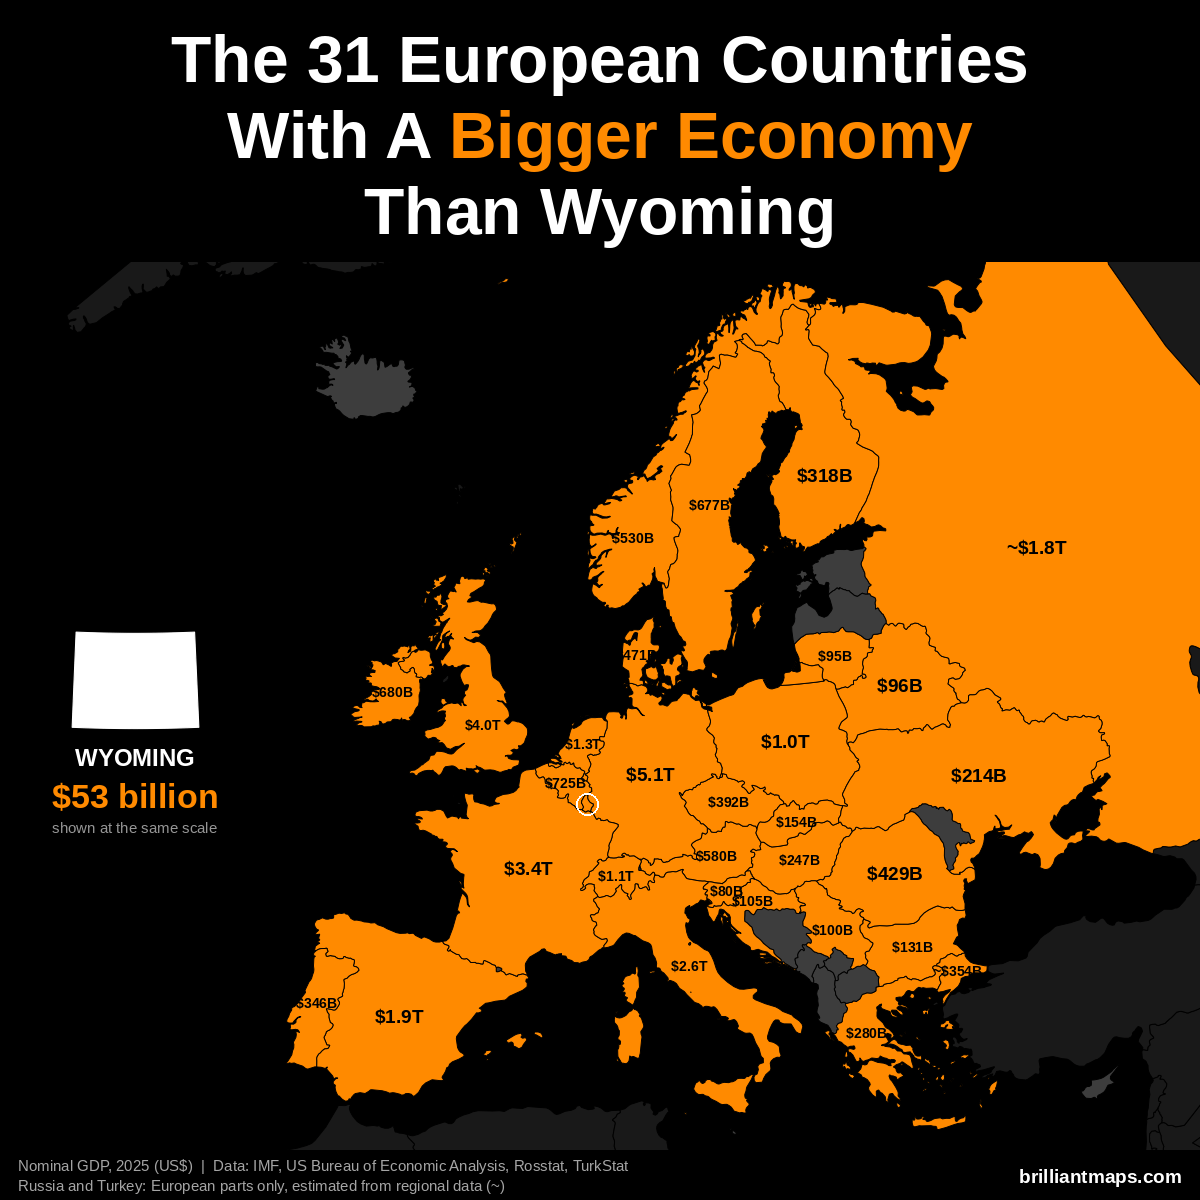
Wyoming has a nominal GDP of $53 billion (2025). 31 European countries have a bigger economy:
- Germany: $5.12 trillion
- United Kingdom: $4.01 trillion
- France: $3.38 trillion
- Italy: $2.55 trillion
- Spain: $1.91 trillion
- Russia (European part): ~$1.83 trillion
- Netherlands: $1.32 trillion
- Switzerland: $1.06 trillion
- Poland: $1.04 trillion
- Belgium: $725 billion
- Ireland: $680 billion
- Sweden: $677 billion
- Austria: $580 billion
- Norway: $530 billion
- Denmark: $471 billion
- Romania: $429 billion
- Czechia: $392 billion
- Turkey (European part): ~$354 billion
- Portugal: $346 billion
- Finland: $318 billion
- Greece: $280 billion
- Hungary: $247 billion
- Ukraine: $214 billion
- Slovakia: $154 billion
- Bulgaria: $131 billion
- Croatia: $105 billion
- Luxembourg: $101 billion
- Serbia: $100 billion
- Belarus: $96 billion
- Lithuania: $95 billion
- Slovenia: $80 billion
Wyoming Vs European GDP (PPP)
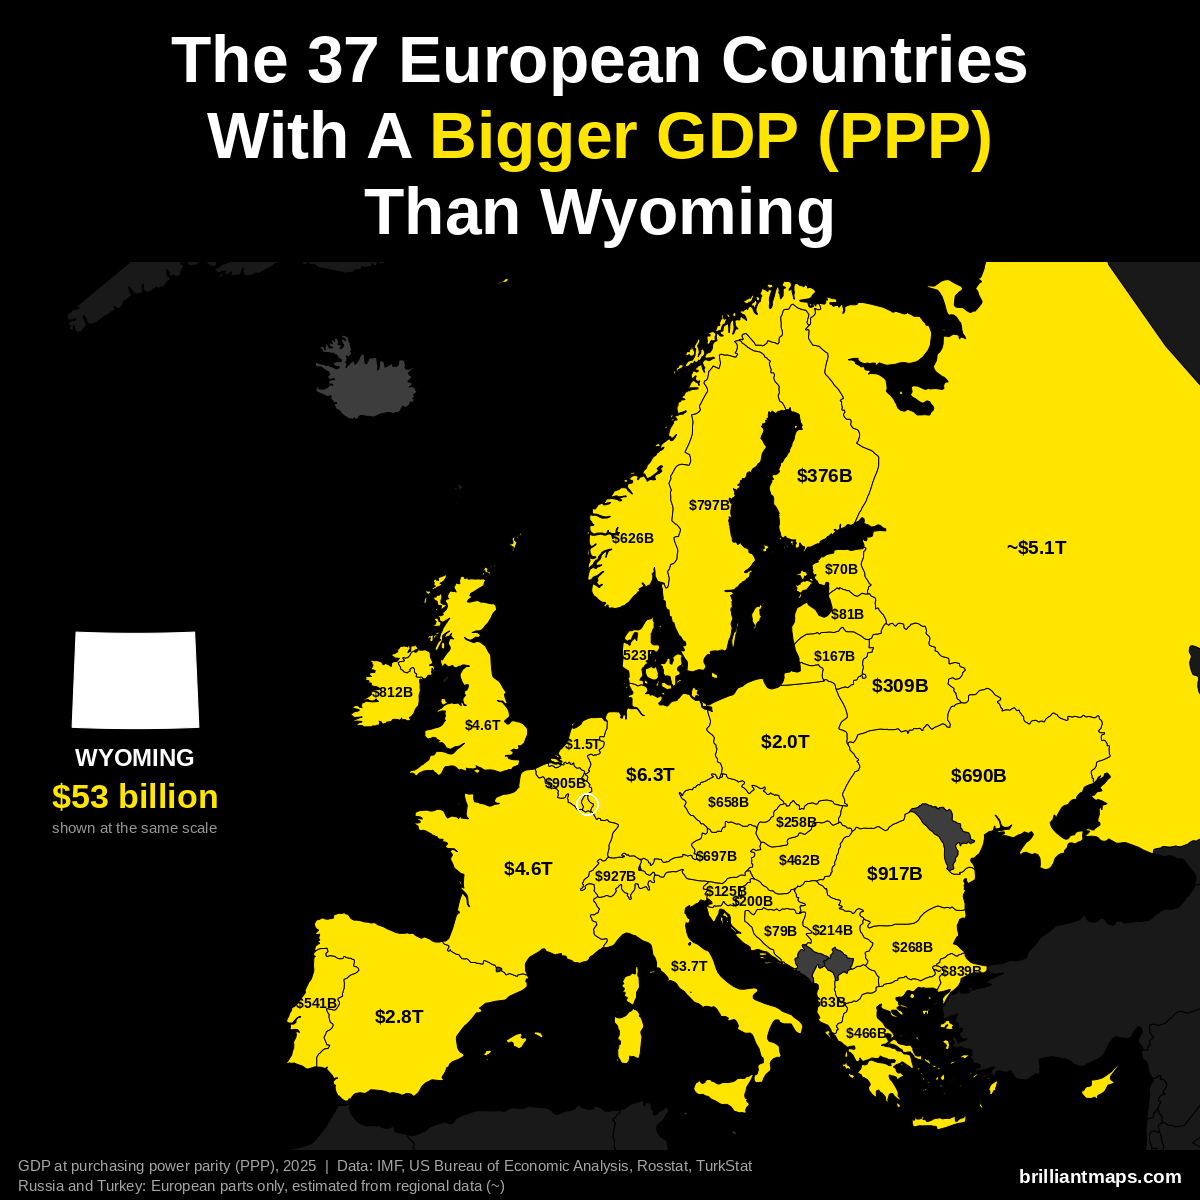
Wyoming has a GDP of $53 billion (2025). US states are already measured in the dollars PPP is based on, so the figure is the same as nominal GDP. 37 European countries have a bigger GDP at purchasing power parity:
- Germany: $6.26 trillion
- Russia (European part): ~$5.14 trillion
- France: $4.58 trillion
- United Kingdom: $4.57 trillion
- Italy: $3.74 trillion
- Spain: $2.83 trillion
- Poland: $2.04 trillion
- Netherlands: $1.52 trillion
- Switzerland: $927 billion
- Romania: $917 billion
- Belgium: $905 billion
- Turkey (European part): ~$839 billion
- Ireland: $812 billion
- Sweden: $797 billion
- Austria: $697 billion
- Ukraine: $690 billion
- Czechia: $658 billion
- Norway: $626 billion
- Portugal: $541 billion
- Denmark: $523 billion
- Greece: $466 billion
- Hungary: $462 billion
- Finland: $376 billion
- Belarus: $309 billion
- Bulgaria: $268 billion
- Slovakia: $258 billion
- Serbia: $214 billion
- Croatia: $200 billion
- Lithuania: $167 billion
- Slovenia: $125 billion
- Luxembourg: $104 billion
- Latvia: $81 billion
- Bosnia and Herzegovina: $79 billion
- Estonia: $70 billion
- Cyprus: $64 billion
- Albania: $63 billion
- North Macedonia: $54 billion
Wyoming Vs European GDP Per Capita (PPP)
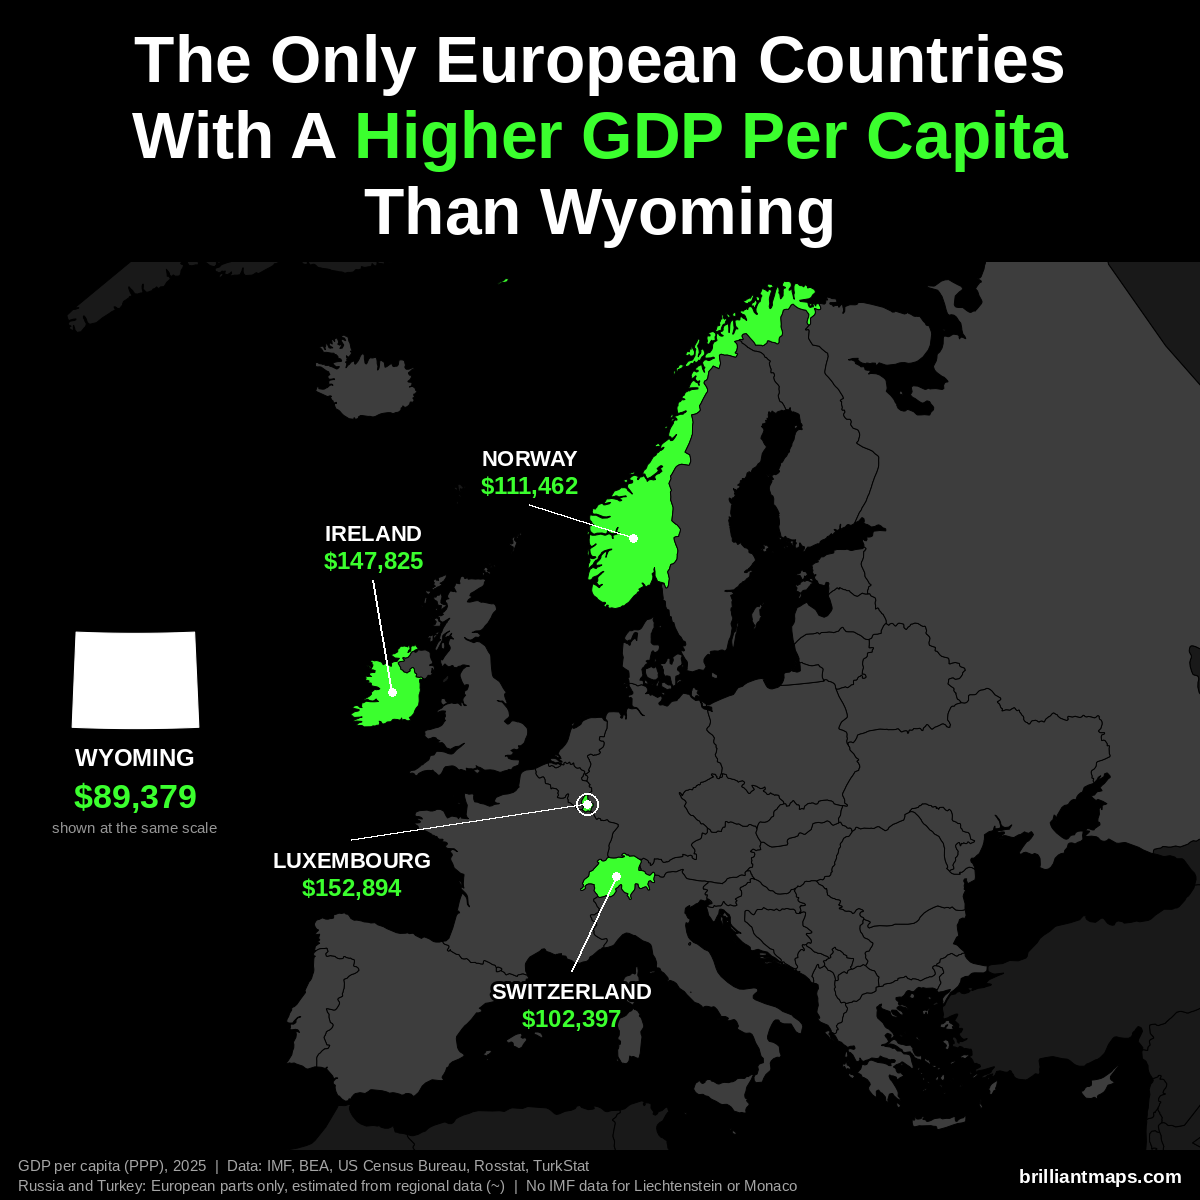
Wyoming has a GDP per capita of $89,379 (2025). Only 4 European countries have a higher GDP per capita at purchasing power parity:
- Luxembourg: $152,894
- Ireland: $147,825
- Norway: $111,462
- Switzerland: $102,397
Liechtenstein and Monaco are not covered by the IMF data and are not counted here.
Wyoming Vs European Size
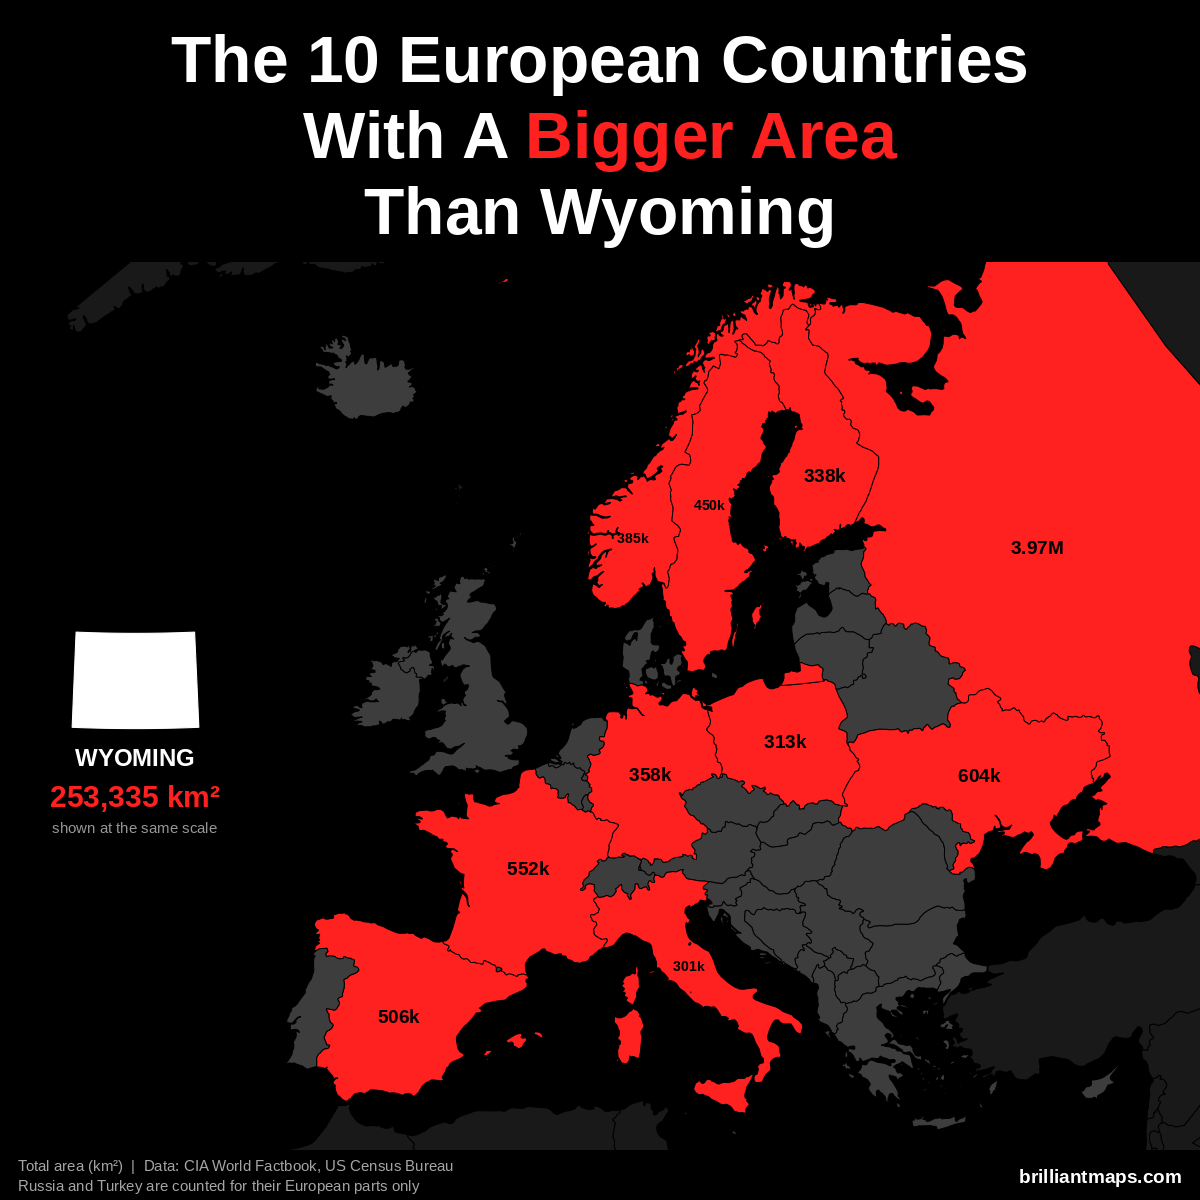
Wyoming has a total area of 253,335 km² (97,813 sq mi). 10 European countries have a bigger area:
- Russia (European part): 3,969,100 km² (1,532,477 sq mi)
- Ukraine: 603,550 km² (233,032 sq mi)
- France: 551,695 km² (213,010 sq mi)
- Spain: 505,990 km² (195,364 sq mi)
- Sweden: 450,295 km² (173,860 sq mi)
- Norway: 385,207 km² (148,729 sq mi)
- Germany: 357,588 km² (138,065 sq mi)
- Finland: 338,455 km² (130,678 sq mi)
- Poland: 312,696 km² (120,733 sq mi)
- Italy: 301,340 km² (116,348 sq mi)
Wyoming Vs European Life Expectancy
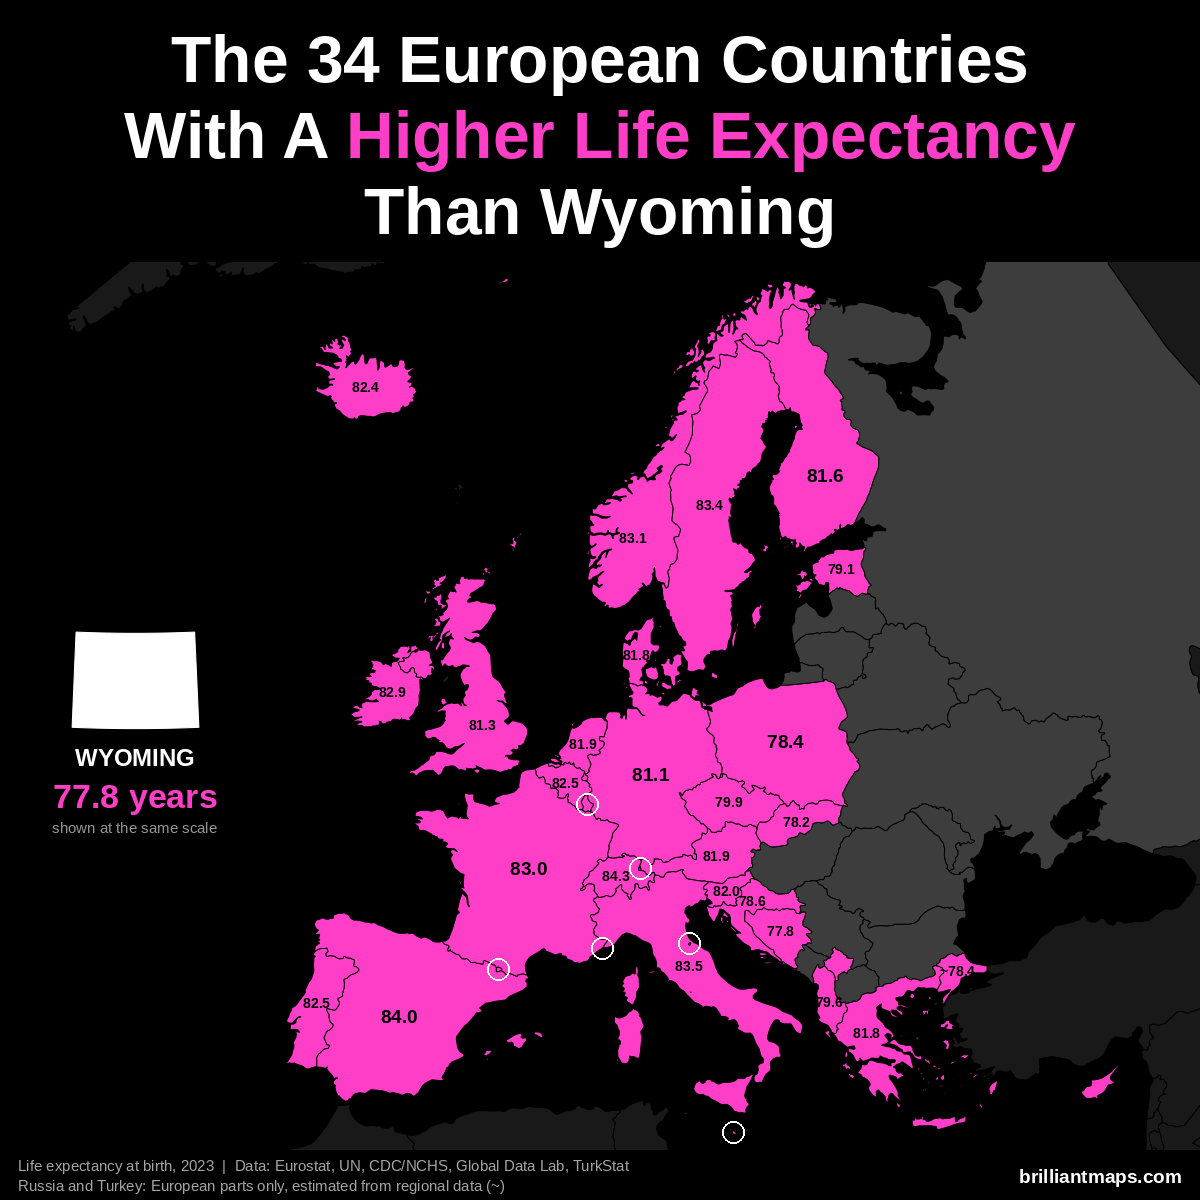
Wyoming has a life expectancy at birth of 77.8 years (2023). 34 European countries have a higher life expectancy:
- Monaco: 86.4 years
- San Marino: 85.7 years
- Liechtenstein: 84.6 years
- Switzerland: 84.3 years
- Andorra: 84.0 years
- Spain: 84.0 years
- Italy: 83.5 years
- Luxembourg: 83.4 years
- Malta: 83.4 years
- Sweden: 83.4 years
- Norway: 83.1 years
- France: 83.0 years
- Cyprus: 82.9 years
- Ireland: 82.9 years
- Belgium: 82.5 years
- Portugal: 82.5 years
- Iceland: 82.4 years
- Slovenia: 82.0 years
- Austria: 81.9 years
- Netherlands: 81.9 years
- Denmark: 81.8 years
- Greece: 81.8 years
- Finland: 81.6 years
- United Kingdom: 81.3 years
- Germany: 81.1 years
- Czechia: 79.9 years
- Albania: 79.6 years
- Estonia: 79.1 years
- Croatia: 78.6 years
- Poland: 78.4 years
- Turkey (European part): ~78.4 years
- Slovakia: 78.2 years
- Kosovo: 78.0 years
- Bosnia and Herzegovina: 77.8 years
US States vs European Countries Population
| Rank | State / Country | Type | Population (2025) |
|---|---|---|---|
| 1 | Russia (European part) | European Country | 107,000,000 |
| 2 | Germany | European Country | 83,513,000 |
| 3 | United Kingdom | European Country | 69,487,000 |
| 4 | France | European Country | 68,852,000 |
| 5 | Italy | European Country | 58,934,000 |
| 6 | Spain | European Country | 49,452,000 |
| 7 | California | US State | 39,355,309 |
| 8 | Poland | European Country | 36,497,000 |
| 9 | Ukraine | European Country | 32,863,000 |
| 10 | Texas | US State | 31,709,821 |
| 11 | Florida | US State | 23,462,518 |
| 12 | New York | US State | 20,002,427 |
| 13 | Romania | European Country | 19,043,000 |
| 14 | Netherlands | European Country | 18,044,000 |
| 15 | Pennsylvania | US State | 13,059,432 |
| 16 | Illinois | US State | 12,719,141 |
| 17 | Turkey (European part) | European Country | 12,200,000 |
| 18 | Ohio | US State | 11,900,510 |
| 19 | Belgium | European Country | 11,883,000 |
| 20 | Georgia | US State | 11,302,748 |
| 21 | North Carolina | US State | 11,197,968 |
| 22 | Portugal | European Country | 10,804,000 |
| 23 | Czechia | European Country | 10,797,000 |
| 24 | Sweden | European Country | 10,676,000 |
| 25 | Greece | European Country | 10,372,000 |
| 26 | Michigan | US State | 10,127,884 |
| 27 | Hungary | European Country | 9,560,000 |
| 28 | New Jersey | US State | 9,548,215 |
| 29 | Austria | European Country | 9,182,000 |
| 30 | Belarus | European Country | 9,083,000 |
| 31 | Switzerland | European Country | 9,051,000 |
| 32 | Virginia | US State | 8,880,107 |
| 33 | Washington | US State | 8,001,020 |
| 34 | Arizona | US State | 7,623,818 |
| 35 | Tennessee | US State | 7,315,076 |
| 36 | Massachusetts | US State | 7,154,084 |
| 37 | Indiana | US State | 6,973,333 |
| 38 | Serbia | European Country | 6,540,000 |
| 39 | Bulgaria | European Country | 6,423,000 |
| 40 | Missouri | US State | 6,270,541 |
| 41 | Maryland | US State | 6,265,347 |
| 42 | Colorado | US State | 6,012,561 |
| 43 | Denmark | European Country | 5,993,000 |
| 44 | Wisconsin | US State | 5,972,787 |
| 45 | Minnesota | US State | 5,830,405 |
| 46 | Norway | European Country | 5,618,000 |
| 47 | Finland | European Country | 5,607,000 |
| 48 | South Carolina | US State | 5,570,274 |
| 49 | Ireland | European Country | 5,496,000 |
| 50 | Slovakia | European Country | 5,419,000 |
| 51 | Alabama | US State | 5,193,088 |
| 52 | Louisiana | US State | 4,618,189 |
| 53 | Kentucky | US State | 4,606,864 |
| 54 | Oregon | US State | 4,273,586 |
| 55 | Oklahoma | US State | 4,123,288 |
| 56 | Croatia | European Country | 3,874,000 |
| 57 | Connecticut | US State | 3,688,496 |
| 58 | Utah | US State | 3,538,904 |
| 59 | Bosnia and Herzegovina | European Country | 3,445,000 |
| 60 | Nevada | US State | 3,282,188 |
| 61 | Iowa | US State | 3,238,387 |
| 62 | Arkansas | US State | 3,114,791 |
| 63 | Kansas | US State | 2,977,220 |
| 64 | Mississippi | US State | 2,954,160 |
| 65 | Lithuania | European Country | 2,891,000 |
| 66 | Moldova | European Country | 2,381,000 |
| 67 | Albania | European Country | 2,350,000 |
| 68 | Slovenia | European Country | 2,131,000 |
| 69 | New Mexico | US State | 2,125,498 |
| 70 | Idaho | US State | 2,029,733 |
| 71 | Nebraska | US State | 2,018,006 |
| 72 | Latvia | European Country | 1,861,000 |
| 73 | North Macedonia | European Country | 1,815,000 |
| 74 | West Virginia | US State | 1,766,147 |
| 75 | Kosovo | European Country | 1,597,000 |
| 76 | Hawaii | US State | 1,432,820 |
| 77 | New Hampshire | US State | 1,415,342 |
| 78 | Maine | US State | 1,414,874 |
| 79 | Estonia | European Country | 1,365,000 |
| 80 | Montana | US State | 1,144,694 |
| 81 | Rhode Island | US State | 1,114,521 |
| 82 | Delaware | US State | 1,059,952 |
| 83 | Cyprus | European Country | 983,000 |
| 84 | South Dakota | US State | 935,094 |
| 85 | North Dakota | US State | 799,358 |
| 86 | Alaska | US State | 737,270 |
| 87 | Luxembourg | European Country | 682,000 |
| 88 | Vermont | US State | 644,663 |
| 89 | Montenegro | European Country | 624,000 |
| 90 | Wyoming | US State | 588,753 |
| 91 | Malta | European Country | 574,000 |
| 92 | Iceland | European Country | 389,000 |
| 93 | Andorra | European Country | 89,000 |
| 94 | Liechtenstein | European Country | 40,000 |
| 95 | Monaco | European Country | 39,000 |
| 96 | San Marino | European Country | 34,000 |
| 97 | Vatican City | European Country | 1,000 |
US States vs European Countries GDP (Nominal)
| Rank | State / Country | Type | GDP Nominal 2025 (US$ billions) |
|---|---|---|---|
| 1 | Germany | European Country | $5,115.6 |
| 2 | California | US State | $4,250.8 |
| 3 | United Kingdom | European Country | $4,012.2 |
| 4 | France | European Country | $3,382.6 |
| 5 | Texas | US State | $2,904.4 |
| 6 | Italy | European Country | $2,550.1 |
| 7 | New York | US State | $2,467.7 |
| 8 | Spain | European Country | $1,908.6 |
| 9 | Florida | US State | $1,834.6 |
| 10 | Russia (European part) | European Country | ~$1,826.0 |
| 11 | Netherlands | European Country | $1,322.0 |
| 12 | Illinois | US State | $1,202.0 |
| 13 | Switzerland | European Country | $1,060.7 |
| 14 | Pennsylvania | US State | $1,056.4 |
| 15 | Poland | European Country | $1,040.5 |
| 16 | Ohio | US State | $966.8 |
| 17 | Georgia | US State | $924.8 |
| 18 | Washington | US State | $895.0 |
| 19 | North Carolina | US State | $893.8 |
| 20 | New Jersey | US State | $887.2 |
| 21 | Massachusetts | US State | $820.1 |
| 22 | Virginia | US State | $798.4 |
| 23 | Michigan | US State | $730.1 |
| 24 | Belgium | European Country | $725.1 |
| 25 | Ireland | European Country | $680.4 |
| 26 | Sweden | European Country | $676.5 |
| 27 | Arizona | US State | $598.2 |
| 28 | Tennessee | US State | $589.8 |
| 29 | Colorado | US State | $584.3 |
| 30 | Austria | European Country | $580.1 |
| 31 | Maryland | US State | $568.1 |
| 32 | Indiana | US State | $545.2 |
| 33 | Minnesota | US State | $531.5 |
| 34 | Norway | European Country | $530.1 |
| 35 | Wisconsin | US State | $473.0 |
| 36 | Denmark | European Country | $470.9 |
| 37 | Missouri | US State | $468.5 |
| 38 | Romania | European Country | $429.3 |
| 39 | Czechia | European Country | $391.8 |
| 40 | South Carolina | US State | $378.8 |
| 41 | Connecticut | US State | $376.5 |
| 42 | Turkey (European part) | European Country | ~$354.0 |
| 43 | Portugal | European Country | $346.4 |
| 44 | Oregon | US State | $342.9 |
| 45 | Alabama | US State | $341.2 |
| 46 | Louisiana | US State | $340.1 |
| 47 | Finland | European Country | $318.2 |
| 48 | Utah | US State | $316.0 |
| 49 | Kentucky | US State | $306.9 |
| 50 | Nevada | US State | $281.5 |
| 51 | Greece | European Country | $280.5 |
| 52 | Iowa | US State | $277.1 |
| 53 | Oklahoma | US State | $274.4 |
| 54 | Hungary | European Country | $247.1 |
| 55 | Kansas | US State | $241.4 |
| 56 | Ukraine | European Country | $214.2 |
| 57 | Arkansas | US State | $198.4 |
| 58 | Nebraska | US State | $198.1 |
| 59 | Mississippi | US State | $165.1 |
| 60 | Slovakia | European Country | $154.4 |
| 61 | New Mexico | US State | $152.8 |
| 62 | Idaho | US State | $135.6 |
| 63 | Bulgaria | European Country | $131.0 |
| 64 | New Hampshire | US State | $125.5 |
| 65 | Hawaii | US State | $124.6 |
| 66 | Delaware | US State | $117.2 |
| 67 | West Virginia | US State | $109.3 |
| 68 | Croatia | European Country | $105.0 |
| 69 | Maine | US State | $102.8 |
| 70 | Luxembourg | European Country | $101.1 |
| 71 | Serbia | European Country | $100.0 |
| 72 | Belarus | European Country | $96.0 |
| 73 | Lithuania | European Country | $95.1 |
| 74 | Rhode Island | US State | $84.0 |
| 75 | Montana | US State | $82.4 |
| 76 | North Dakota | US State | $81.9 |
| 77 | South Dakota | US State | $80.7 |
| 78 | Slovenia | European Country | $80.4 |
| 79 | Alaska | US State | $75.0 |
| 80 | Wyoming | US State | $52.6 |
| 81 | Latvia | European Country | $48.6 |
| 82 | Vermont | US State | $48.4 |
| 83 | Estonia | European Country | $47.3 |
| 84 | Cyprus | European Country | $41.2 |
| 85 | Iceland | European Country | $38.5 |
| 86 | Bosnia and Herzegovina | European Country | $33.6 |
| 87 | Albania | European Country | $30.1 |
| 88 | Malta | European Country | $27.9 |
| 89 | Moldova | European Country | $20.3 |
| 90 | North Macedonia | European Country | $19.1 |
| 91 | Kosovo | European Country | $12.4 |
| 92 | Montenegro | European Country | $9.2 |
| 93 | Andorra | European Country | $4.5 |
| 94 | San Marino | European Country | $2.3 |
US States vs European Countries GDP (PPP)
| Rank | State / Country | Type | GDP PPP 2025 (Int$ billions) |
|---|---|---|---|
| 1 | Germany | European Country | $6,255.1 |
| 2 | Russia (European part) | European Country | ~$5,137.0 |
| 3 | France | European Country | $4,582.7 |
| 4 | United Kingdom | European Country | $4,569.3 |
| 5 | California | US State | $4,250.8 |
| 6 | Italy | European Country | $3,742.8 |
| 7 | Texas | US State | $2,904.4 |
| 8 | Spain | European Country | $2,832.8 |
| 9 | New York | US State | $2,467.7 |
| 10 | Poland | European Country | $2,041.7 |
| 11 | Florida | US State | $1,834.6 |
| 12 | Netherlands | European Country | $1,523.7 |
| 13 | Illinois | US State | $1,202.0 |
| 14 | Pennsylvania | US State | $1,056.4 |
| 15 | Ohio | US State | $966.8 |
| 16 | Switzerland | European Country | $926.8 |
| 17 | Georgia | US State | $924.8 |
| 18 | Romania | European Country | $917.2 |
| 19 | Belgium | European Country | $904.8 |
| 20 | Washington | US State | $895.0 |
| 21 | North Carolina | US State | $893.8 |
| 22 | New Jersey | US State | $887.2 |
| 23 | Turkey (European part) | European Country | ~$839.0 |
| 24 | Massachusetts | US State | $820.1 |
| 25 | Ireland | European Country | $812.5 |
| 26 | Virginia | US State | $798.4 |
| 27 | Sweden | European Country | $797.0 |
| 28 | Michigan | US State | $730.1 |
| 29 | Austria | European Country | $697.5 |
| 30 | Ukraine | European Country | $690.4 |
| 31 | Czechia | European Country | $657.5 |
| 32 | Norway | European Country | $626.2 |
| 33 | Arizona | US State | $598.2 |
| 34 | Tennessee | US State | $589.8 |
| 35 | Colorado | US State | $584.3 |
| 36 | Maryland | US State | $568.1 |
| 37 | Indiana | US State | $545.2 |
| 38 | Portugal | European Country | $541.1 |
| 39 | Minnesota | US State | $531.5 |
| 40 | Denmark | European Country | $523.2 |
| 41 | Wisconsin | US State | $473.0 |
| 42 | Missouri | US State | $468.5 |
| 43 | Greece | European Country | $466.3 |
| 44 | Hungary | European Country | $462.0 |
| 45 | South Carolina | US State | $378.8 |
| 46 | Connecticut | US State | $376.5 |
| 47 | Finland | European Country | $376.2 |
| 48 | Oregon | US State | $342.9 |
| 49 | Alabama | US State | $341.2 |
| 50 | Louisiana | US State | $340.1 |
| 51 | Utah | US State | $316.0 |
| 52 | Belarus | European Country | $309.1 |
| 53 | Kentucky | US State | $306.9 |
| 54 | Nevada | US State | $281.5 |
| 55 | Iowa | US State | $277.1 |
| 56 | Oklahoma | US State | $274.4 |
| 57 | Bulgaria | European Country | $268.0 |
| 58 | Slovakia | European Country | $258.3 |
| 59 | Kansas | US State | $241.4 |
| 60 | Serbia | European Country | $213.9 |
| 61 | Croatia | European Country | $200.3 |
| 62 | Arkansas | US State | $198.4 |
| 63 | Nebraska | US State | $198.1 |
| 64 | Lithuania | European Country | $167.2 |
| 65 | Mississippi | US State | $165.1 |
| 66 | New Mexico | US State | $152.8 |
| 67 | Idaho | US State | $135.6 |
| 68 | New Hampshire | US State | $125.5 |
| 69 | Hawaii | US State | $124.6 |
| 69 | Slovenia | European Country | $124.6 |
| 71 | Delaware | US State | $117.2 |
| 72 | West Virginia | US State | $109.3 |
| 73 | Luxembourg | European Country | $104.3 |
| 74 | Maine | US State | $102.8 |
| 75 | Rhode Island | US State | $84.0 |
| 76 | Montana | US State | $82.4 |
| 77 | North Dakota | US State | $81.9 |
| 78 | Latvia | European Country | $80.9 |
| 79 | South Dakota | US State | $80.7 |
| 80 | Bosnia and Herzegovina | European Country | $79.1 |
| 81 | Alaska | US State | $75.0 |
| 82 | Estonia | European Country | $69.5 |
| 83 | Cyprus | European Country | $63.9 |
| 84 | Albania | European Country | $63.2 |
| 85 | North Macedonia | European Country | $54.0 |
| 86 | Wyoming | US State | $52.6 |
| 87 | Vermont | US State | $48.4 |
| 88 | Moldova | European Country | $47.2 |
| 89 | Malta | European Country | $43.5 |
| 90 | Kosovo | European Country | $32.2 |
| 91 | Iceland | European Country | $31.5 |
| 92 | Montenegro | European Country | $21.4 |
| 93 | Andorra | European Country | $6.6 |
| 94 | San Marino | European Country | $2.9 |
US States vs European Countries GDP Per Capita (PPP)
| Rank | State / Country | Type | GDP Per Capita PPP 2025 |
|---|---|---|---|
| 1 | Luxembourg | European Country | $152,894 |
| 2 | Ireland | European Country | $147,825 |
| 3 | New York | US State | $123,369 |
| 4 | Massachusetts | US State | $114,635 |
| 5 | Washington | US State | $111,860 |
| 6 | Norway | European Country | $111,462 |
| 7 | Delaware | US State | $110,588 |
| 8 | California | US State | $108,012 |
| 9 | North Dakota | US State | $102,436 |
| 10 | Switzerland | European Country | $102,397 |
| 11 | Connecticut | US State | $102,062 |
| 12 | Alaska | US State | $101,742 |
| 13 | Nebraska | US State | $98,153 |
| 14 | Colorado | US State | $97,184 |
| 15 | Illinois | US State | $94,503 |
| 16 | New Jersey | US State | $92,915 |
| 17 | Texas | US State | $91,594 |
| 18 | Minnesota | US State | $91,154 |
| 19 | Maryland | US State | $90,680 |
| 20 | Virginia | US State | $89,914 |
| 21 | Wyoming | US State | $89,379 |
| 22 | Utah | US State | $89,286 |
| 23 | New Hampshire | US State | $88,688 |
| 24 | Denmark | European Country | $87,303 |
| 25 | Hawaii | US State | $86,967 |
| 26 | South Dakota | US State | $86,248 |
| 27 | Nevada | US State | $85,752 |
| 28 | Iowa | US State | $85,570 |
| 29 | Netherlands | European Country | $84,445 |
| 30 | San Marino | European Country | $83,838 |
| 31 | Georgia | US State | $81,823 |
| 32 | Ohio | US State | $81,239 |
| 33 | Kansas | US State | $81,075 |
| 34 | Iceland | European Country | $80,915 |
| 35 | Pennsylvania | US State | $80,895 |
| 36 | Tennessee | US State | $80,630 |
| 37 | Oregon | US State | $80,225 |
| 38 | North Carolina | US State | $79,815 |
| 39 | Wisconsin | US State | $79,199 |
| 40 | Arizona | US State | $78,463 |
| 41 | Florida | US State | $78,195 |
| 42 | Indiana | US State | $78,188 |
| 43 | Belgium | European Country | $76,136 |
| 44 | Austria | European Country | $75,965 |
| 45 | Malta | European Country | $75,687 |
| 46 | Rhode Island | US State | $75,329 |
| 47 | Vermont | US State | $75,001 |
| 48 | Germany | European Country | $74,901 |
| 49 | Missouri | US State | $74,710 |
| 50 | Sweden | European Country | $74,651 |
| 51 | Andorra | European Country | $74,059 |
| 52 | Louisiana | US State | $73,639 |
| 53 | Maine | US State | $72,688 |
| 54 | Michigan | US State | $72,085 |
| 55 | Montana | US State | $71,947 |
| 56 | New Mexico | US State | $71,879 |
| 57 | Turkey (European part) | European Country | ~$68,800 |
| 58 | South Carolina | US State | $68,009 |
| 59 | Finland | European Country | $67,097 |
| 60 | Idaho | US State | $66,784 |
| 61 | Kentucky | US State | $66,617 |
| 62 | France | European Country | $66,559 |
| 63 | Oklahoma | US State | $66,554 |
| 64 | United Kingdom | European Country | $65,758 |
| 65 | Alabama | US State | $65,694 |
| 66 | Cyprus | European Country | $65,038 |
| 67 | Arkansas | US State | $63,703 |
| 68 | Italy | European Country | $63,508 |
| 69 | West Virginia | US State | $61,873 |
| 70 | Czechia | European Country | $60,899 |
| 71 | Slovenia | European Country | $58,465 |
| 72 | Lithuania | European Country | $57,826 |
| 73 | Spain | European Country | $57,282 |
| 74 | Poland | European Country | $55,940 |
| 75 | Mississippi | US State | $55,877 |
| 76 | Croatia | European Country | $51,693 |
| 77 | Estonia | European Country | $50,934 |
| 78 | Portugal | European Country | $50,083 |
| 79 | Hungary | European Country | $48,326 |
| 80 | Romania | European Country | $48,166 |
| 81 | Russia (European part) | European Country | ~$47,750 |
| 82 | Slovakia | European Country | $47,661 |
| 83 | Greece | European Country | $44,960 |
| 84 | Latvia | European Country | $43,489 |
| 85 | Bulgaria | European Country | $41,727 |
| 86 | Montenegro | European Country | $34,360 |
| 87 | Belarus | European Country | $34,031 |
| 88 | Serbia | European Country | $32,708 |
| 89 | North Macedonia | European Country | $29,759 |
| 90 | Albania | European Country | $26,888 |
| 91 | Bosnia and Herzegovina | European Country | $22,972 |
| 92 | Ukraine | European Country | $21,007 |
| 93 | Kosovo | European Country | $20,141 |
| 94 | Moldova | European Country | $19,837 |
US States vs European Countries Size
| Rank | State / Country | Type | Area (km2) | Area (sq mi) |
|---|---|---|---|---|
| 1 | Russia (European part) | European Country | 3,969,100 | 1,532,477 |
| 2 | Alaska | US State | 1,723,337 | 665,384 |
| 3 | Texas | US State | 695,662 | 268,596 |
| 4 | Ukraine | European Country | 603,550 | 233,032 |
| 5 | France | European Country | 551,695 | 213,010 |
| 6 | Spain | European Country | 505,990 | 195,364 |
| 7 | Sweden | European Country | 450,295 | 173,860 |
| 8 | California | US State | 423,967 | 163,694 |
| 9 | Norway | European Country | 385,207 | 148,729 |
| 10 | Montana | US State | 380,831 | 147,040 |
| 11 | Germany | European Country | 357,588 | 138,065 |
| 12 | Finland | European Country | 338,455 | 130,678 |
| 13 | New Mexico | US State | 314,917 | 121,590 |
| 14 | Poland | European Country | 312,696 | 120,733 |
| 15 | Italy | European Country | 301,340 | 116,348 |
| 16 | Arizona | US State | 295,234 | 113,990 |
| 17 | Nevada | US State | 286,380 | 110,572 |
| 18 | Colorado | US State | 269,601 | 104,093 |
| 19 | Oregon | US State | 254,799 | 98,378 |
| 20 | Wyoming | US State | 253,335 | 97,813 |
| 21 | Michigan | US State | 250,487 | 96,714 |
| 22 | United Kingdom | European Country | 243,610 | 94,058 |
| 23 | Romania | European Country | 238,397 | 92,046 |
| 24 | Minnesota | US State | 225,163 | 86,936 |
| 25 | Utah | US State | 219,882 | 84,897 |
| 26 | Idaho | US State | 216,443 | 83,569 |
| 27 | Kansas | US State | 213,100 | 82,278 |
| 28 | Belarus | European Country | 207,600 | 80,155 |
| 29 | Nebraska | US State | 200,330 | 77,348 |
| 30 | South Dakota | US State | 199,729 | 77,116 |
| 31 | Washington | US State | 184,661 | 71,298 |
| 32 | North Dakota | US State | 183,108 | 70,698 |
| 33 | Oklahoma | US State | 181,037 | 69,899 |
| 34 | Missouri | US State | 180,540 | 69,707 |
| 35 | Florida | US State | 170,312 | 65,758 |
| 36 | Wisconsin | US State | 169,635 | 65,496 |
| 37 | Georgia | US State | 153,910 | 59,425 |
| 38 | Illinois | US State | 149,995 | 57,913 |
| 39 | Iowa | US State | 145,746 | 56,273 |
| 40 | New York | US State | 141,297 | 54,555 |
| 41 | North Carolina | US State | 139,391 | 53,819 |
| 42 | Arkansas | US State | 137,732 | 53,179 |
| 43 | Alabama | US State | 135,767 | 52,420 |
| 44 | Louisiana | US State | 135,659 | 52,378 |
| 45 | Greece | European Country | 131,957 | 50,949 |
| 46 | Mississippi | US State | 125,438 | 48,432 |
| 47 | Pennsylvania | US State | 119,280 | 46,054 |
| 48 | Ohio | US State | 116,098 | 44,826 |
| 49 | Bulgaria | European Country | 110,994 | 42,855 |
| 50 | Virginia | US State | 110,787 | 42,775 |
| 51 | Tennessee | US State | 109,153 | 42,144 |
| 52 | Kentucky | US State | 104,656 | 40,408 |
| 53 | Iceland | European Country | 103,000 | 39,768 |
| 54 | Indiana | US State | 94,326 | 36,419 |
| 55 | Hungary | European Country | 93,028 | 35,918 |
| 56 | Portugal | European Country | 92,212 | 35,603 |
| 57 | Maine | US State | 91,633 | 35,380 |
| 58 | Austria | European Country | 83,871 | 32,383 |
| 59 | South Carolina | US State | 82,933 | 32,021 |
| 60 | Czechia | European Country | 78,867 | 30,451 |
| 61 | Serbia | European Country | 77,474 | 29,913 |
| 62 | Ireland | European Country | 70,273 | 27,133 |
| 63 | Lithuania | European Country | 65,300 | 25,212 |
| 64 | Latvia | European Country | 64,589 | 24,938 |
| 65 | West Virginia | US State | 62,756 | 24,230 |
| 66 | Croatia | European Country | 56,594 | 21,851 |
| 67 | Bosnia and Herzegovina | European Country | 51,197 | 19,767 |
| 68 | Slovakia | European Country | 49,035 | 18,933 |
| 69 | Estonia | European Country | 45,339 | 17,505 |
| 70 | Denmark | European Country | 43,094 | 16,639 |
| 71 | Netherlands | European Country | 41,850 | 16,158 |
| 72 | Switzerland | European Country | 41,285 | 15,940 |
| 73 | Moldova | European Country | 33,846 | 13,068 |
| 74 | Maryland | US State | 32,131 | 12,406 |
| 75 | Belgium | European Country | 30,528 | 11,787 |
| 76 | Albania | European Country | 28,748 | 11,100 |
| 77 | Hawaii | US State | 28,313 | 10,932 |
| 78 | Massachusetts | US State | 27,336 | 10,554 |
| 79 | North Macedonia | European Country | 25,713 | 9,928 |
| 80 | Vermont | US State | 24,906 | 9,616 |
| 81 | New Hampshire | US State | 24,214 | 9,349 |
| 82 | Turkey (European part) | European Country | 23,764 | 9,175 |
| 83 | New Jersey | US State | 22,591 | 8,722 |
| 84 | Slovenia | European Country | 20,273 | 7,827 |
| 85 | Connecticut | US State | 14,357 | 5,543 |
| 86 | Montenegro | European Country | 13,812 | 5,333 |
| 87 | Kosovo | European Country | 10,887 | 4,203 |
| 88 | Cyprus | European Country | 9,251 | 3,572 |
| 89 | Delaware | US State | 6,446 | 2,489 |
| 90 | Rhode Island | US State | 4,001 | 1,545 |
| 91 | Luxembourg | European Country | 2,586 | 998 |
| 92 | Andorra | European Country | 468 | 181 |
| 93 | Malta | European Country | 316 | 122 |
| 94 | Liechtenstein | European Country | 160 | 62 |
| 95 | San Marino | European Country | 61 | 24 |
| 96 | Monaco | European Country | 2.08 | 0.80 |
| 97 | Vatican City | European Country | 0.49 | 0.19 |
US States vs European Countries Life Expectancy
| Rank | State / Country | Type | Life Expectancy 2023 (years) |
|---|---|---|---|
| 1 | Monaco | European Country | 86.4 |
| 2 | San Marino | European Country | 85.7 |
| 3 | Liechtenstein | European Country | 84.6 |
| 4 | Switzerland | European Country | 84.3 |
| 5 | Andorra | European Country | 84.0 |
| 5 | Spain | European Country | 84.0 |
| 7 | Italy | European Country | 83.5 |
| 8 | Luxembourg | European Country | 83.4 |
| 8 | Malta | European Country | 83.4 |
| 8 | Sweden | European Country | 83.4 |
| 11 | Norway | European Country | 83.1 |
| 12 | France | European Country | 83.0 |
| 13 | Cyprus | European Country | 82.9 |
| 13 | Ireland | European Country | 82.9 |
| 15 | Belgium | European Country | 82.5 |
| 15 | Portugal | European Country | 82.5 |
| 17 | Iceland | European Country | 82.4 |
| 18 | Slovenia | European Country | 82.0 |
| 19 | Austria | European Country | 81.9 |
| 19 | Netherlands | European Country | 81.9 |
| 21 | Denmark | European Country | 81.8 |
| 21 | Greece | European Country | 81.8 |
| 23 | Finland | European Country | 81.6 |
| 24 | United Kingdom | European Country | 81.3 |
| 25 | Germany | European Country | 81.1 |
| 26 | Hawaii | US State | 80.6 |
| 26 | New Jersey | US State | 80.6 |
| 28 | Massachusetts | US State | 80.5 |
| 29 | Connecticut | US State | 80.4 |
| 29 | New York | US State | 80.4 |
| 31 | California | US State | 80.2 |
| 32 | Minnesota | US State | 80.0 |
| 33 | Czechia | European Country | 79.9 |
| 34 | Rhode Island | US State | 79.7 |
| 35 | Albania | European Country | 79.6 |
| 35 | Utah | US State | 79.6 |
| 37 | New Hampshire | US State | 79.5 |
| 38 | Colorado | US State | 79.3 |
| 39 | Idaho | US State | 79.2 |
| 40 | Estonia | European Country | 79.1 |
| 40 | Texas | US State | 79.1 |
| 42 | Vermont | US State | 79.0 |
| 42 | Washington | US State | 79.0 |
| 44 | Wisconsin | US State | 78.9 |
| 45 | Florida | US State | 78.8 |
| 45 | North Dakota | US State | 78.8 |
| 47 | Maryland | US State | 78.7 |
| 47 | Nebraska | US State | 78.7 |
| 49 | Croatia | European Country | 78.6 |
| 49 | Illinois | US State | 78.6 |
| 49 | Iowa | US State | 78.6 |
| 52 | Virginia | US State | 78.5 |
| 53 | Poland | European Country | 78.4 |
| 53 | South Dakota | US State | 78.4 |
| 55 | Turkey (European part) | European Country | ~78.4 |
| 56 | Montana | US State | 78.3 |
| 56 | Pennsylvania | US State | 78.3 |
| 58 | Oregon | US State | 78.2 |
| 58 | Slovakia | European Country | 78.2 |
| 60 | Kosovo | European Country | 78.0 |
| 61 | Arizona | US State | 77.9 |
| 62 | Bosnia and Herzegovina | European Country | 77.8 |
| 62 | Maine | US State | 77.8 |
| 62 | Michigan | US State | 77.8 |
| 62 | Wyoming | US State | 77.8 |
| 66 | Delaware | US State | 77.7 |
| 67 | Kansas | US State | 77.6 |
| 67 | Lithuania | European Country | 77.6 |
| 67 | Montenegro | European Country | 77.6 |
| 70 | North Macedonia | European Country | 77.4 |
| 71 | Nevada | US State | 77.3 |
| 72 | Georgia | US State | 76.9 |
| 73 | North Carolina | US State | 76.8 |
| 73 | Ohio | US State | 76.8 |
| 75 | Hungary | European Country | 76.7 |
| 76 | Indiana | US State | 76.6 |
| 77 | Missouri | US State | 76.5 |
| 78 | Romania | European Country | 76.4 |
| 79 | Alaska | US State | 76.3 |
| 80 | Serbia | European Country | 76.2 |
| 80 | South Carolina | US State | 76.2 |
| 82 | Bulgaria | European Country | 75.8 |
| 83 | New Mexico | US State | 75.7 |
| 84 | Latvia | European Country | 75.6 |
| 85 | Oklahoma | US State | 75.1 |
| 86 | Tennessee | US State | 74.9 |
| 87 | Arkansas | US State | 74.8 |
| 87 | Louisiana | US State | 74.8 |
| 89 | Alabama | US State | 74.6 |
| 89 | Kentucky | US State | 74.6 |
| 91 | Belarus | European Country | 74.4 |
| 92 | West Virginia | US State | 73.9 |
| 93 | Mississippi | US State | 73.8 |
| 94 | Russia (European part) | European Country | ~73.8 |
| 95 | Ukraine | European Country | 73.4 |
| 96 | Moldova | European Country | 71.9 |
Notes And Sources
- US states: population from the US Census Bureau (July 2025 estimates), GDP from the US Bureau of Economic Analysis (2025), life expectancy from the CDC National Center for Health Statistics (2023), total area including water from the US Census Bureau.
- European countries: population and GDP from the IMF World Economic Outlook (2025), life expectancy from Eurostat and the UN World Population Prospects (2023).
- Russia and Turkey are counted for their European parts only. Their GDP and life expectancy figures are estimates based on regional data from Rosstat, TurkStat and Global Data Lab.
- A country level with a state at the precision shown is not counted as higher.




Leave a Reply