
The map above compares non-inflation adjusted house prices by state in 2000 vs House prices in December 2025 according to Zillow’s All Home Index.
In 2000, not a single state had average home prices above $200k, the closest was Massachusetts at $192,616.
However, by 2026 only 2 states had average home prices below $200k: Mississippi and West Virginia.
Here’s the data below, including raw numbers, inflation adjusted numbers and 2026 numbers:
| State | 2000 Home Prices | 2000 Inflation Adjusted Home Prices | 2026 Home Prices | % Increase Above Inflation | Absolute $ Difference Above Infaltion |
|---|---|---|---|---|---|
| Massachusetts | $192,616 | $369,823 | $636,412 | 72.09% | $266,589 |
| Hawaii | $191,347 | $367,386 | $816,383 | 122.21% | $448,997 |
| California | $185,997 | $357,115 | $755,330 | 111.51% | $398,216 |
| Colorado | $174,330 | $334,714 | $529,754 | 58.27% | $195,040 |
| Washington | $171,787 | $329,832 | $585,576 | 77.54% | $255,744 |
| New Jersey | $167,942 | $322,448 | $556,462 | 72.57% | $234,013 |
| Utah | $167,066 | $320,767 | $528,078 | 64.63% | $207,311 |
| Connecticut | $159,608 | $306,447 | $422,555 | 37.89% | $116,108 |
| District of Columbia | $159,126 | $305,523 | $572,181 | 87.28% | $266,658 |
| Nevada | $153,599 | $294,910 | $440,084 | 49.23% | $145,174 |
| New York | $150,248 | $288,476 | $498,383 | 72.76% | $209,907 |
| Maryland | $150,007 | $288,013 | $420,793 | 46.10% | $132,780 |
| Oregon | $149,058 | $286,191 | $487,843 | 70.46% | $201,652 |
| Delaware | $146,266 | $280,831 | $394,014 | 40.30% | $113,183 |
| Arizona | $134,747 | $258,714 | $417,121 | 61.23% | $158,407 |
| Alaska | $134,062 | $257,399 | $377,398 | 46.62% | $119,998 |
| New Hampshire | $130,549 | $250,654 | $490,462 | 95.67% | $239,808 |
| Rhode Island | $130,223 | $250,028 | $485,345 | 94.12% | $235,317 |
| North Carolina | $127,522 | $244,843 | $327,663 | 33.83% | $82,819 |
| Illinois | $125,450 | $240,864 | $277,191 | 15.08% | $36,326 |
| Georgia | $124,735 | $239,490 | $325,887 | 36.07% | $86,396 |
| Virginia | $122,624 | $235,439 | $400,622 | 70.16% | $165,183 |
| Idaho | $122,253 | $234,725 | $463,123 | 97.30% | $228,398 |
| Minnesota | $121,911 | $234,069 | $335,820 | 43.47% | $101,751 |
| Wisconsin | $117,206 | $225,035 | $316,876 | 40.81% | $91,841 |
| Nebraska | $113,351 | $217,633 | $267,254 | 22.80% | $49,621 |
| Michigan | $113,163 | $217,273 | $249,916 | 15.02% | $32,644 |
| South Carolina | $113,101 | $217,154 | $296,981 | 36.76% | $79,827 |
| Vermont | $112,842 | $216,657 | $379,669 | 75.24% | $163,012 |
| Texas | $111,702 | $214,468 | $294,444 | 37.29% | $79,975 |
| Tennessee | $110,884 | $212,897 | $323,808 | 52.10% | $110,911 |
| Louisiana | $108,003 | $207,366 | $206,193 | -0.57% | $-1,172 |
| Florida | $106,805 | $205,065 | $369,996 | 80.43% | $164,931 |
| South Dakota | $105,757 | $203,053 | $308,011 | 51.69% | $104,958 |
| Maine | $104,677 | $200,980 | $395,931 | 97.00% | $194,951 |
| Ohio | $102,642 | $197,074 | $234,363 | 18.92% | $37,290 |
| Alabama | $98,982 | $190,046 | $229,368 | 20.69% | $39,322 |
| Pennsylvania | $97,577 | $187,347 | $275,155 | 46.87% | $87,808 |
| Indiana | $96,139 | $184,586 | $246,452 | 33.52% | $61,865 |
| Missouri | $95,775 | $183,888 | $254,019 | 38.14% | $70,130 |
| Iowa | $88,959 | $170,801 | $225,028 | 31.75% | $54,228 |
| Mississippi | $88,614 | $170,138 | $186,256 | 9.47% | $16,118 |
| Arkansas | $88,332 | $169,597 | $216,491 | 27.65% | $46,894 |
| Kentucky | $87,943 | $168,851 | $224,082 | 32.71% | $55,231 |
| Kansas | $87,360 | $167,731 | $236,285 | 40.87% | $68,554 |
| Oklahoma | $82,688 | $158,760 | $214,507 | 35.11% | $55,746 |
| West Virginia | $72,434 | $139,074 | $168,655 | 21.27% | $29,582 |
| Montana | No Data | No Data | $451,657 | No Data | No Data |
| Wyoming | No Data | No Data | $354,219 | No Data | No Data |
| New Mexico | No Data | No Data | $306,813 | No Data | No Data |
| North Dakota | No Data | No Data | $276,906 | No Data | No Data |
Interestingly, despite the fact that Mississippi and West Virginia are the cheapest states, even they have had price increases over and above inflation. Louisiana is the only state where the increase in house prices was below inflation.

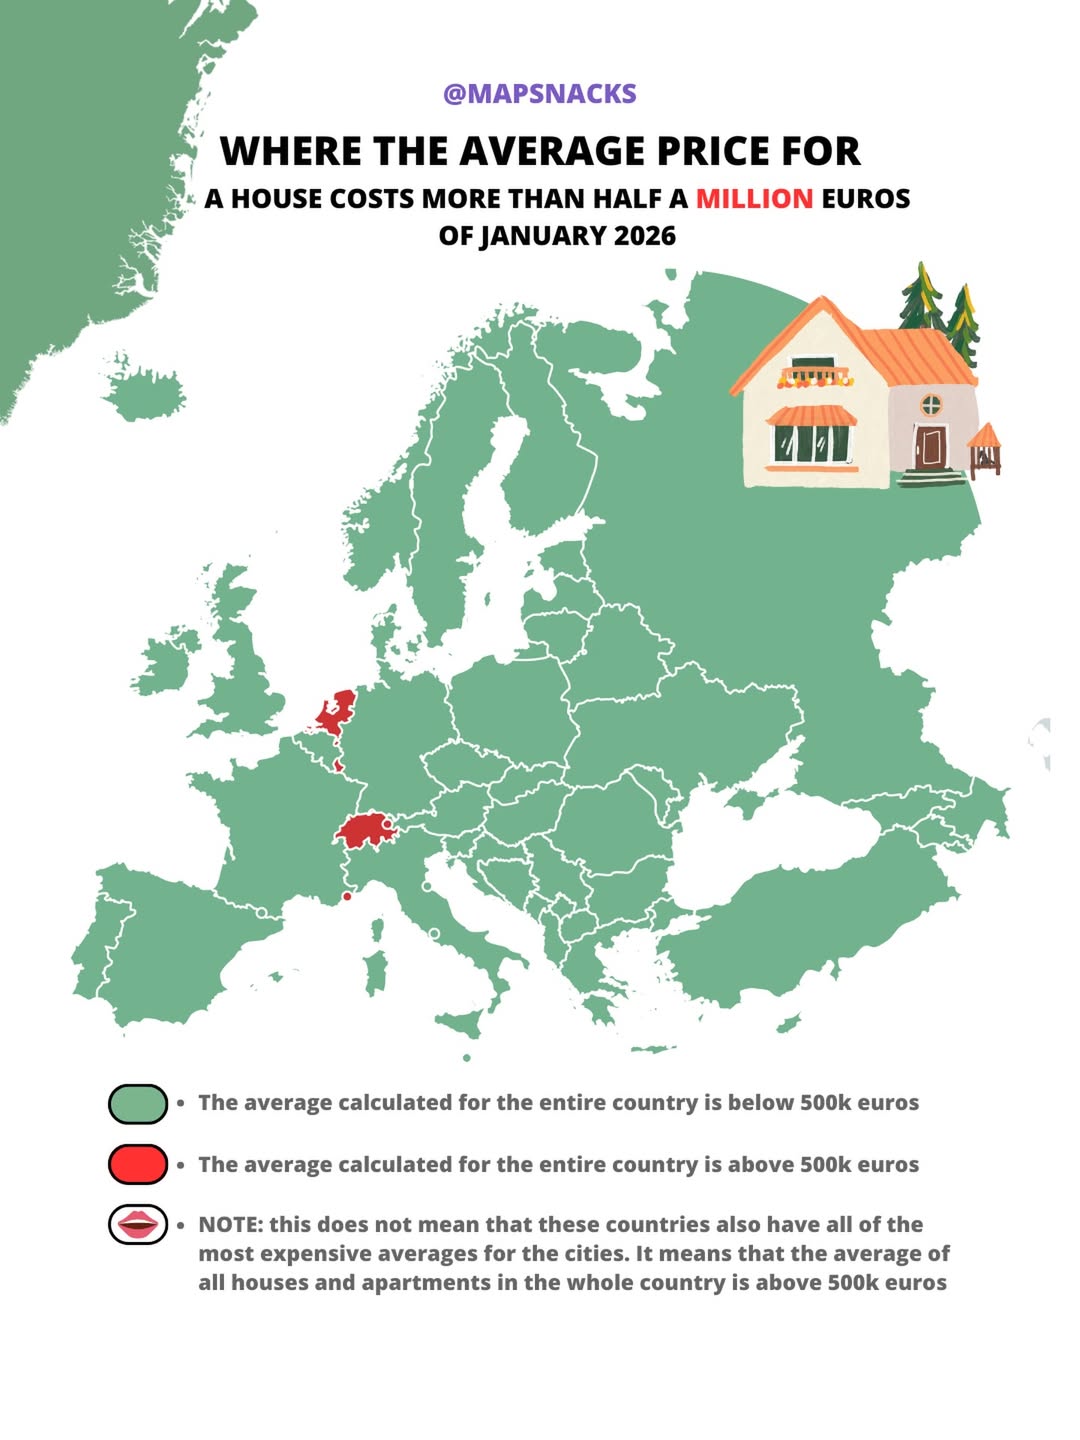
and finally as point of comparison here are the European countries where the average house price is above €500k EUR ($593k USD).


Chad says
I really really want to share the map image, but due to its proportions, the top header gets cut off when posting to Facebook. I might also suggest having the top map all in green and so they share the same heading for an apples-to-apples comparison. This would also make it easier for sharing.