
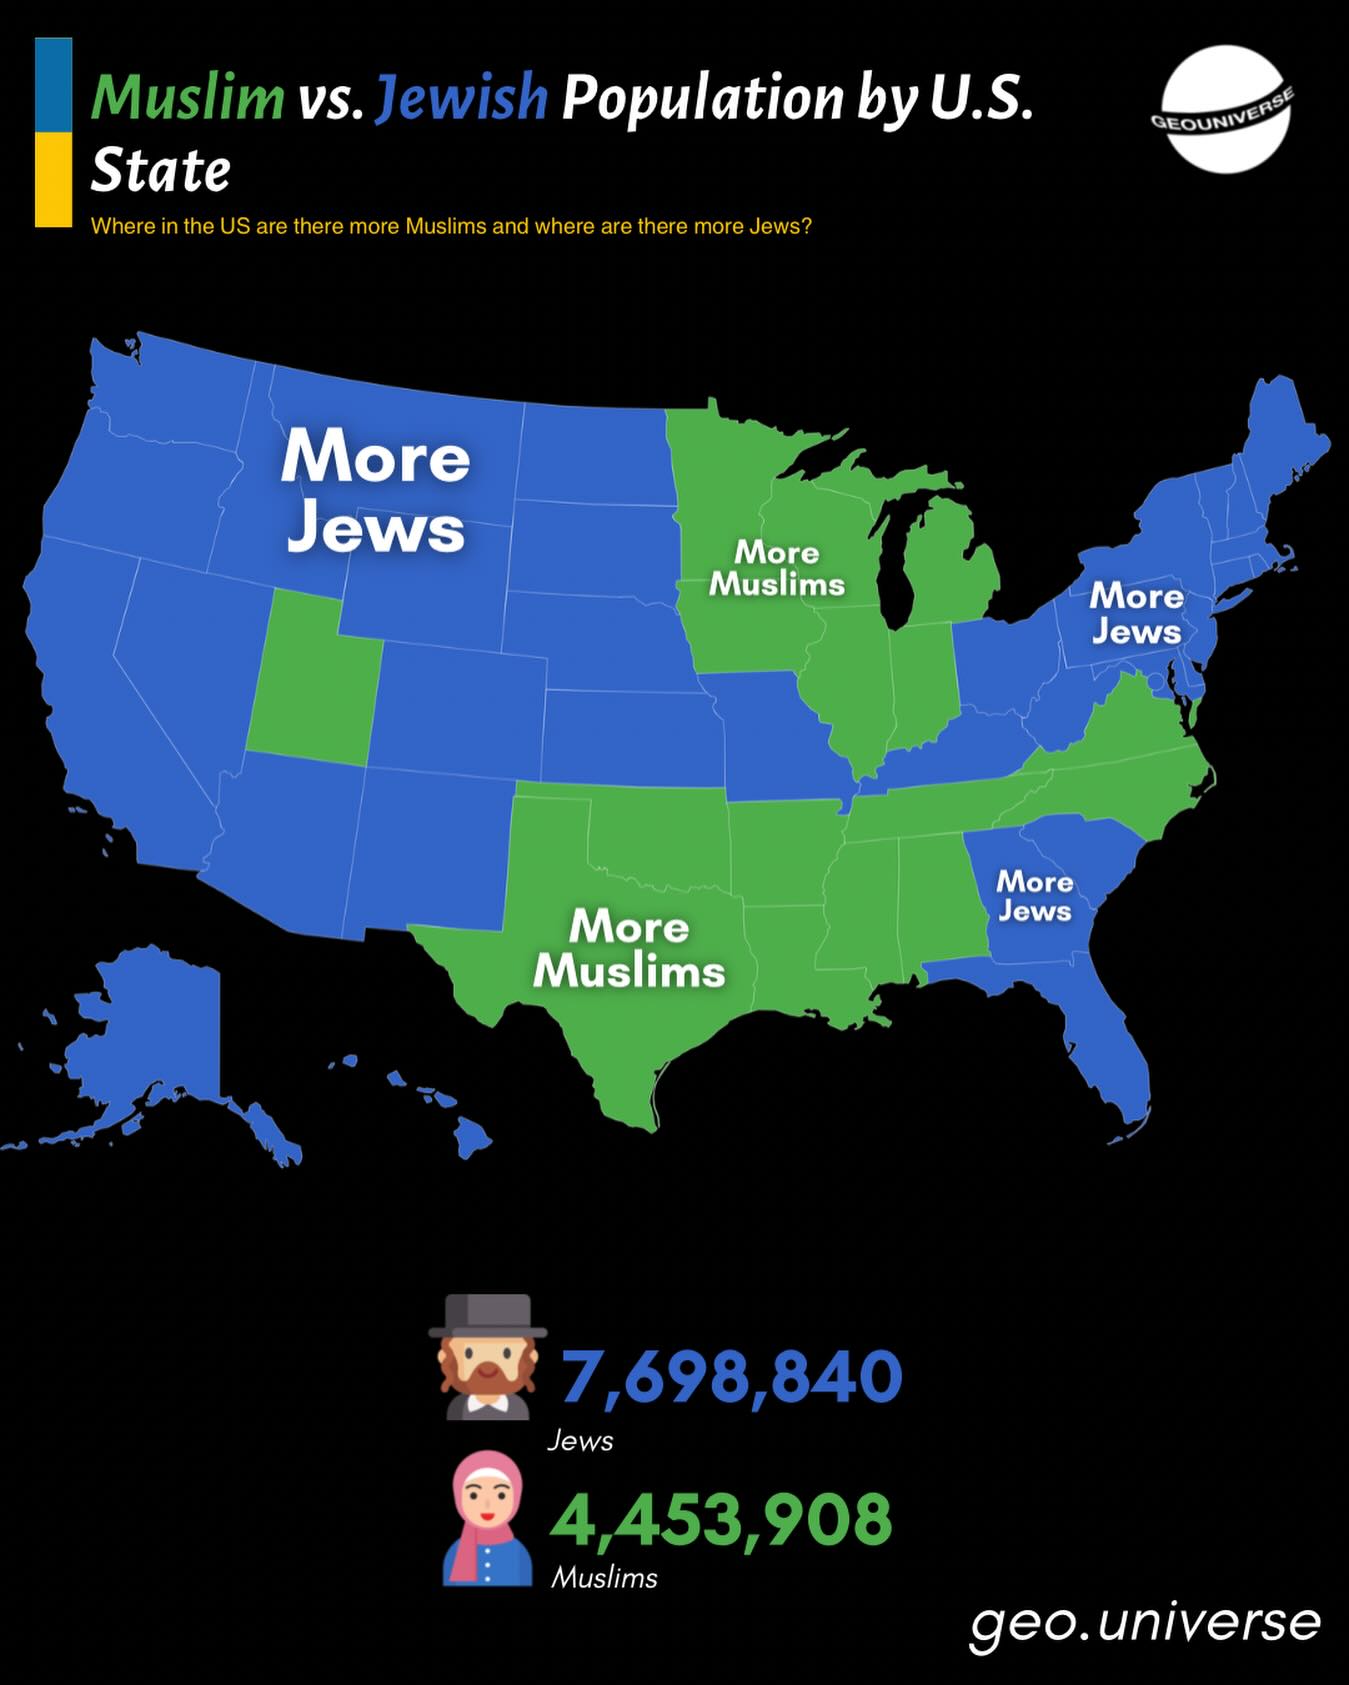
The map above shows which states have more Jews than Muslims living in them and vice versa.
But, it should be noted that in absolute terms New York state has the most Jews and the most Muslims living there.
In total, 7.7 million Jews live in the United States (more than in Israel) compared to just 4.5 million Muslims (slightly less than in Palestine).
Below are the numbers for each state, the % of the state population that is Jewish or Muslim as well as the difference in numbers.
| State | Jewish Population (2024) | Muslim Population | Percentage Jewish | Percent Muslim | Combined % | Difference |
|---|---|---|---|---|---|---|
| New York | 1,672,025 | 724,475 | 8.54% | 3.59% | 12.13% | 947,550 |
| California | 1,259,325 | 504,056 | 3.23% | 1.27% | 4.50% | 755,269 |
| Florida | 761,795 | 127,172 | 3.37% | 0.59% | 3.96% | 634,623 |
| New Jersey | 581,200 | 321,652 | 6.26% | 3.46% | 9.72% | 259,548 |
| Pennsylvania | 347,860 | 149,561 | 2.68% | 1.15% | 3.83% | 198,299 |
| Massachusetts | 318,450 | 131,749 | 4.55% | 1.87% | 6.42% | 186,701 |
| Colorado | 117,910 | 10,828 | 2.01% | 0.19% | 2.20% | 107,082 |
| Connecticut | 141,500 | 43,905 | 3.91% | 1.22% | 5.13% | 97,595 |
| Nevada | 85,330 | 7,400 | 2.67% | 0.24% | 2.91% | 77,930 |
| Oregon | 70,105 | 4,934 | 1.66% | 0.12% | 1.78% | 65,171 |
| Maryland | 250,860 | 188,914 | 4.06% | 3.06% | 7.12% | 61,946 |
| Washington | 88,530 | 27,391 | 1.13% | 0.36% | 1.49% | 61,139 |
| Ohio | 177,295 | 120,077 | 1.50% | 1.02% | 2.52% | 57,218 |
| Washington D.C. | 57,300 | 7,528 | 8.44% | 1.09% | 9.53% | 49,772 |
| South Carolina | 36,245 | 6,677 | 0.67% | 0.13% | 0.80% | 29,568 |
| Georgia | 148,625 | 123,652 | 1.35% | 1.15% | 2.50% | 24,973 |
| Arizona | 132,360 | 109,765 | 1.78% | 1.53% | 3.31% | 22,595 |
| New Hampshire | 20,900 | 1,172 | 1.49% | 0.09% | 1.58% | 19,728 |
| Rhode Island | 18,950 | 2,599 | 1.73% | 0.24% | 1.97% | 16,351 |
| Kansas | 17,610 | 3,615 | 0.60% | 0.12% | 0.72% | 13,995 |
| Delaware | 17,400 | 7,065 | 1.69% | 0.71% | 2.40% | 10,335 |
| Hawaii | 9,900 | 145 | 0.69% | 0.01% | 0.70% | 9,755 |
| Nebraska | 10,245 | 2,402 | 0.52% | 0.12% | 0.64% | 7,843 |
| New Mexico | 19,855 | 12,046 | 0.94% | 0.57% | 1.51% | 7,809 |
| Vermont | 12,700 | 6,201 | 1.96% | 0.96% | 2.92% | 6,499 |
| Alaska | 6,530 | 400 | 0.89% | 0.05% | 0.94% | 6,130 |
| Idaho | 5,920 | 2,531 | 0.30% | 0.14% | 0.44% | 3,389 |
| Montana | 3,170 | 200 | 0.28% | 0.02% | 0.30% | 2,970 |
| Missouri | 56,395 | 53,443 | 0.91% | 0.87% | 1.78% | 2,952 |
| West Virginia | 2,950 | 849 | 0.17% | 0.05% | 0.22% | 2,101 |
| Wyoming | 2,210 | 226 | 0.38% | 0.04% | 0.42% | 1,984 |
| Maine | 18,360 | 16,894 | 1.32% | 1.24% | 2.56% | 1,466 |
| North Dakota | 920 | 540 | 0.12% | 0.07% | 0.19% | 380 |
| Kentucky | 18,300 | 17,957 | 0.40% | 0.40% | 0.80% | 343 |
| South Dakota | 765 | 535 | 0.08% | 0.06% | 0.14% | 230 |
| Mississippi | 2,910 | 3,106 | 0.10% | 0.10% | 0.20% | -196 |
| Arkansas | 5,120 | 6,765 | 0.17% | 0.22% | 0.39% | -1,645 |
| Virginia | 165,365 | 169,371 | 1.90% | 1.96% | 3.86% | -4,006 |
| Louisiana | 19,915 | 24,732 | 0.44% | 0.53% | 0.97% | -4,817 |
| Alabama | 18,080 | 23,550 | 0.35% | 0.47% | 0.82% | -5,470 |
| Oklahoma | 8,920 | 15,290 | 0.22% | 0.39% | 0.61% | -6,370 |
| Tennessee | 29,820 | 39,745 | 0.42% | 0.58% | 1.00% | -9,925 |
| Indiana | 31,280 | 41,400 | 0.46% | 0.61% | 1.07% | -10,120 |
| Utah | 13,030 | 25,403 | 0.38% | 0.78% | 1.16% | -12,373 |
| Iowa | 6,385 | 23,211 | 0.20% | 0.73% | 0.93% | -16,826 |
| Wisconsin | 48,515 | 68,699 | 0.82% | 1.17% | 1.99% | -20,184 |
| North Carolina | 99,830 | 130,661 | 0.92% | 1.25% | 2.17% | -30,831 |
| Minnesota | 68,855 | 114,590 | 1.20% | 2.01% | 3.21% | -45,735 |
| Texas | 220,840 | 313,209 | 0.72% | 1.07% | 1.79% | -92,369 |
| Michigan | 129,225 | 241,828 | 1.29% | 2.40% | 3.69% | -112,603 |
| Illinois | 334,220 | 473,792 | 2.66% | 3.70% | 6.36% | -139,572 |
| US Total | 7,692,105 | 4,453,908 | 2.30% | 1.34% | 3.64% | 3,238,197 |
Data for the number of Jews living in a state comes form the Jewish Virtual Library and the numbers for Muslims comes Wikipedia.
Here are a few other related maps:

Countries/States With A City That Has More Than 1 Million Jewish Inhabitants In The City Proper

An interesting fact, about the Jewish population of the United States is that New York City is the only city in the world to have a Jewish population of over 1 million people living in the city proper.
However, the Tel Aviv metropolitan area (Gush Dan) actually has the greatest number of Jews living in it at just under 4 million compared to 2.1 million living in the New York City Metropolitan area. But the Jewish population of Tel Aviv itself is just over 400,000.
Countries/US States With A Jewish Population Over 1 Million People

Only Israel, New York and California have Jewish populations above 1 million people.
In the US Florida is the 3rd highest at just over 760,000.
This is 100,000 more than France which has a Jewish population of 650,000, making it the third highest by country.
Number of Cities With A Jewish Population Of Over 100k Living In The City Proper

And they are:
| City | Country | Number |
|---|---|---|
| New York City | United States | 1,000,000 |
| Jerusalem | Israel | 570,100 |
| Los Angeles | United States | 519,200 |
| Tel Aviv | Israel | 401,500 |
| Chicago | United States | 291,800 |
| Paris | France | 277,000 |
| Boston | United States | 248,000 |
| Buenos Aires | Argentina | 244,000 |
| Rishon LeZiyyon | Israel | 229,300 |
| San Francisco Bay Area | United States | 227,800 |
| Petah Tikva | Israel | 220,900 |
| Bnei Brak | Israel | 218,300 |
| Haifa | Israel | 217,600 |
| Philadelphia | United States | 214,600 |
| Ashdod | Israel | 200,400 |
| Netanya | Israel | 196,300 |
| Toronto | Canada | 188,710 |
| Be'er Sheva | Israel | 181,000 |
| Holon | Israel | 180,900 |
| Ramat Gan | Israel | 175,000 |
| Moscow | Russia | 165,000 |
| Beit Shemesh | Israel | 154,600 |
| London | United Kingdom | 145,480 |
| Atlanta | United States | 119,800 |
| Miami | United States | 119,000 |
| Kyiv | Ukraine | 111,000 |
| San Diego | United States | 100,000 |
Another map:
What do you think?


Elisha Even-Sapir says
There are not more Jews in the US than in Israel. Israel has the world’s largest Jewish population (it’s not very close). Twenty years ago it might have been true, but not today. The percentage of Jews worldwide who live in Israel has increased steadily increased every decade. Today, it’s either an absolute majority or nearly so.
Lebron Tulsa says
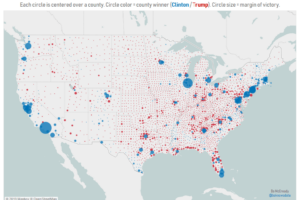
This is a fascinating and incredibly clear visualization of a demographic story that often gets lost in broad national statistics. The side-by-side county-level maps for both populations are especially effective, highlighting not just where these communities are concentrated, but also the distinct patterns of their geographical distribution across the U.S. It really underscores the diversity within both groups.
Beyond the major metropolitan hubs, were there any counties or regions where the data showed a surprising concentration or a historical presence of these communities that might contradict common assumptions about their settlement patterns in America?
John Barlow says
“…Jewish and/or Muslim”?
Are they not mutually exclusive?
Wording needed a little more thought, perhaps.