
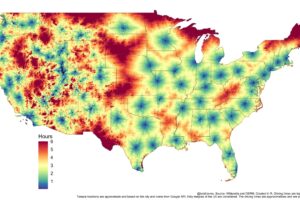
The map above shows the total number of Jews living in the United States. Overall, the map creators estimate that there is a total Jewish population in the United States of 7,698,840 people.
And given that the total U.S. Population is 334,914,095 people, it means 2.3% of the total US population is Jewish.
Here is the data by state:
| State | Number of Jews | Total Population | % Jewish | % of total US Jewish Population |
|---|---|---|---|---|
| New York | 1,672,025 | 19,571,216 | 8.50% | 21.70% |
| California | 1,295,315 | 38,965,103 | 3.30% | 16.80% |
| Florida | 753,865 | 22,610,726 | 3.30% | 9.80% |
| New Jersey | 581,200 | 9,200,841 | 6.30% | 7.50% |
| Pennsylvania | 347,850 | 12,961,683 | 2.70% | 4.50% |
| Illinois | 334,180 | 12,549,689 | 2.70% | 4.30% |
| Massachusetts | 318,450 | 7,001,399 | 4.50% | 4.10% |
| Maryland | 250,860 | 6,180,253 | 4.10% | 3.30% |
| Texas | 220,685 | 30,503,301 | 0.70% | 2.90% |
| Ohio | 177,295 | 11,785,995 | 1.50% | 2.30% |
| Virginia | 165,260 | 8,715,698 | 1.90% | 2.10% |
| Georgia | 148,585 | 11,029,227 | 1.30% | 1.90% |
| Connecticut | 141,500 | 3,617,176 | 3.90% | 1.80% |
| Arizona | 132,960 | 7,431,348 | 1.80% | 1.70% |
| Michigan | 129,225 | 10,037,261 | 1.30% | 1.70% |
| Colorado | 117,900 | 5,876,107 | 2.00% | 1.50% |
| North Carolina | 99,795 | 10,835,491 | 0.90% | 1.30% |
| Washington | 88,530 | 7,812,880 | 1.10% | 1.10% |
| Nevada | 85,530 | 3,196,176 | 2.70% | 1.10% |
| Missouri | 71,840 | 6,196,156 | 1.20% | 0.90% |
| Oregon | 70,105 | 4,253,358 | 1.60% | 0.90% |
| Minnesota | 48,850 | 5,737,915 | 0.90% | 0.60% |
| DC | 44,805 | 673,982 | 6.60% | 0.60% |
| Wisconsin | 33,870 | 5,910,975 | 0.60% | 0.40% |
| South Carolina | 32,850 | 5,373,555 | 0.60% | 0.40% |
| Indiana | 31,205 | 6,862,919 | 0.50% | 0.40% |
| Tennessee | 29,775 | 7,126,489 | 0.40% | 0.40% |
| New Hampshire | 20,900 | 1,402,054 | 1.50% | 0.30% |
| Louisiana | 19,870 | 4,573,749 | 0.40% | 0.30% |
| New Mexico | 19,855 | 2,114,371 | 0.90% | 0.30% |
| Rhode Island | 19,800 | 1,095,962 | 1.70% | 0.30% |
| Maine | 18,650 | 1,396,722 | 1.30% | 0.20% |
| Kentucky | 18,465 | 4,526,184 | 0.40% | 0.20% |
| Alabama | 17,580 | 5,108,468 | 0.30% | 0.20% |
| Kansas | 17,590 | 2,940,546 | 0.60% | 0.20% |
| Delaware | 17,430 | 1,031,690 | 1.70% | 0.20% |
| Utah | 12,300 | 3,417,734 | 0.40% | 0.20% |
| Vermont | 10,235 | 647,464 | 1.60% | 0.10% |
| Nebraska | 10,200 | 1,978,379 | 0.50% | 0.10% |
| Hawaii | 8,600 | 1,436,198 | 0.60% | 0.10% |
| Oklahoma | 8,500 | 4,053,824 | 0.20% | 0.10% |
| Alaska | 5,900 | 731,348 | 0.80% | 0.10% |
| Iowa | 5,390 | 3,207,004 | 0.20% | 0.10% |
| Idaho | 5,200 | 1,964,726 | 0.30% | 0.10% |
| Arkansas | 5,090 | 3,067,782 | 0.20% | 0.10% |
| Montana | 3,170 | 1,132,612 | 0.30% | 0.00% |
| West Virginia | 2,940 | 1,770,071 | 0.20% | 0.00% |
| Mississippi | 2,885 | 2,939,690 | 0.10% | 0.00% |
| Wyoming | 2,840 | 584,057 | 0.50% | 0.00% |
| North Dakota | 825 | 789,926 | 0.10% | 0.00% |
| South Dakota | 765 | 919,918 | 0.10% | 0.00% |
And here are the top 100 counties:
| Counties | State | Jews | Pct Jewish |
|---|---|---|---|
| Rockland | New York | 91,300 | 29.30% |
| Kings | New York | 561,000 | 22.40% |
| Nassau | New York | 230,000 | 17.20% |
| Palm Beach | Florida | 208,850 | 15.80% |
| New York | New York | 240,000 | 15.10% |
| Westchester | New York | 136,000 | 14.30% |
| Montgomery | Maryland | 113,000 | 11.60% |
| Ocean | New Jersey | 61,500 | 10.70% |
| Marin | California | 26,100 | 10.30% |
| Bergen | New Jersey | 92,500 | 10.20% |
| Monmouth | New Jersey | 64,000 | 10.20% |
| Broward | Florida | 170,700 | 9.80% |
| Sullivan | New York | 7,425 | 9.60% |
| Norfolk | Massachusetts | 63,600 | 9.50% |
| Queens | New York | 198,000 | 8.90% |
| Orange | New York | 32,300 | 8.70% |
| Alpine | California | 101 | 8.60% |
| San Francisco | California | 65,800 | 8.20% |
| Montgomery | Pennsylvania | 64,500 | 8.10% |
| Middlesex | Massachusetts | 113,800 | 7.60% |
| Baltimore | Maryland | 60,000 | 7.50% |
| Lake | Illinois | 51,300 | 7.30% |
| Richmond | New York | 34,000 | 7.30% |
| Santa Clara | California | 128,000 | 7.20% |
| Arlington | Virginia | 14,000 | 6.70% |
| San Mateo | California | 47,800 | 6.70% |
| Bucks | Pennsylvania | 41,400 | 6.60% |
| Ventura | California | 54,000 | 6.60% |
| Middlesex | New Jersey | 52,000 | 6.40% |
| Camden | New Jersey | 32,100 | 6.20% |
| Essex | New Jersey | 48,800 | 6.20% |
| Falls Church | Virginia | 750 | 6.10% |
| Howard | Maryland | 17,200 | 6.00% |
| Morris | New Jersey | 29,700 | 6.00% |
| Somerset | New Jersey | 19,000 | 5.90% |
| Suffolk | New York | 86,000 | 5.80% |
| Cuyahoga | Ohio | 70,300 | 5.50% |
| Fulton | Georgia | 50,000 | 5.40% |
| Los Angeles | California | 518,000 | 5.30% |
| Ozaukee | Wisconsin | 4,500 | 5.20% |
| Fairfield | Connecticut | 47,200 | 5.10% |
| Oakland | Michigan | 61,200 | 5.10% |
| Baltimore | Maryland | 30,900 | 5.00% |
| St. Louis | Missouri | 49,600 | 5.00% |
| Nantucket | Massachusetts | 500 | 4.90% |
| Denver | Colorado | 28,700 | 4.80% |
| Sonoma | California | 23,100 | 4.80% |
| Union | New Jersey | 25,800 | 4.80% |
| Washington, D.C. | Washington, D.C. | 28,000 | 4.70% |
| Philadelphia | Pennsylvania | 66,800 | 4.40% |
| Pitkin | Colorado | 750 | 4.40% |
| Arapahoe | Colorado | 24,600 | 4.30% |
| Atlantic | New Jersey | 11,700 | 4.30% |
| Geauga | Ohio | 4,000 | 4.30% |
| Miami-Dade | Florida | 106,300 | 4.30% |
| Chester | Pennsylvania | 20,900 | 4.20% |
| Cook | Illinois | 220,200 | 4.20% |
| Boulder | Colorado | 12,000 | 4.10% |
| Passaic | New Jersey | 20,000 | 4.00% |
| Alameda | California | 59,100 | 3.90% |
| Albany | New York | 12,000 | 3.90% |
| Bronx | New York | 54,000 | 3.90% |
| Putnam | New York | 3,900 | 3.90% |
| Delaware | Pennsylvania | 21,000 | 3.80% |
| Clark | Nevada | 72,300 | 3.70% |
| Suffolk | Massachusetts | 27,000 | 3.70% |
| DeKalb | Georgia | 25,000 | 3.60% |
| Fairfax | Virginia | 38,900 | 3.60% |
| Alexandria | Virginia | 4,900 | 3.50% |
| Dutchess | New York | 10,000 | 3.40% |
| Napa | California | 4,600 | 3.40% |
| Schenectady | New York | 5,200 | 3.40% |
| Allegheny | Pennsylvania | 40,500 | 3.30% |
| Berkshire | Massachusetts | 4,300 | 3.30% |
| Fairfax | Virginia | 750 | 3.30% |
| Hartford | Connecticut | 29,600 | 3.30% |
| Clay | Georgia | 101 | 3.20% |
| Ulster | New York | 5,900 | 3.20% |
| Contra Costa | California | 32,100 | 3.10% |
| New Haven | Connecticut | 27,100 | 3.10% |
| Essex | Massachusetts | 22,300 | 3.00% |
| Burlington | New Jersey | 12,900 | 2.90% |
| San Diego | California | 89,000 | 2.90% |
| Sussex | New Jersey | 4,300 | 2.90% |
| Johnson | Kansas | 15,000 | 2.80% |
| Orange | California | 83,750 | 2.80% |
| Hamilton | Ohio | 21,400 | 2.70% |
| Multnomah | Oregon | 20,000 | 2.70% |
| Pinellas | Florida | 25,000 | 2.70% |
| Monroe | New York | 19,000 | 2.60% |
| Sarasota | Florida | 9,950 | 2.60% |
| Broomfield | Colorado | 1,400 | 2.50% |
| Cobb | Georgia | 17,300 | 2.50% |
| Collier | Florida | 8,000 | 2.50% |
| Hennepin | Minnesota | 29,300 | 2.50% |
| Mercer | New Jersey | 9,000 | 2.50% |
| Cumberland | Maine | 6,775 | 2.40% |
| Seminole | Florida | 10,000 | 2.40% |
| Cherokee | Georgia | 5,000 | 2.30% |
| Custer | Idaho | 101 | 2.30% |
| Dukes | Massachusetts | 300 | 2.30% |
| Hampden | Massachusetts | 10,600 | 2.30% |
| Santa Cruz | California | 6,000 | 2.30% |
| Santa Fe | New Mexico | 3,300 | 2.30% |
And finally here’s the share of population by congressional district in 2024:


Leave a Reply