
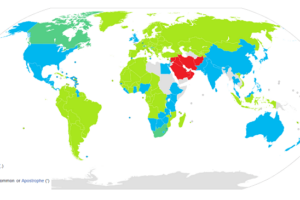
The map above shows who had a better vote margin against Donald Trump, Hillary Clinton or Kamala Harris.
This includes states they both each won and lost.
And confusingly it somewhat contradicts yesterday’s map Where did Hillary Clinton Outperform Kamala Harris and Vice Versa?.
That map simply showed who had a higher or lower vote share by state. And did not look at the margin relative to Trump.
However, as many on reddit rightfully pointed out (and noted at the end of the article) 3rd parties played a much bigger role in 2016 than they did in 2024.
3rd party candidates got 5.73% of the votes in 2016.
Notably, 3.28% for Libertarian Gary Johnson, 1.07% for Green party candidate Jill Stein and 0.54% for Evan McMullin who notably won 21.5% of the vote, in Utah.
Contrast that with 2024 where 3rd parties only got 1.89% of the vote including Jill Stein 0.50%, RFK Jr 0.49% and Chase Oliver 0.42%.
Therefore with 3.84% votes going to either Trump or Harris you’d expect her to get a higher vote share than Clinton, which she did, but only by 0.12% nationally.
All the rest went to Trump, which is why he won biggly.
And Harris’ gains in the majority of states were almost outweighed by losses in states like New York, Texas and her home state of California.
Now getting back to the map at the top of the page, it compares how Clinton did head-to-head with Trump vs how Harris did. (In terms of the winning or losing vote margin)
And it tells a very different story.
Overall, Clinton did much better especially in New York, Florida and California.
Florida went from a potential swing state (Clinton only lost it by just over 1% in 2016) to a deep red state in 2024 (Harris lost it by over 13%). For a vote margin difference of 11.86 percentage points.
Therefore, any Clinton did relatively better in all the states marked in redd and Harris did better in all the states marked in blue.
You can see the full data below.
Note than the any positive vote margin in the Net Margins columns means Trump won the state and negative numbers means Harris or Clinton won the state.
And in the final column: Difference In Vote Margin Harris vs Clinton, a positive number means Clinton did better and a negative number means Harris did better.
| State | Trump Vote Share 2024 % | Harris Vote Share 2024 % | Net Margin 2024 | Trump Vote Share 2016 % | Clinton Vote Share 2016 % | Net Margin 2016 | Difference In Vote Margin Harris vs Clinton |
|---|---|---|---|---|---|---|---|
| Alabama | 64.58 | 34.09 | 30.49 | 62.08 | 34.36 | 27.72 | 2.77 |
| Alaska | 54.69 | 41.27 | 13.42 | 51.28 | 36.55 | 14.73 | -1.31 |
| Arizona | 52.06 | 46.55 | 5.51 | 48.08 | 44.58 | 3.5 | 2.01 |
| Arkansas | 64.20 | 33.56 | 30.64 | 60.57 | 33.65 | 26.92 | 3.72 |
| California | 38.14 | 58.69 | -20.55 | 31.48 | 61.46 | -29.98 | 9.43 |
| Colorado | 43.17 | 54.16 | -10.99 | 43.25 | 48.16 | -4.91 | -6.08 |
| Connecticut | 41.91 | 56.38 | -14.47 | 40.93 | 54.57 | -13.64 | -0.83 |
| Delaware | 41.79 | 56.49 | -14.70 | 41.71 | 53.09 | -11.38 | -3.32 |
| D. C. | 6.51 | 90.22 | -83.71 | 4.09 | 90.86 | -86.77 | 3.06 |
| Florida | 55.87 | 42.82 | 13.05 | 48.6 | 47.41 | 1.19 | 11.86 |
| Georgia | 50.73 | 48.53 | 2.20 | 50.38 | 45.29 | 5.09 | -2.89 |
| Hawaii | 37.48 | 60.59 | -23.11 | 30.04 | 62.22 | -32.18 | 9.07 |
| Idaho | 66.88 | 30.38 | 36.50 | 59.25 | 27.48 | 31.77 | 4.73 |
| Illinois | 44.12 | 54.21 | -10.09 | 38.35 | 55.24 | -16.89 | 6.80 |
| Indiana | 58.58 | 39.62 | 18.96 | 56.42 | 37.43 | 18.99 | -0.03 |
| Iowa | 55.73 | 42.52 | 13.21 | 51.15 | 41.74 | 9.41 | 3.80 |
| Kansas | 57.18 | 41.03 | 16.15 | 56.03 | 35.66 | 20.37 | -4.22 |
| Kentucky | 64.55 | 33.86 | 30.69 | 62.52 | 32.68 | 29.84 | 0.85 |
| Louisiana | 60.22 | 38.21 | 22.01 | 58.09 | 38.45 | 19.64 | 2.37 |
| Maine | 45.35 | 52.14 | -6.79 | 44.87 | 47.83 | -2.96 | -3.83 |
| Maryland | 34.45 | 62.27 | -27.82 | 33.91 | 60.33 | -26.42 | -1.40 |
| Massachusetts | 36.52 | 61.29 | -24.77 | 32.81 | 60.01 | -27.2 | 2.43 |
| Michigan | 49.74 | 48.33 | 1.41 | 47.25 | 47.03 | 0.22 | 1.19 |
| Minnesota | 46.68 | 50.92 | -4.24 | 44.93 | 46.44 | -1.51 | -2.73 |
| Mississippi | 61.28 | 37.41 | 23.87 | 57.86 | 40.06 | 17.8 | 6.07 |
| Missouri | 58.38 | 39.97 | 18.41 | 56.38 | 37.87 | 18.51 | -0.10 |
| Montana | 58.39 | 38.46 | 19.93 | 55.65 | 35.41 | 20.24 | -0.31 |
| Nebraska | 59.63 | 39.06 | 20.57 | 58.75 | 33.7 | 25.05 | -4.48 |
| Nevada | 50.59 | 47.49 | 3.10 | 45.5 | 47.92 | -2.42 | 5.52 |
| New Hampshire | 47.87 | 50.65 | -2.78 | 46.46 | 46.83 | -0.37 | -2.41 |
| New Jersey | 45.94 | 51.81 | -5.87 | 41 | 54.99 | -13.99 | 8.12 |
| New Mexico | 45.85 | 51.85 | -6.00 | 40.04 | 48.26 | -8.22 | 2.22 |
| New York | 43.56 | 55.14 | -11.58 | 36.51 | 59 | -22.49 | 10.91 |
| North Carolina | 50.86 | 47.65 | 3.21 | 49.83 | 46.17 | 3.66 | -0.45 |
| North Dakota | 66.96 | 30.51 | 36.45 | 62.96 | 27.23 | 35.73 | 0.72 |
| Ohio | 54.98 | 43.65 | 11.33 | 51.31 | 43.24 | 8.07 | 3.26 |
| Oklahoma | 66.16 | 31.90 | 34.26 | 65.32 | 28.93 | 36.39 | -2.13 |
| Oregon | 40.97 | 55.28 | -14.31 | 39.09 | 50.07 | -10.98 | -3.33 |
| Pennsylvania | 50.38 | 48.65 | 1.73 | 48.17 | 47.45 | 0.72 | 1.01 |
| Rhode Island | 41.76 | 55.54 | -13.78 | 38.9 | 54.41 | -15.51 | 1.73 |
| South Carolina | 58.23 | 40.36 | 17.87 | 54.94 | 40.67 | 14.27 | 3.60 |
| South Dakota | 63.43 | 34.24 | 29.19 | 61.53 | 31.74 | 29.79 | -0.60 |
| Tennessee | 64.19 | 34.48 | 29.71 | 60.72 | 34.72 | 26 | 3.71 |
| Texas | 56.22 | 42.38 | 13.84 | 52.09 | 43.12 | 8.97 | 4.87 |
| Utah | 59.38 | 37.79 | 21.59 | 45.05 | 27.16 | 17.89 | 3.70 |
| Vermont | 32.32 | 63.83 | -31.51 | 30.27 | 56.68 | -26.41 | -5.10 |
| Virginia | 46.06 | 51.83 | -5.77 | 44.43 | 49.75 | -5.32 | -0.45 |
| Washington | 38.97 | 57.28 | -18.31 | 36.83 | 52.54 | -15.71 | -2.60 |
| West Virginia | 69.98 | 28.11 | 41.87 | 67.85 | 26.18 | 41.67 | 0.20 |
| Wisconsin | 49.61 | 48.71 | 0.90 | 47.22 | 46.45 | 0.77 | 0.13 |
| Wyoming | 71.60 | 25.84 | 45.76 | 68.17 | 21.88 | 46.29 | -0.53 |
| NE-1 | 55.80 | 42.80 | 13.00 | 56.18 | 35.46 | 20.72 | -7.72 |
| NE-2 | 47.00 | 51.70 | -4.70 | 47.16 | 44.92 | 2.24 | -6.94 |
| NE-3 | 76.30 | 22.50 | 53.80 | 73.92 | 19.73 | 54.19 | -0.39 |
| ME-1 | 38.20 | 59.30 | -21.10 | 39.15 | 53.96 | -14.81 | -6.29 |
| ME-2 | 53.20 | 44.20 | 9.00 | 51.26 | 40.98 | 10.28 | -1.28 |
In addition to Wikipedia, would also like to thank https://www.270towin.com/ for their map building tool and Dave Leip’s Atlas of U.S. Elections.
From my reddit post:
In 2016, Clinton got 65,853,514 (48.2%) votes vs Trump’s 62,984,828 (46.1%) for a winning vote margin of 2.1%, she only lost because of the electoral college.
At the time of posting Harris has 74,246,010 (48.4%) votes vs Trump’s 76,774,608 (50.0%) a losing vote margin of 1.6%.
So Harris got a lot more total votes than Clinton, and a higher share of all votes cast, but actually did worse in head to-head vote margins, because Trump managed to increase hist vote totals even more.
Another big part of the story are 3rd parties who got 5.73% of the vote in 2016 but just 1.89% of the vote in 2024 (Poor Jill Stein lost over half her support between 2016 and 2024).
3 states tell very interesting stories Florida, New York and California.
Both Harris and Clinton lost Florida, but Clinton only lost it by just over 1% and Harris lost it by 13%. It’s gone from being a swing state to deep red. But at least Harris managed to increase her vote total by 175,773 votes vs Clinton.
Both Clinton and Harris won New York, but Harris got 161,007 fewer votes than Clinton, which is something when there 17 million more votes cast nationally in 2024 vs 2016. The winning margin went from 22% to just 11%.
Finally, California, which is Harris’ home state. She managed to get 324,008 more votes than Clinton, but her winning margin declined by 9.43 percentage points (3rd highest after Florida and New York), 29.98% vs 20.55%. Still pretty safe for the Democrats for now, but a big L for Harris here.


Leave a Reply