
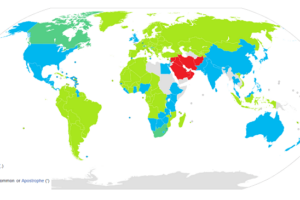
The map above shows where Hillary Clinton did relatively better than Kamala Harris and vice versa based on the relative share of each’s states popular vote.
States where Harris got at least 5 percentage points more of the popular vote than Clinton are coloured dark blue (5 states, NE-1, NE-2 and ME-1).
States where Clinton got at least 5 percentage points more of the popular vote than Harris are coloured dark red (none).
The lighter colours show where the margin was between 1 and 5 percentage points and the lightest colours are where the margin was sub 1 percentage points between them.
Overall, Harris actually got a higher share of the vote in the majority of states both in terms of number and electoral college votes compared to Clinton, despite her losing the popular vote to Trump and Clinton winning it by 3 million vote.
One of the big reasons is that Third Party candidates got 5.7% of the votes in 2016, compared to 1.89% of votes in 2024.
This means that while Harris improved her vote share vs Clinton by around 0.12 percentage points nationally, Trump improve his vote share by 3.78 percentage points.
You can see the data below. Note positive numbers means Harris did better and negative numbers means Clinton did better.
| State | Clinton Total Votes | Clinton Vote Share % | Harris Total Votes | Harris Vote Share % | Share Difference | Total Vote Difference |
|---|---|---|---|---|---|---|
| Alabama | 729,547 | 34.36% | 769,391 | 34.10% | -0.26% | 39,844 |
| Alaska | 116,454 | 36.55% | 130,763 | 41.00% | 4.45% | 14,309 |
| Arizona | 1,161,167 | 44.58% | 1,576,215 | 46.70% | 2.12% | 415,048 |
| Arkansas | 380,494 | 33.65% | 395,851 | 33.50% | -0.15% | 15,357 |
| California | 8,753,788 | 61.73% | 9,077,796 | 58.70% | -3.03% | 324,008 |
| Colorado | 1,338,870 | 48.16% | 1,727,578 | 54.20% | 6.04% | 388,708 |
| Connecticut | 897,572 | 54.57% | 989,545 | 56.40% | 1.83% | 91,973 |
| Delaware | 235,603 | 53.09% | 289,585 | 56.60% | 3.51% | 53,982 |
| District of Columbia | 282,830 | 90.86% | 289,453 | 90.20% | -0.66% | 6,623 |
| Florida | 4,504,975 | 47.82% | 4,680,748 | 43.00% | -4.82% | 175,773 |
| Georgia | 1,877,963 | 45.64% | 2,544,281 | 48.50% | 2.86% | 666,318 |
| Hawaii | 266,891 | 62.22% | 312,384 | 60.60% | -1.62% | 45,493 |
| Idaho | 189,765 | 27.49% | 274,838 | 30.40% | 2.91% | 85,073 |
| Illinois | 3,090,729 | 55.83% | 2,939,022 | 54.10% | -1.73% | -151,707 |
| Indiana | 1,033,126 | 37.77% | 1,158,650 | 39.70% | 1.93% | 125,524 |
| Iowa | 653,669 | 41.74% | 706,556 | 42.70% | 0.96% | 52,887 |
| Kansas | 427,005 | 36.05% | 532,475 | 41.00% | 4.95% | 105,470 |
| Kentucky | 628,854 | 32.68% | 700,920 | 33.90% | 1.22% | 72,066 |
| Louisiana | 780,154 | 38.45% | 766,424 | 38.20% | -0.25% | -13,730 |
| Maine | 357,735 | 47.83% | 430,795 | 52.10% | 4.27% | 73,060 |
| ME-1 | 212,774 | 53.96% | 256,570 | 59.30% | 5.34% | 43,796 |
| ME-2 | 144,817 | 40.98% | 174,225 | 44.20% | 3.22% | 29,408 |
| Maryland | 1,677,928 | 60.33% | 1,830,250 | 62.20% | 1.87% | 152,322 |
| Massachusetts | 1,995,196 | 60.01% | 2,072,304 | 61.30% | 1.29% | 77,108 |
| Michigan | 2,268,839 | 47.27% | 2,724,029 | 48.30% | 1.03% | 455,190 |
| Minnesota | 1,367,716 | 46.44% | 1,656,829 | 51.10% | 4.66% | 289,113 |
| Mississippi | 485,131 | 40.06% | 435,965 | 37.30% | -2.76% | -49,166 |
| Missouri | 1,071,068 | 38.14% | 1,190,806 | 40.00% | 1.86% | 119,738 |
| Montana | 177,709 | 35.75% | 231,856 | 38.50% | 2.75% | 54,147 |
| Nebraska † | 284,494 | 33.70% | 369,294 | 39.10% | 5.40% | 84,800 |
| NE-1 | 100,132 | 35.46% | 135,867 | 42.80% | 7.34% | 35,735 |
| NE-2 | 131,030 | 44.92% | 163,214 | 51.70% | 6.78% | 32,184 |
| NE-3 | 53,332 | 19.73% | 69,809 | 22.50% | 2.77% | 16,477 |
| Nevada | 539,260 | 47.92% | 703,902 | 47.50% | -0.42% | 164,642 |
| New Hampshire | 348,526 | 46.98% | 417,180 | 50.90% | 3.92% | 68,654 |
| New Jersey | 2,148,278 | 55.45% | 2,205,932 | 52.00% | -3.45% | 57,654 |
| New Mexico | 385,234 | 48.26% | 476,088 | 51.80% | 3.54% | 90,854 |
| New York | 4,556,124 | 59.01% | 4,395,117 | 55.60% | -3.41% | -161,007 |
| North Carolina | 2,189,316 | 46.17% | 2,688,797 | 47.70% | 1.53% | 499,481 |
| North Dakota | 93,758 | 27.23% | 112,327 | 30.50% | 3.27% | 18,569 |
| Ohio | 2,394,164 | 43.56% | 2,476,003 | 43.90% | 0.34% | 81,839 |
| Oklahoma | 420,375 | 28.93% | 499,599 | 31.90% | 2.97% | 79,224 |
| Oregon | 1,002,106 | 50.07% | 1,226,558 | 55.30% | 5.23% | 224,452 |
| Pennsylvania | 2,926,441 | 47.46% | 3,366,829 | 48.50% | 1.04% | 440,388 |
| Rhode Island | 252,525 | 54.41% | 285,132 | 55.50% | 1.09% | 32,607 |
| South Carolina | 855,373 | 40.67% | 1,027,225 | 40.40% | -0.27% | 171,852 |
| South Dakota | 117,458 | 31.74% | 146,859 | 34.20% | 2.46% | 29,401 |
| Tennessee | 870,695 | 34.72% | 1,055,039 | 34.50% | -0.22% | 184,344 |
| Texas | 3,877,868 | 43.24% | 4,806,441 | 42.40% | -0.84% | 928,573 |
| Utah | 310,676 | 27.46% | 562,560 | 37.80% | 10.34% | 251,884 |
| Vermont | 178,573 | 56.68% | 235,791 | 63.20% | 6.52% | 57,218 |
| Virginia | 1,981,473 | 49.73% | 2,334,867 | 51.80% | 2.07% | 353,394 |
| Washington | 1,742,718 | 52.54% | 2,234,241 | 57.30% | 4.76% | 491,523 |
| West Virginia | 188,794 | 26.43% | 214,309 | 28.10% | 1.67% | 25,515 |
| Wisconsin | 1,382,536 | 46.45% | 1,667,881 | 48.90% | 2.45% | 285,345 |
| Wyoming | 55,973 | 21.88% | 69,508 | 26.10% | 4.22% | 13,535 |
| Total | 65,853,516 | 48.18% | 74,812,473 | 48.30% | 0.12% | 8,958,957 |
Sources for the data include:
And a special thank you to 270toWin for their integrative map tool.


Leave a Reply