
The two maps above the difference between where wheat and rice are grown in the world. The top map shows wheat and the bottom one shows rice.
Usurpingly, Europe and North America produce a lot of wheat whereas South-East Asia produces a lot of rice.
However, what is perhaps a bit more surprising is the split within both India and China. Let’s take a closer look:
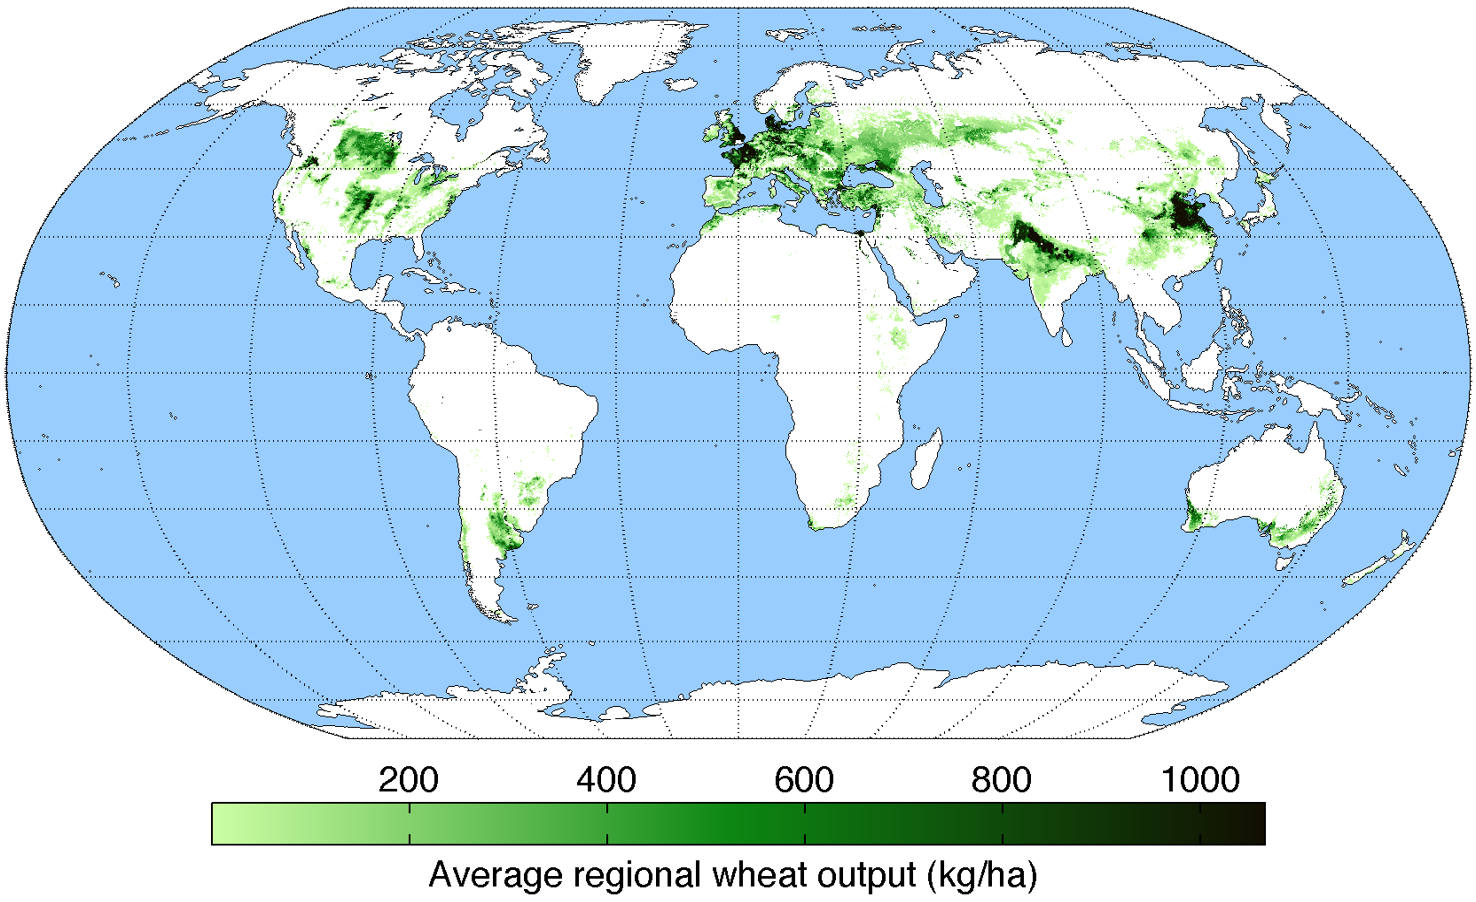
The map above shows only wheat production. Zoom into either India or China and you’ll find they actually produce a lot of it.
In the case of China it’s concentrated in the North, whereas in Indian it’s in the Nort West.
Here are the top countries by Wheat production according to the UN’s Food and Agriculture Organization.
| Country | Tonnes |
|---|---|
| China | 136,596,100 |
| India | 110,553,675 |
| Russian Federation | 91,500,000 |
| United States of America | 49,313,930 |
| Australia | 41,199,486 |
| France | 35,995,570 |
| Canada | 31,954,115 |
| Pakistan | 28,160,500 |
| Türkiye | 22,000,000 |
| Ukraine | 21,625,170 |
| Germany | 21,535,900 |
| Iran (Islamic Republic of) | 14,000,000 |
| United Kingdom of Great Britain and Northern Ireland | 13,980,000 |
| Poland | 12,932,390 |
| Argentina | 12,555,860 |
| Kazakhstan | 12,110,913 |
| Egypt | 9,700,000 |
| Romania | 9,624,070 |
| Brazil | 7,730,188 |
| Italy | 6,894,470 |
| Bulgaria | 6,854,760 |
| Uzbekistan | 6,471,502 |
| Hungary | 5,941,990 |
| Ethiopia | 5,800,000 |
| Czechia | 5,262,360 |
| Lithuania | 4,455,390 |
| Afghanistan | 4,300,000 |
| Iraq | 4,247,726 |
| Morocco | 4,158,471 |
| Spain | 4,049,230 |
| Denmark | 3,556,260 |
| Mexico | 3,476,027 |
| Serbia | 3,448,700 |
| Syrian Arab Republic | 3,080,351 |
| Sweden | 2,768,200 |
| Algeria | 2,500,000 |
| Slovakia | 2,490,600 |
| Belarus | 2,400,000 |
| Latvia | 2,136,800 |
| Nepal | 2,098,462 |
| South Africa | 2,050,000 |
| Azerbaijan | 1,792,419 |
| Belgium | 1,791,170 |
| Austria | 1,744,820 |
| Republic of Moldova | 1,555,024 |
| Uruguay | 1,343,800 |
| Greece | 1,309,180 |
| Chile | 1,289,774 |
| Paraguay | 1,288,310 |
| Bangladesh | 1,107,195 |
| Turkmenistan | 1,100,000 |
| Netherlands (Kingdom of the) | 1,096,820 |
| Japan | 1,094,000 |
| Saudi Arabia | 922,774 |
| Tajikistan | 861,000 |
| Croatia | 834,230 |
| Finland | 749,030 |
| Estonia | 694,120 |
| Ireland | 483,910 |
| Switzerland | 447,449 |
| Mongolia | 443,416 |
| Kyrgyzstan | 440,415 |
| Tunisia | 400,000 |
| New Zealand | 391,615 |
| Sudan | 378,000 |
| Kenya | 309,492 |
| Zimbabwe | 300,000 |
| Zambia | 277,492 |
| Bolivia (Plurinational State of) | 272,806 |
| Albania | 233,585 |
| Bosnia and Herzegovina | 228,012 |
| North Macedonia | 215,165 |
| Peru | 193,590 |
| Armenia | 177,860 |
| Norway | 172,000 |
| Georgia | 147,000 |
| Slovenia | 145,420 |
| Israel | 136,000 |
| Libya | 130,000 |
| Lebanon | 100,000 |
| Yemen | 100,000 |
| United Republic of Tanzania | 86,522 |
| Myanmar | 80,000 |
| Luxembourg | 72,360 |
| Democratic People's Republic of Korea | 67,367 |
| Nigeria | 52,757 |
| Republic of Korea | 51,809 |
| Mali | 38,500 |
| Palestine | 35,700 |
| Portugal | 34,670 |
| Cyprus | 27,850 |
| Jordan | 26,698 |
| Eritrea | 25,000 |
| Uganda | 25,000 |
| Namibia | 24,696 |
| Angola | 20,921 |
| Rwanda | 16,656 |
| Mozambique | 16,000 |
| Colombia | 9,354 |
| Democratic Republic of the Congo | 9,000 |
| Burundi | 7,960 |
| Oman | 7,892 |
| Lesotho | 6,366 |
| China, Taiwan Province of | 6,000 |
| Niger | 5,495 |
| Ecuador | 3,976 |
| Madagascar | 2,846 |
| Montenegro | 2,222 |
| Mauritania | 2,000 |
| Chad | 1,399 |
| Thailand | 1,321 |
| Honduras | 1,279 |
| Somalia | 1,060 |
| Malawi | 1,000 |
| Bhutan | 837 |
| Botswana | 810 |
| Eswatini | 705 |
| Cameroon | 600 |
| Venezuela (Bolivarian Republic of) | 579 |
| Kuwait | 25 |
| New Caledonia | 12 |
| Qatar | 2 |
| Guatemala | - |
| Malta | - |

And here the top rice producing countries:
| Country | Tonnes |
|---|---|
| China | 208,064,200 |
| India | 206,727,000 |
| Bangladesh | 58,613,458 |
| Indonesia | 53,980,993 |
| Viet Nam | 43,497,625 |
| Thailand | 33,070,957 |
| Myanmar | 25,650,000 |
| Philippines | 20,059,562 |
| Pakistan | 14,803,800 |
| Cambodia | 12,900,000 |
| Brazil | 10,285,663 |
| Japan | 10,136,000 |
| United States of America | 9,901,510 |
| Nigeria | 8,902,200 |
| Nepal | 5,724,200 |
| Egypt | 5,600,000 |
| Madagascar | 5,117,636 |
| Republic of Korea | 4,897,839 |
| Sri Lanka | 4,513,431 |
| Lao People's Democratic Republic | 3,835,000 |
| Iran (Islamic Republic of) | 3,598,594 |
| United Republic of Tanzania | 3,588,000 |
| Guinea | 3,534,800 |
| Peru | 3,367,614 |
| Mali | 3,023,891 |
| Colombia | 3,006,100 |
| Malaysia | 2,166,738 |
| Côte d'Ivoire | 2,011,500 |
| Democratic Republic of the Congo | 1,812,345 |
| Democratic People's Republic of Korea | 1,775,788 |
| Senegal | 1,519,700 |
| Ghana | 1,463,000 |
| China, Taiwan Province of | 1,461,000 |
| Sierra Leone | 1,399,500 |
| Italy | 1,378,640 |
| Uruguay | 1,372,700 |
| Ecuador | 1,313,000 |
| Argentina | 1,163,209 |
| Russian Federation | 1,065,700 |
| Guyana | 995,000 |
| Paraguay | 978,450 |
| Dominican Republic | 947,005 |
| Türkiye | 900,000 |
| Venezuela (Bolivarian Republic of) | 722,370 |
| Bolivia (Plurinational State of) | 698,544 |
| Afghanistan | 597,000 |
| Burkina Faso | 504,254 |
| Nicaragua | 498,969 |
| Australia | 496,633 |
| Benin | 492,626 |
| Kazakhstan | 485,183 |
| Mauritania | 458,200 |
| Panama | 436,135 |
| Burundi | 412,369 |
| Cameroon | 358,433 |
| Uzbekistan | 355,674 |
| Spain | 334,100 |
| Uganda | 260,000 |
| Liberia | 256,200 |
| Mexico | 252,100 |
| Kenya | 229,064 |
| Guinea-Bissau | 226,400 |
| Chad | 223,952 |
| Suriname | 203,156 |
| Ethiopia | 202,000 |
| Greece | 190,440 |
| Togo | 183,100 |
| Portugal | 178,830 |
| Mozambique | 161,920 |
| Niger | 142,600 |
| Haiti | 136,000 |
| Tajikistan | 134,485 |
| Rwanda | 133,628 |
| Cuba | 130,000 |
| Malawi | 124,300 |
| Chile | 109,233 |
| Turkmenistan | 86,617 |
| Timor-Leste | 83,000 |
| Costa Rica | 76,119 |
| France | 68,270 |
| Bulgaria | 64,160 |
| Zambia | 62,680 |
| Morocco | 56,222 |
| Gambia | 55,100 |
| Central African Republic | 53,326 |
| Guatemala | 51,193 |
| Kyrgyzstan | 46,765 |
| Bhutan | 40,804 |
| Angola | 39,830 |
| Honduras | 34,870 |
| South Sudan | 33,000 |
| Sudan | 21,880 |
| North Macedonia | 19,997 |
| Belize | 17,701 |
| Azerbaijan | 13,973 |
| Iraq | 12,602 |
| Romania | 12,070 |
| Ukraine | 11,080 |
| El Salvador | 11,000 |
| Hungary | 8,330 |
| Fiji | 7,165 |
| Brunei Darussalam | 3,700 |
| Puerto Rico | 3,628 |
| South Africa | 3,082 |
| Solomon Islands | 2,753 |
| Somalia | 2,000 |
| Gabon | 1,731 |
| Eswatini | 1,001 |
| Congo | 1,000 |
| Papua New Guinea | 885 |
| Saudi Arabia | 816 |
| Trinidad and Tobago | 326 |
| Algeria | 307 |
| Micronesia (Federated States of) | 182 |
| Zimbabwe | 74 |
| Comoros | 21 |
Finally, both South America and Africa are notable in their absence from both maps.


Leave a Reply