All of the following maps are the work of Todd Jones who is according to his website:
I am an Assistant Professor of Economics at Mississippi State University, an IZA Research Fellow, a CESifo Research Network Affiliate, and an Annenberg Institute (Brown University) EdWorkingPapers Contributor. Beginning in August 2026, I will be an Associate Professor of Economics at Mississippi State University.
My research interests are in applied microeconomics, including topics in education, family, and crime. My research is published in journals including the Journal of Human Resources, Journal of Public Economics, Journal of Economic Behavior & Organization, Labour Economics, Journal of Population Economics, Economics of Education Review, and Education Finance & Policy. My CV is available here.
You can follow him on Twitter/X @toddrjones.
Now on to the maps:
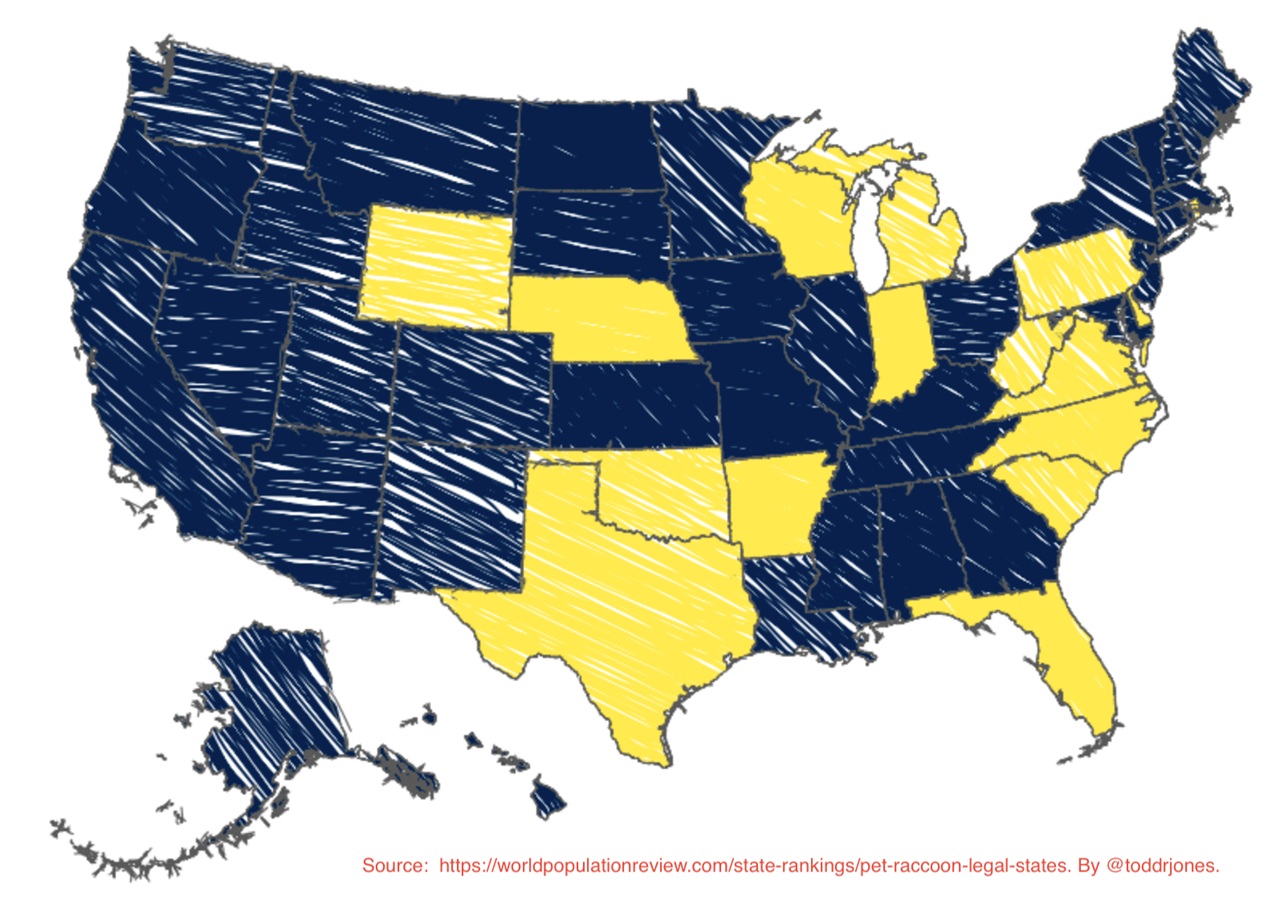
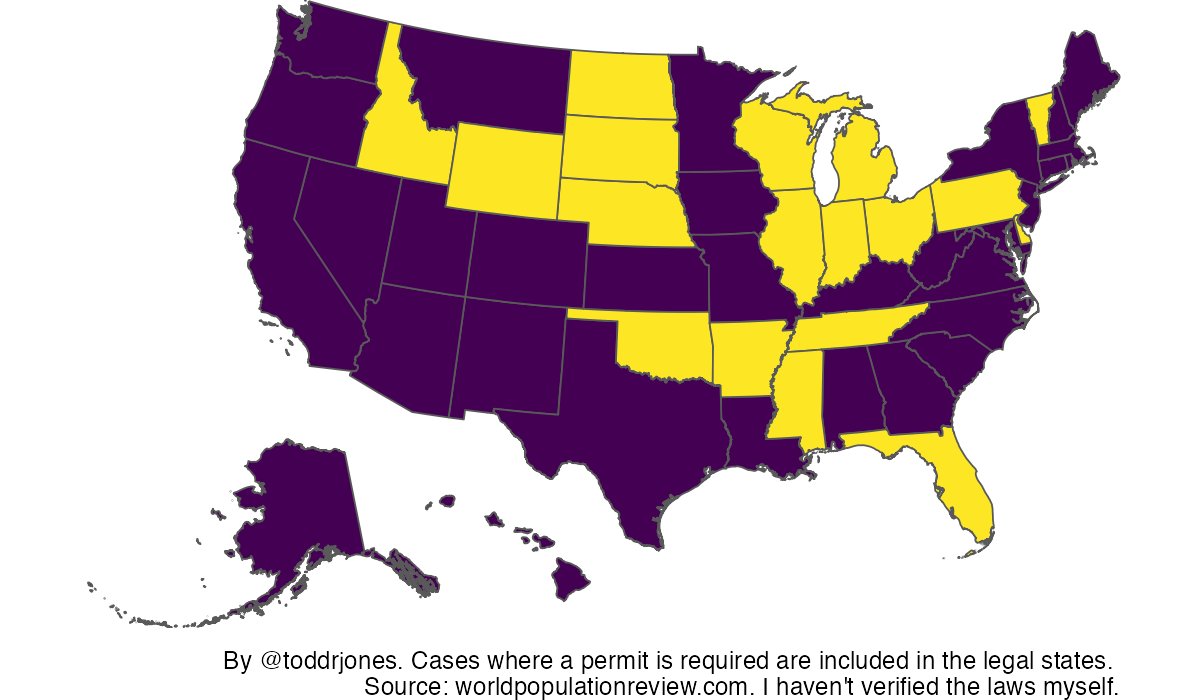
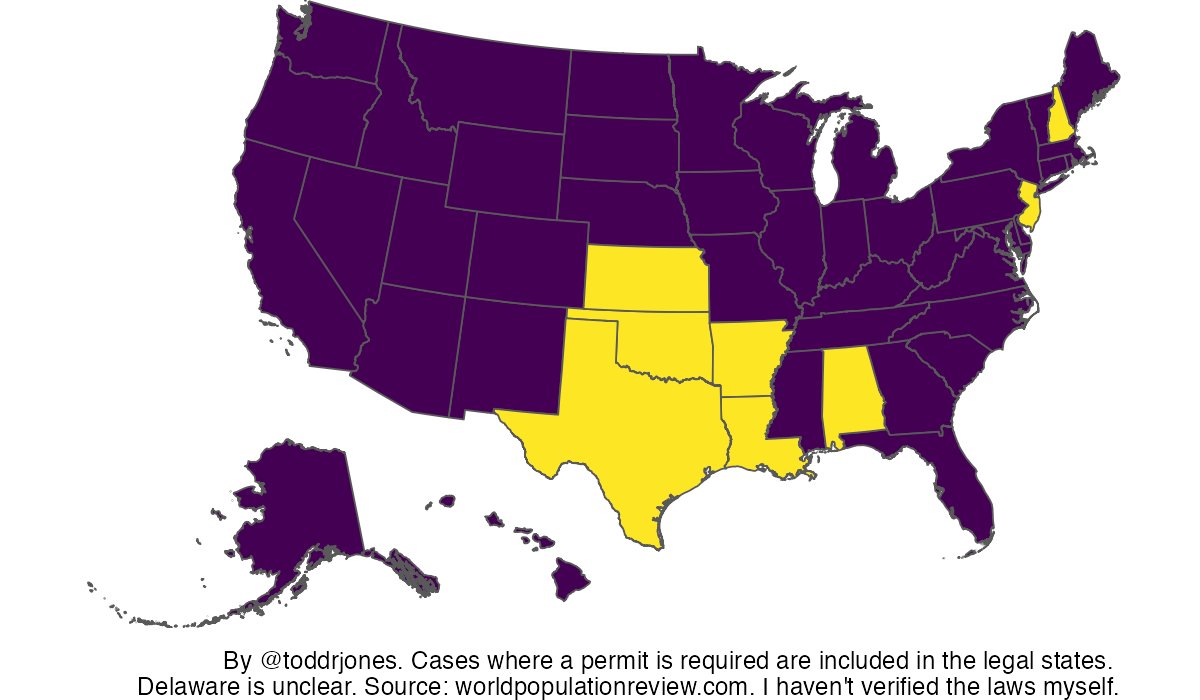
The yellow states in the map below are the states in which it is legal to own a RACCOON
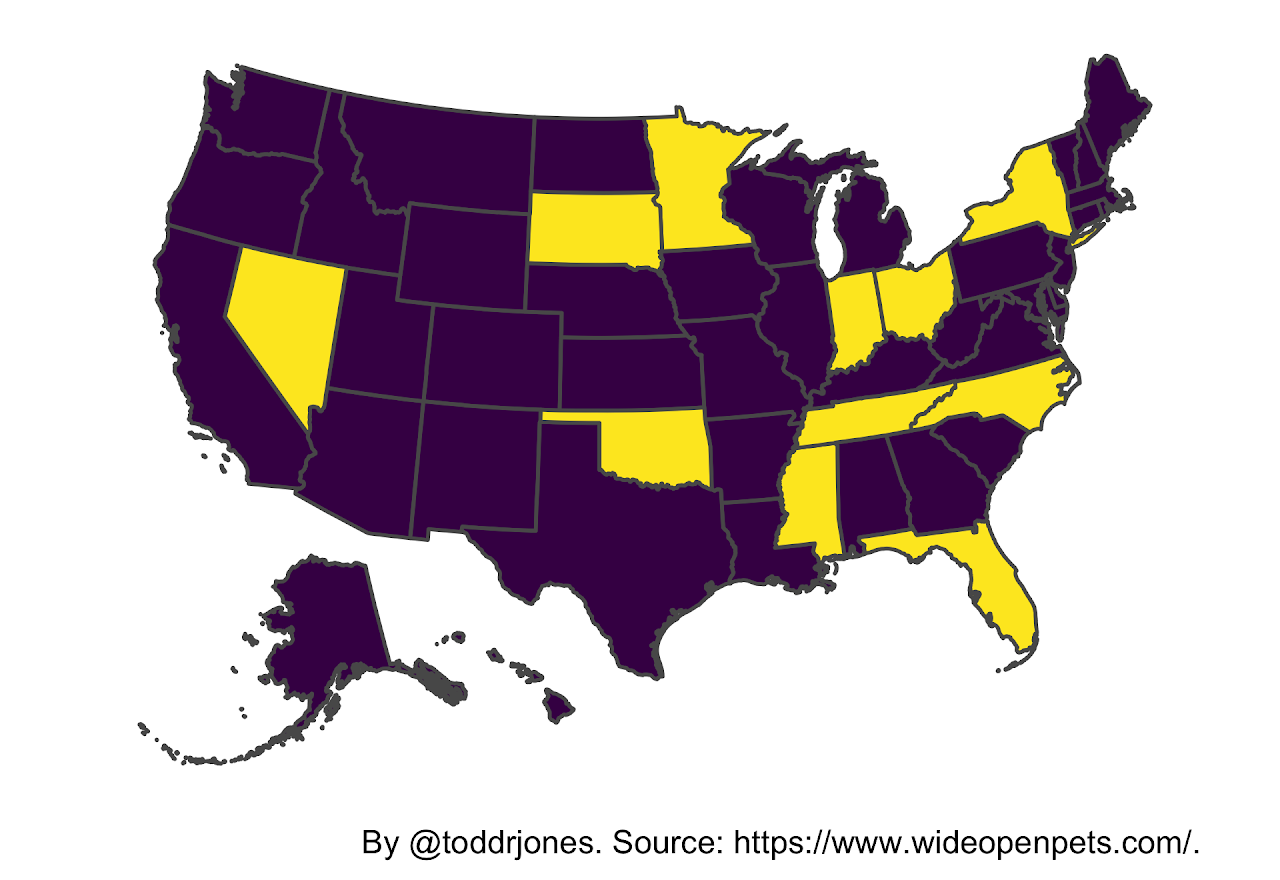
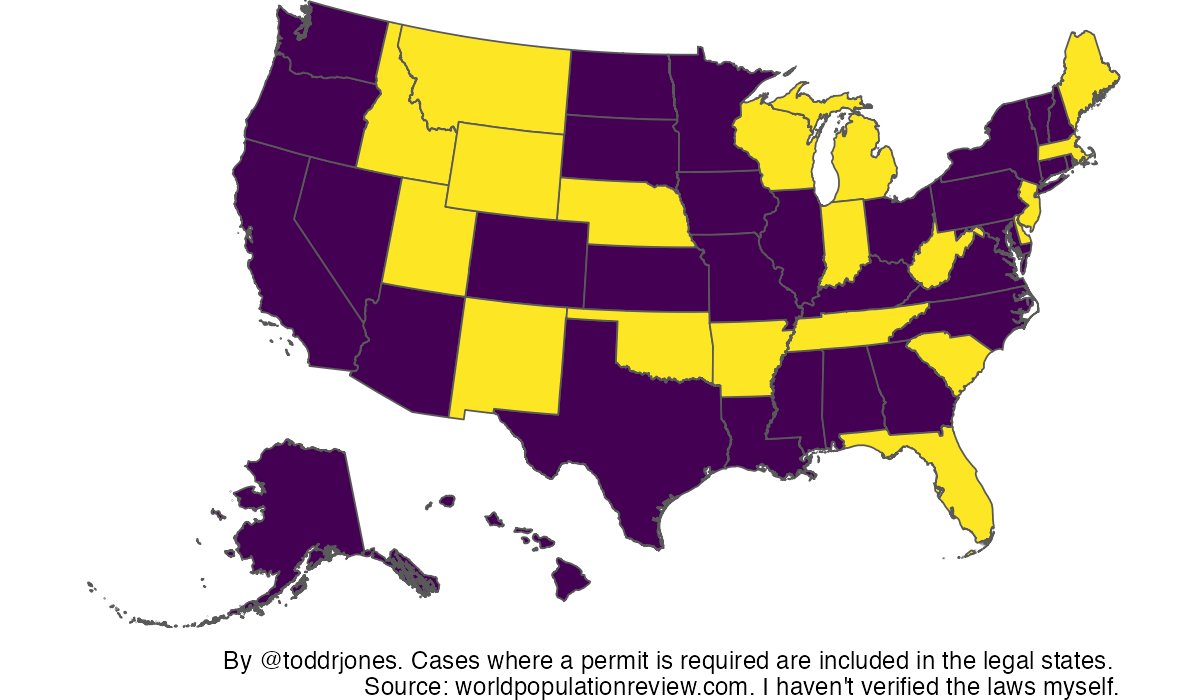
The yellow states in the map below are the states in which it is legal to own an otter
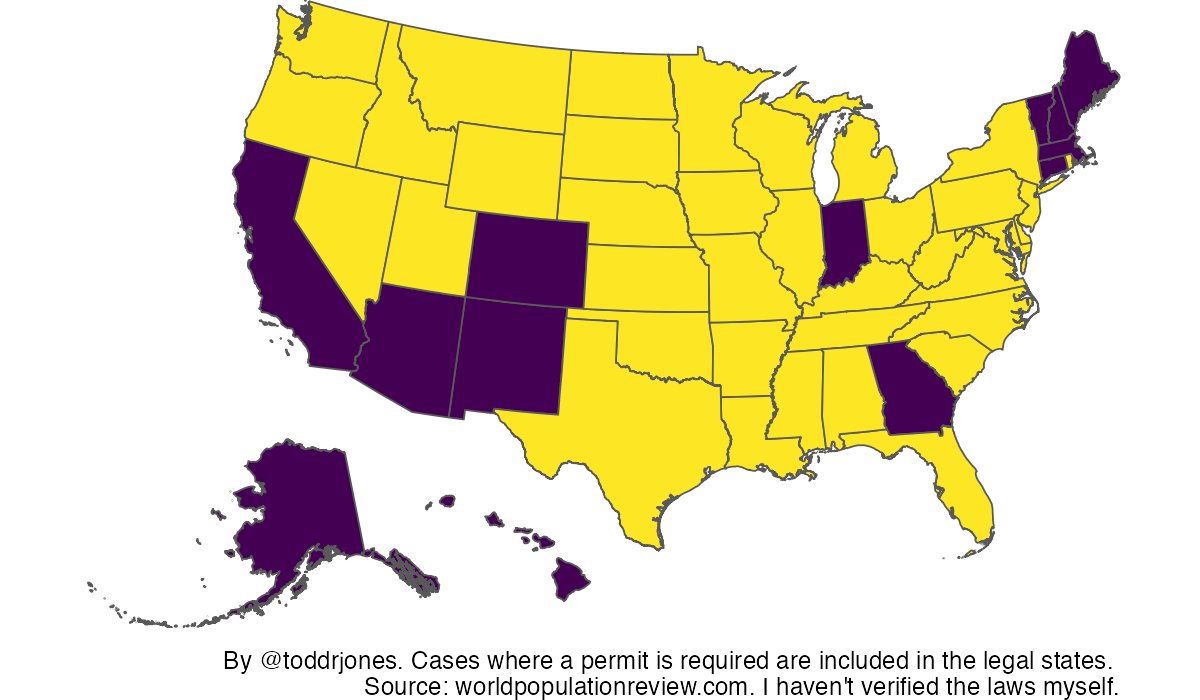
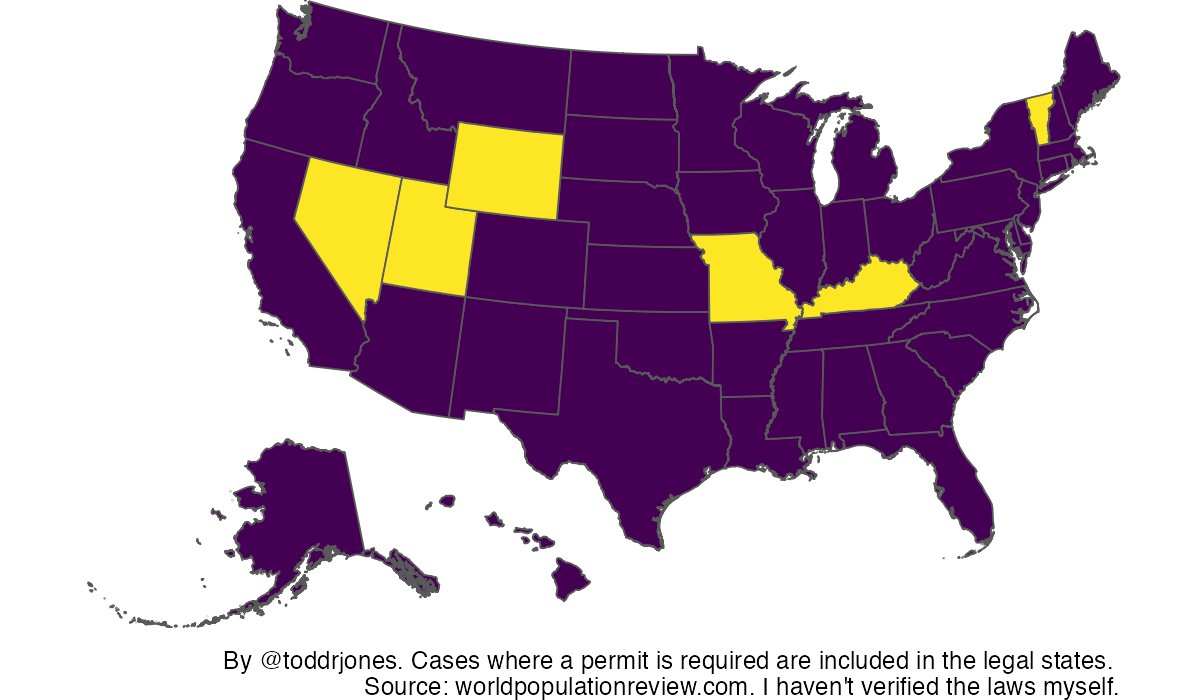
The yellow states in the map below are the states in which it is legal to own a Sloth
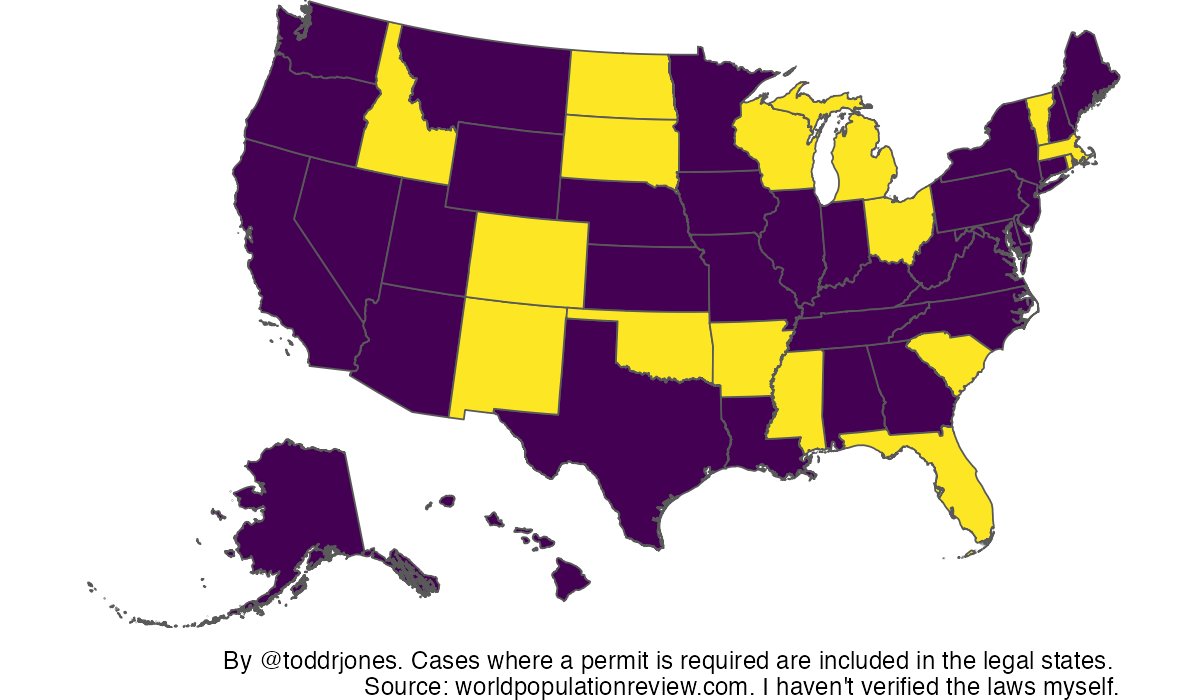
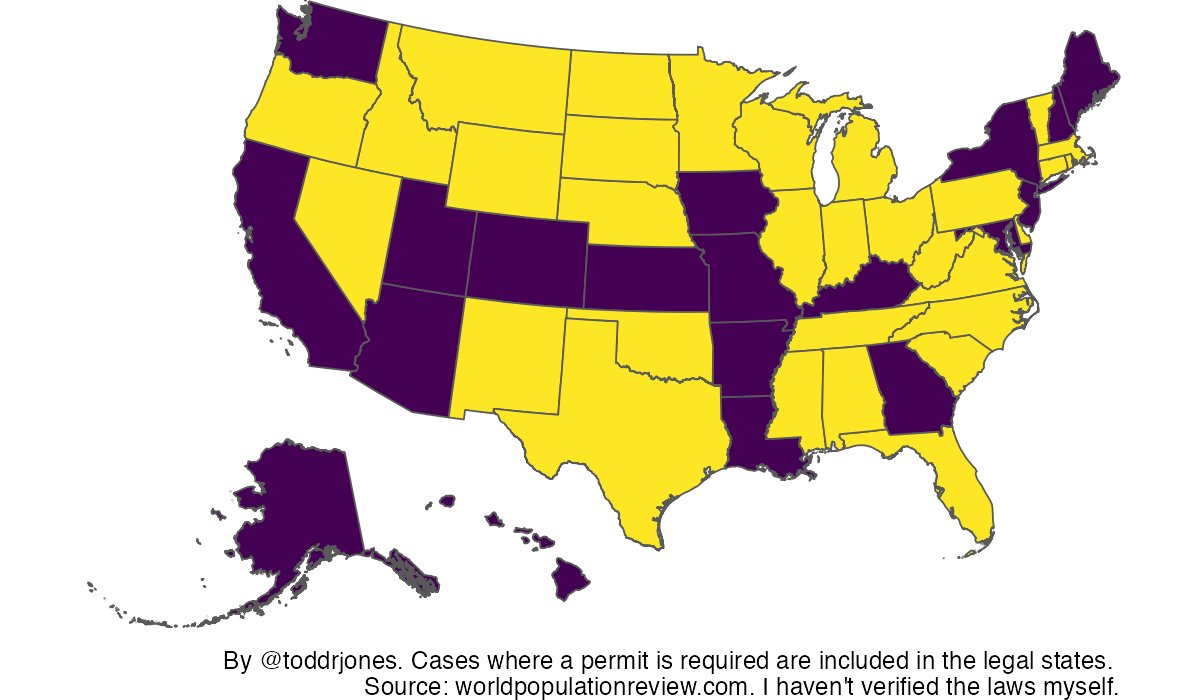
The yellow states in the map below are the states in which it is legal to own A Deer
The yellow states in the map below are the states in which it is legal to own a Fennec Fox
The yellow states in the map below are the states in which it is legal to own a Squirrel
The yellow states in the map below are the states in which it is legal to own an Owl
The yellow states in the map below are the states in which it is legal to own a Prairie Dog
The yellow states in the map below are the states in which it is legal to own An Armadillo
The yellow states in the map below are the states in which it is legal to own A HEDGEHOG
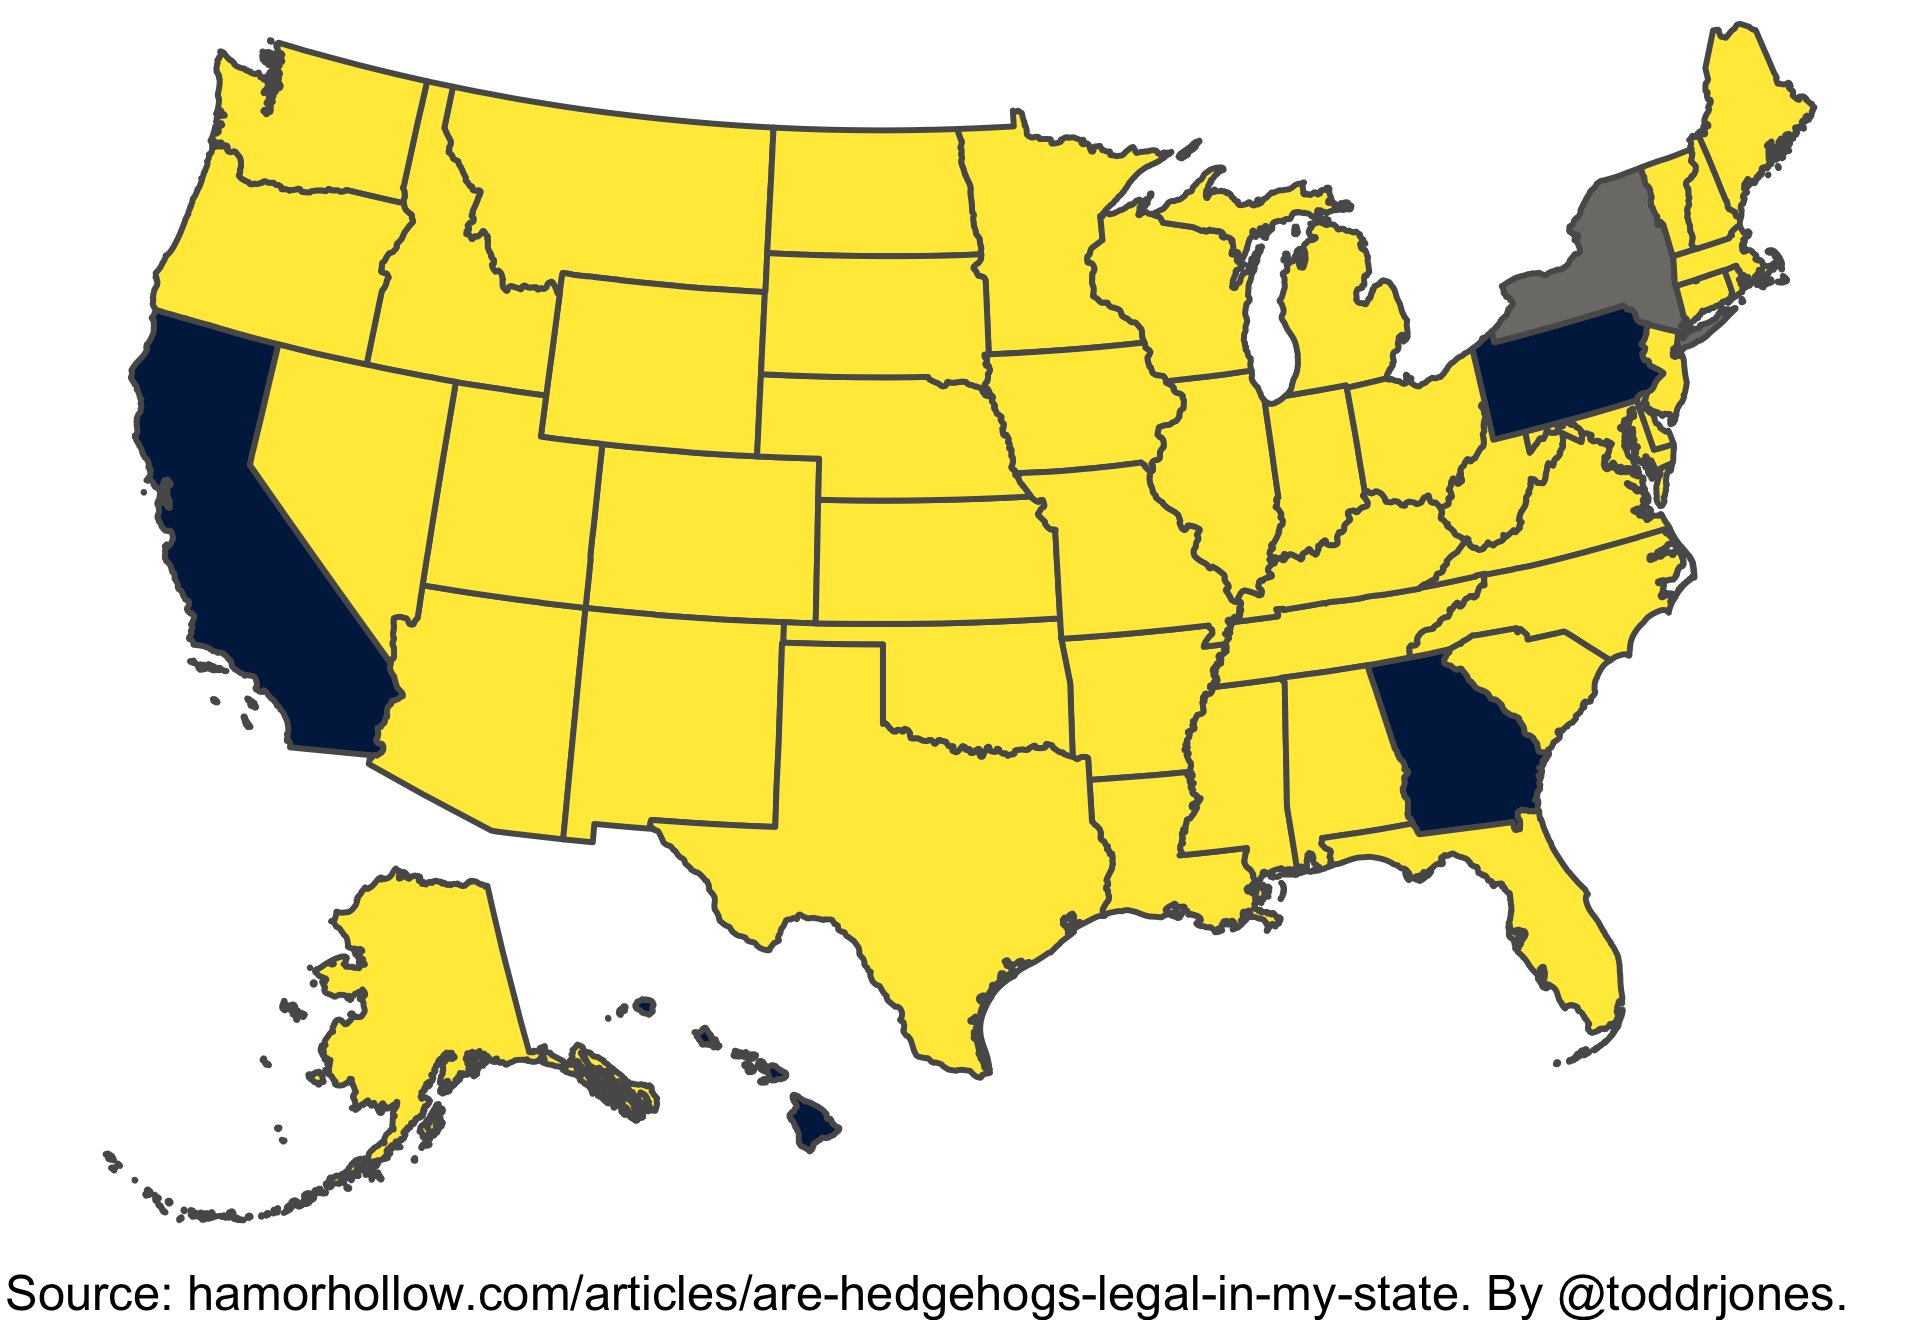
Note: It is legal in New York State except for the five Boroughs of New York City.
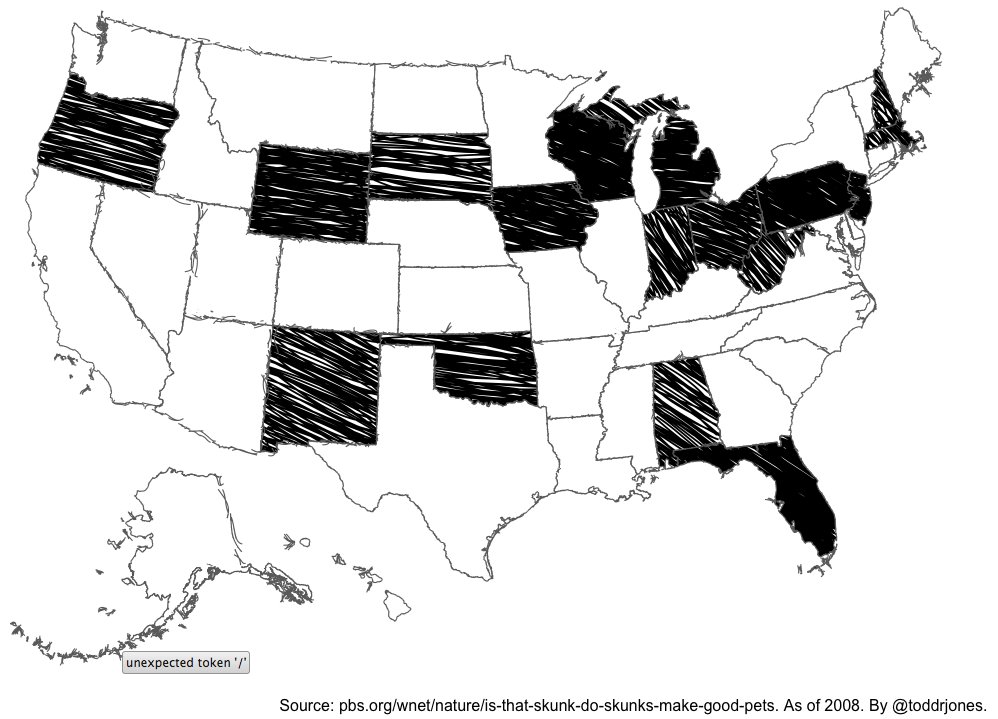
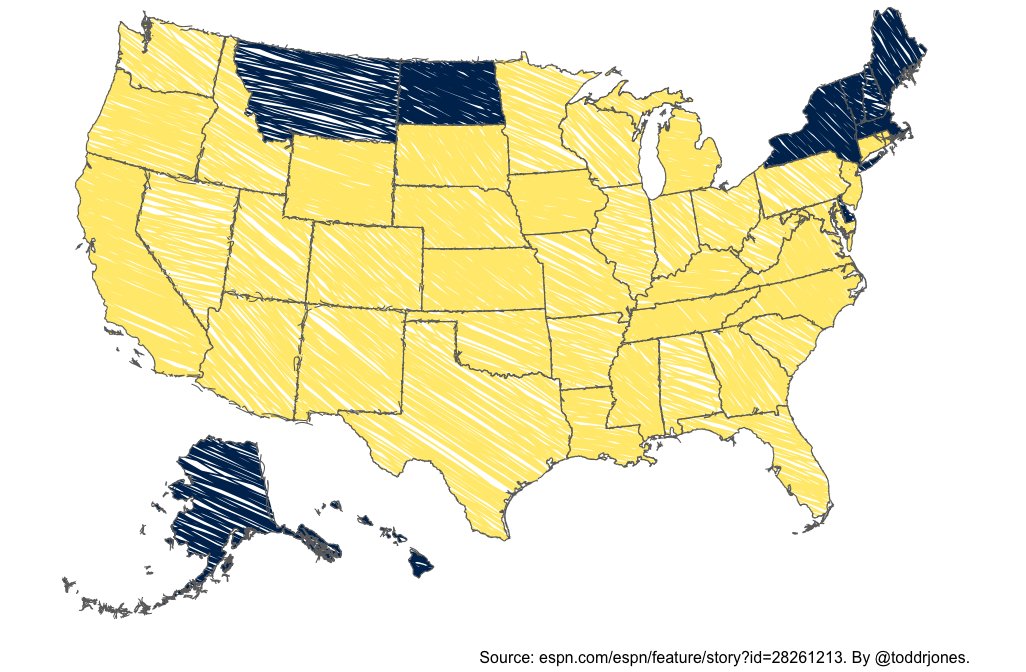
In the Black States It’s Legal To Own An Skunk
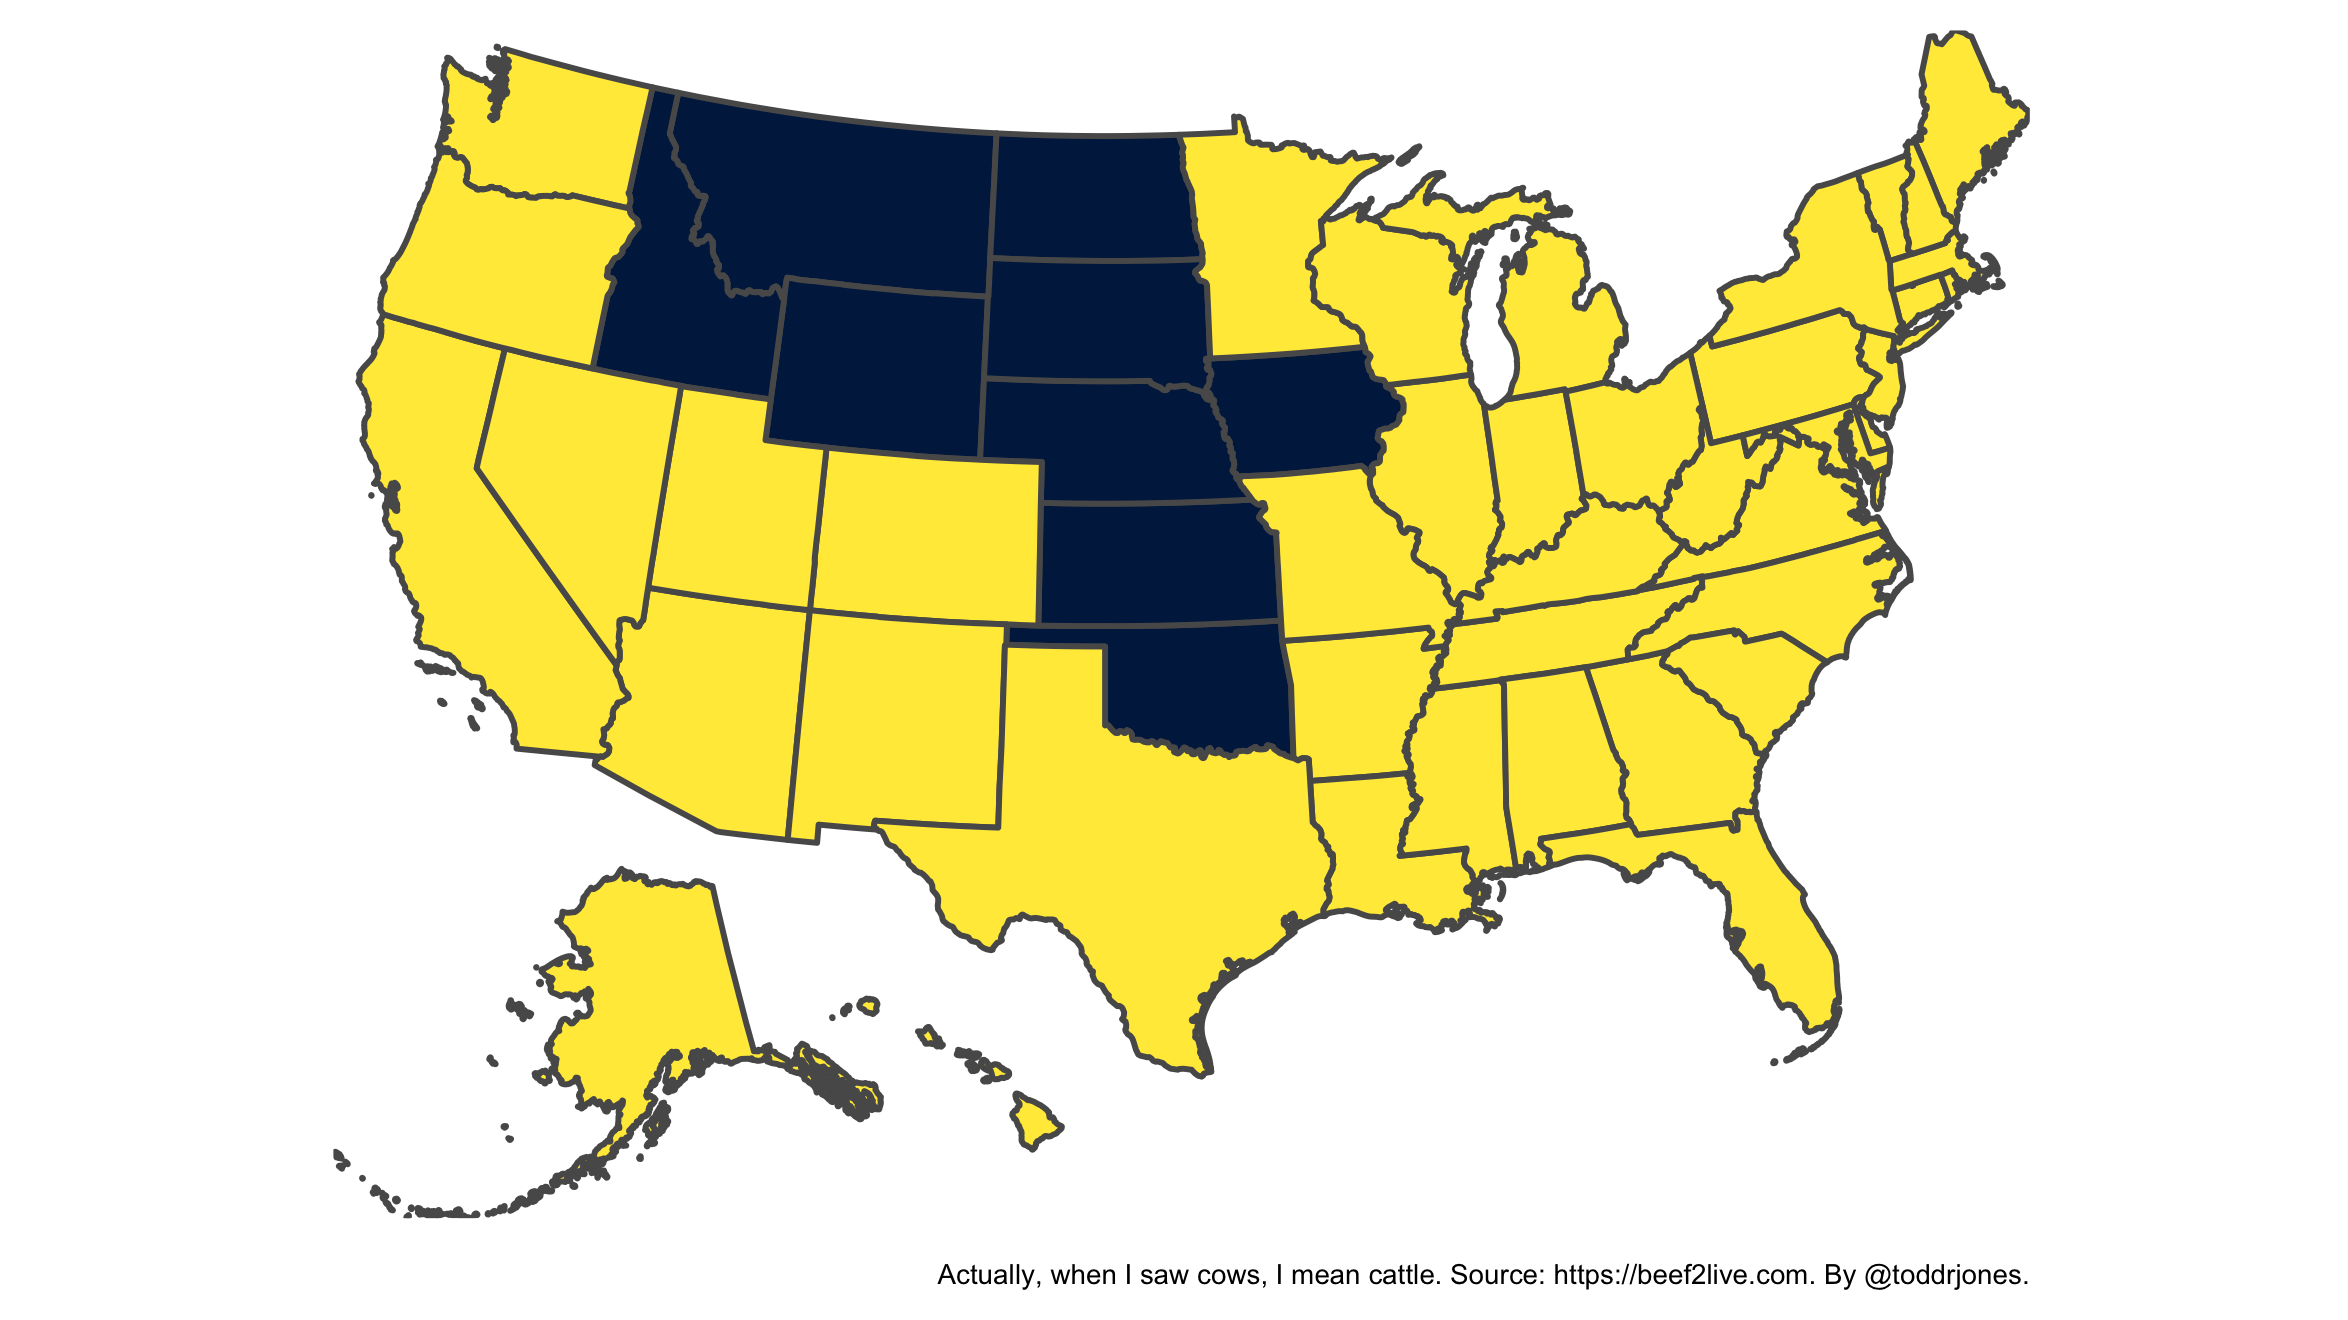
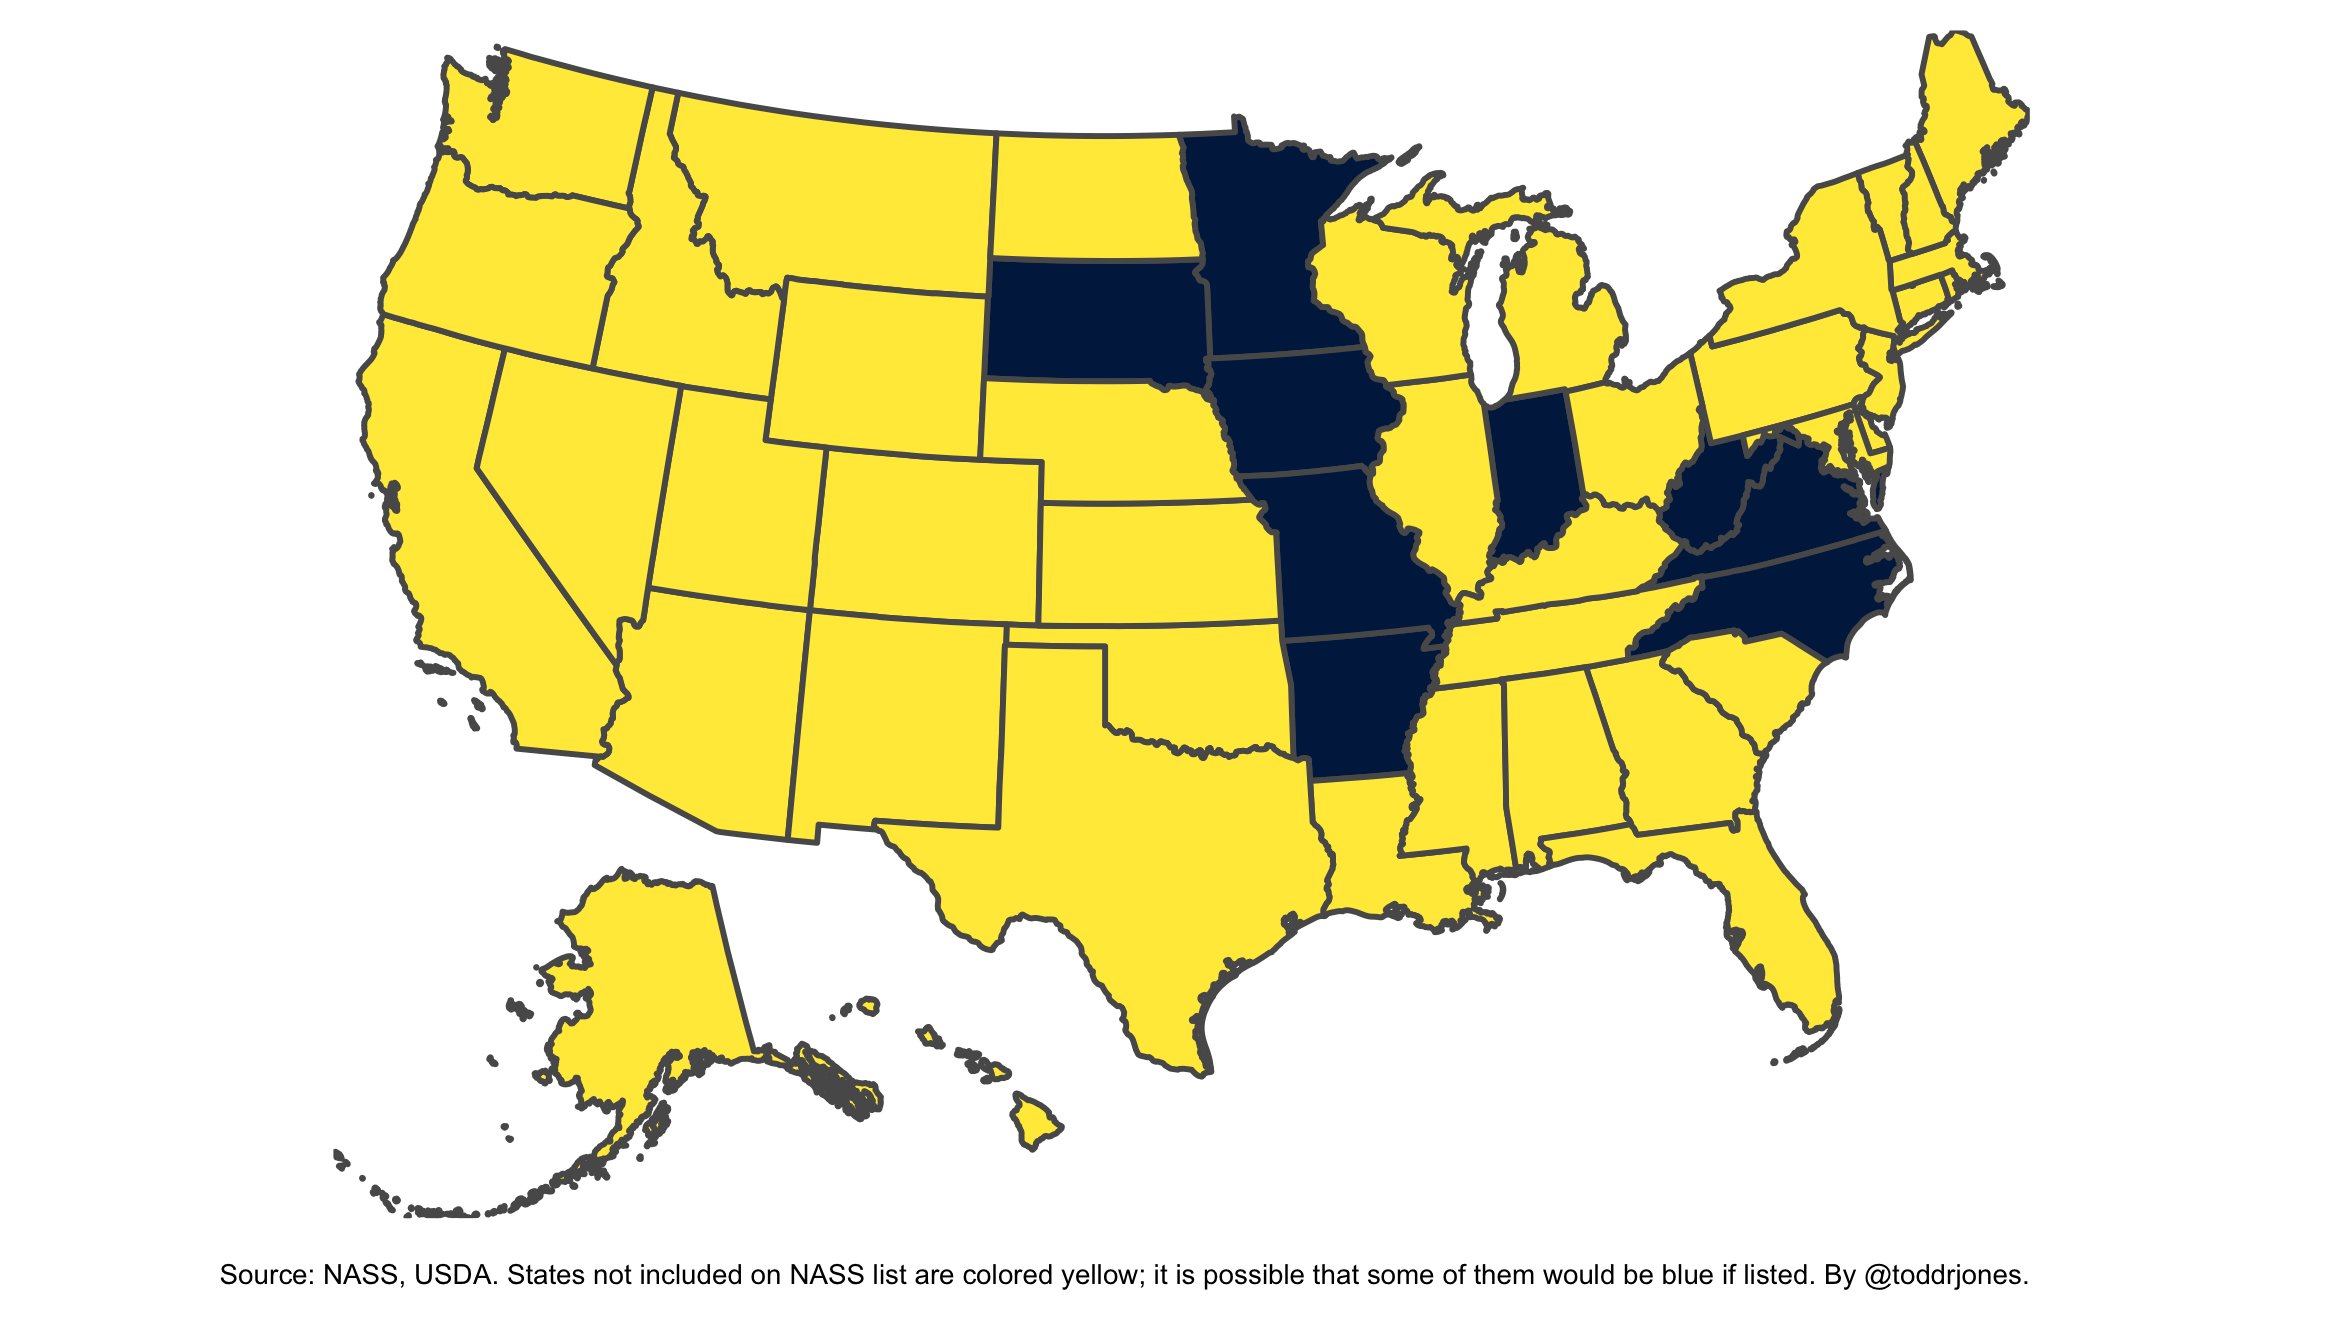
There are more cows than people in the Dark Blue States
The blue states have more turkeys than people
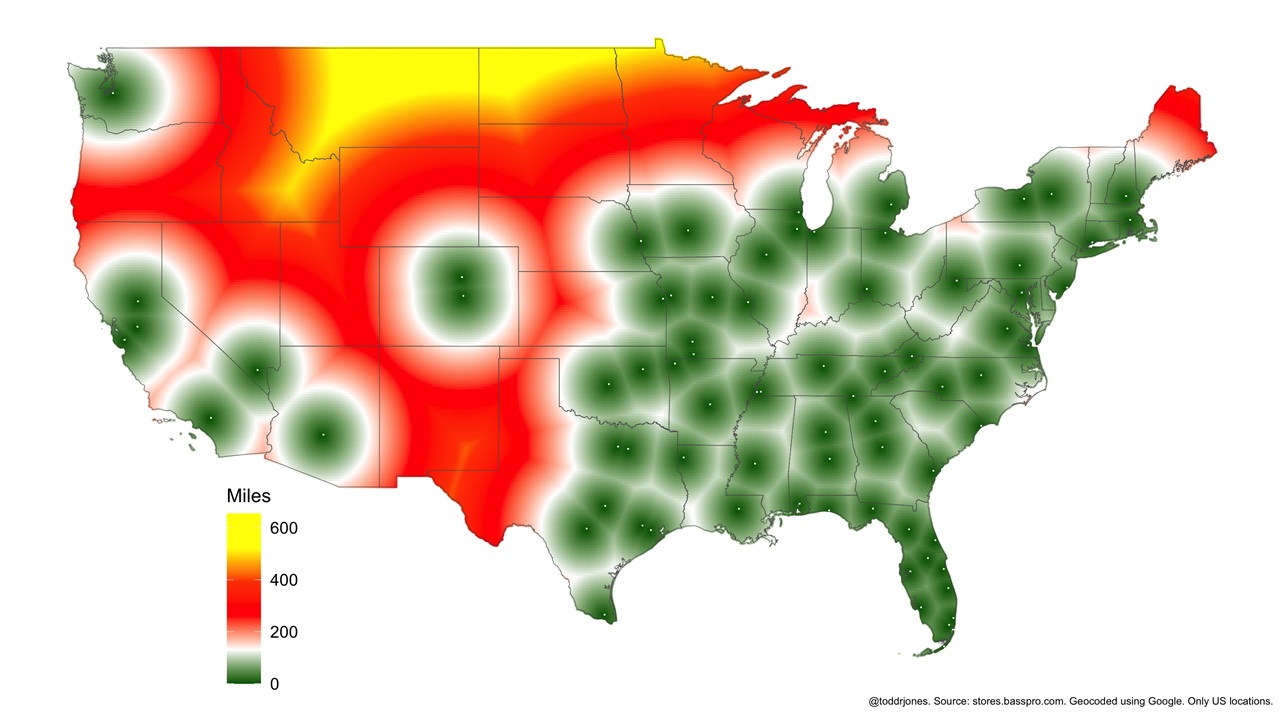
Distance to the nearest Bass Pro Shop
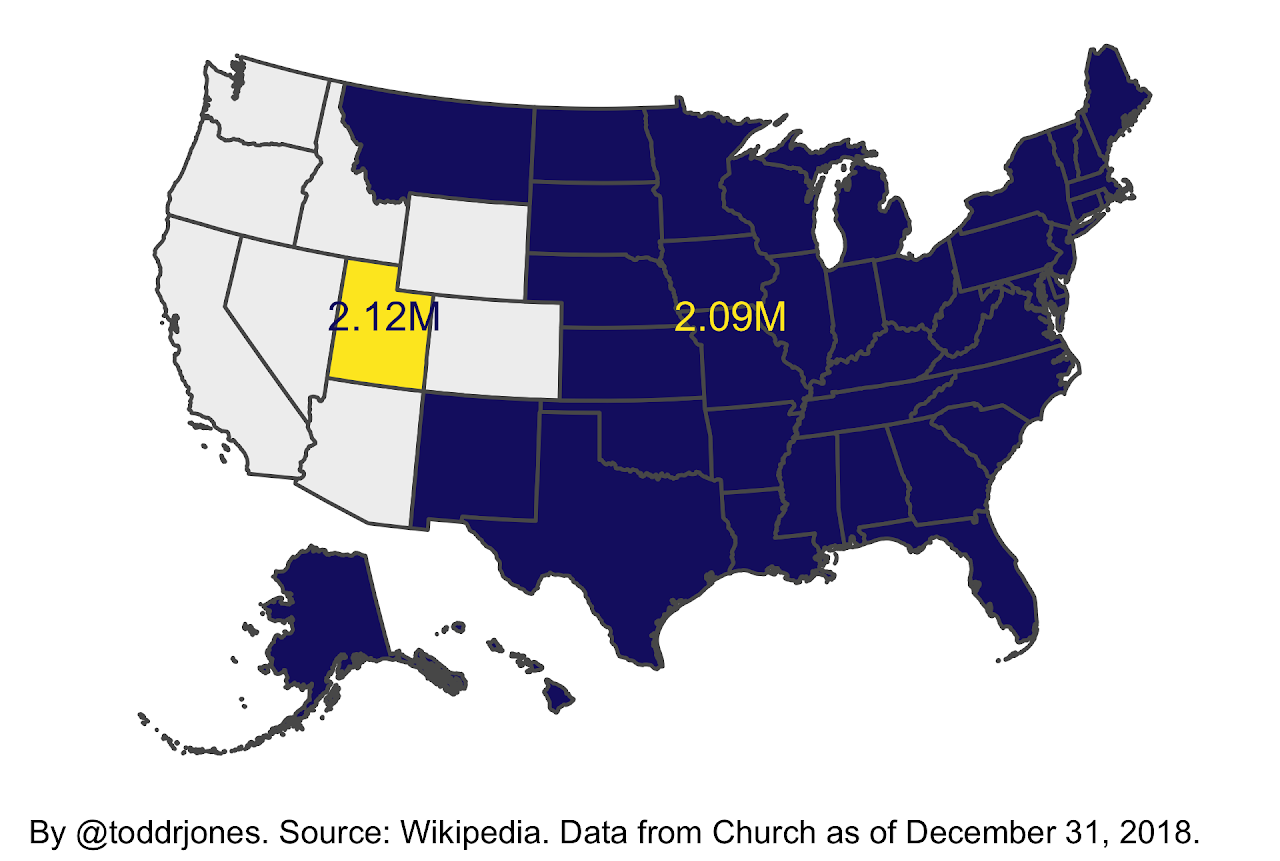
Utah has more Mormons (members of the Church of Jesus Christ of Latter-day Saints) than all the blue states combined
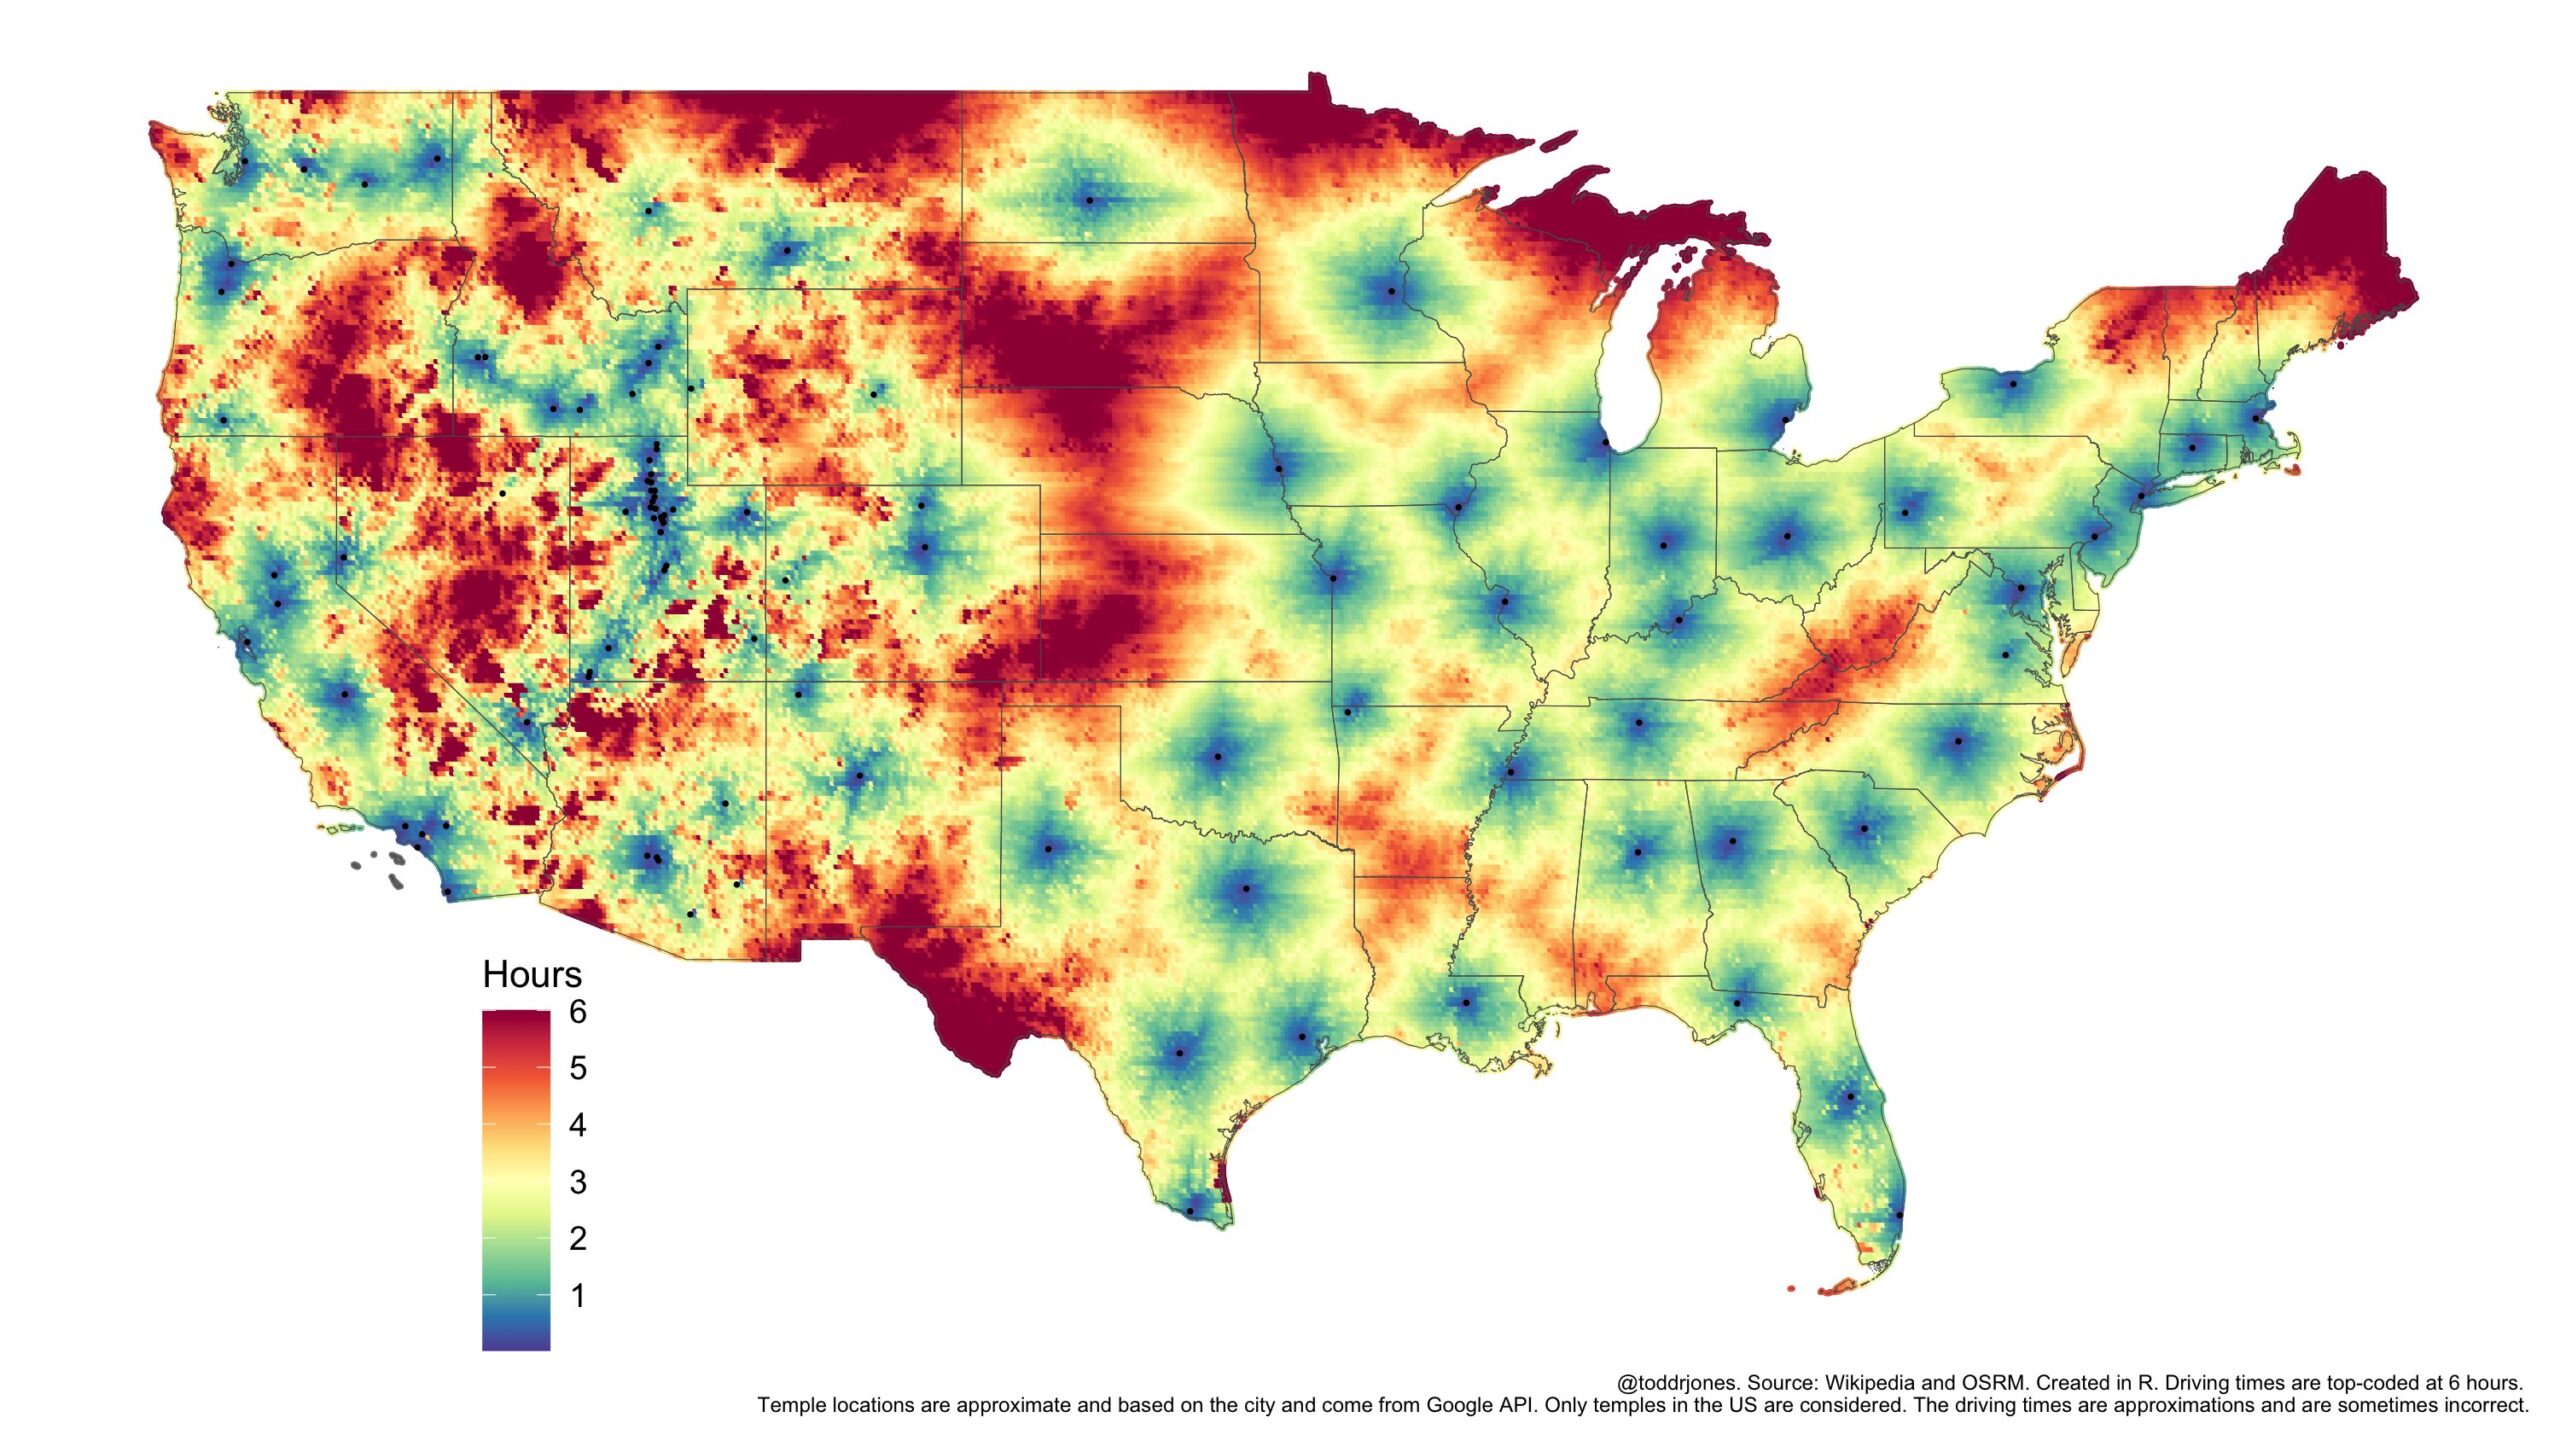
Driving time to nearest Latter-day Saint (Mormon) Temple
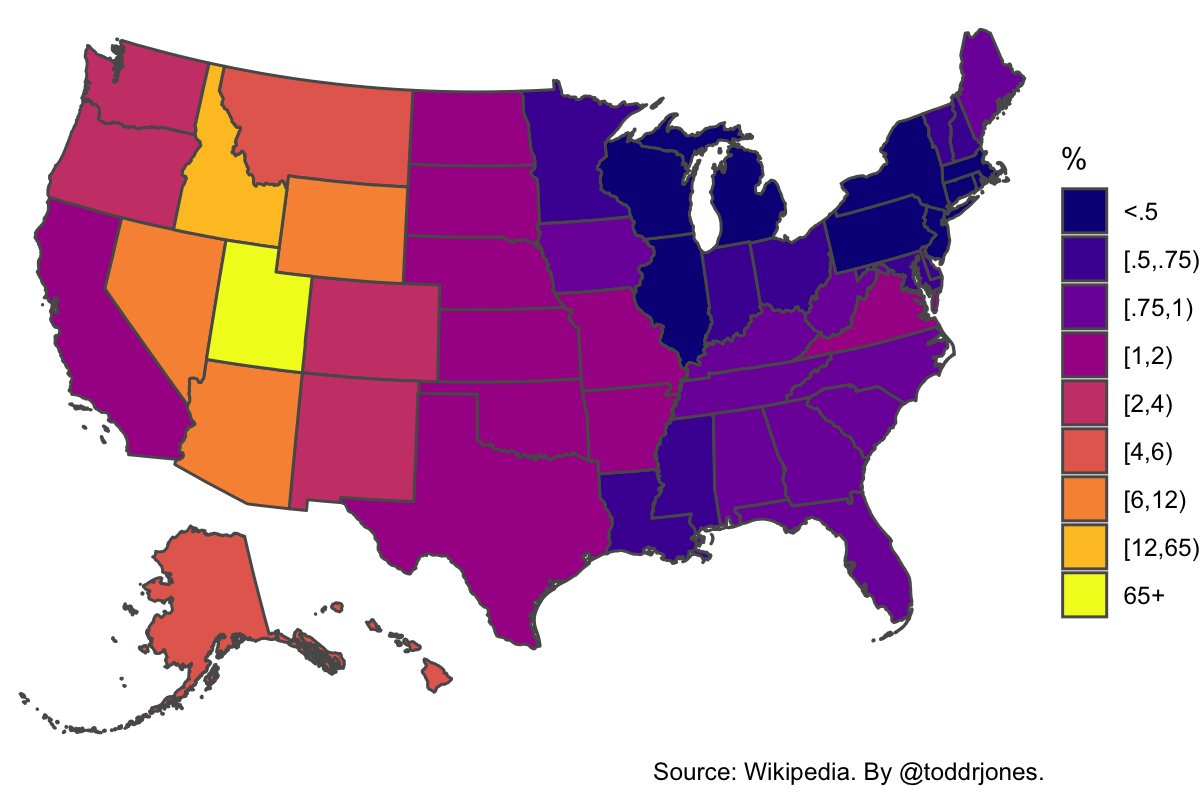
% of a state’s population who are members of the Church of Jesus Christ of Latter-day Saints
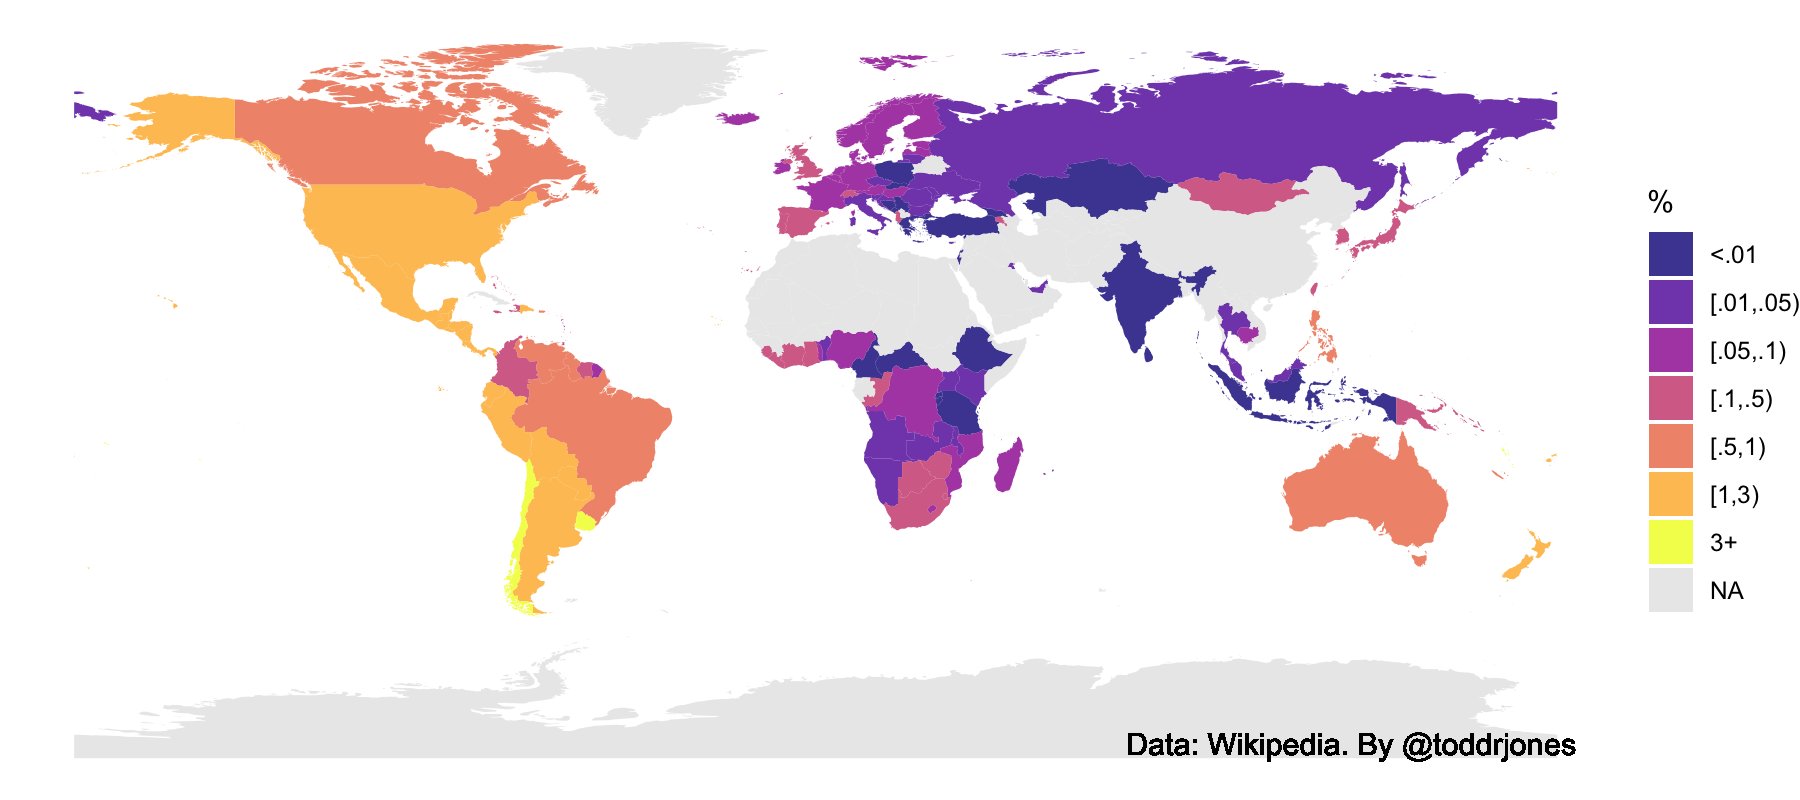
% of a country’s population who are members of the Church of Jesus Christ of Latter-day Saints
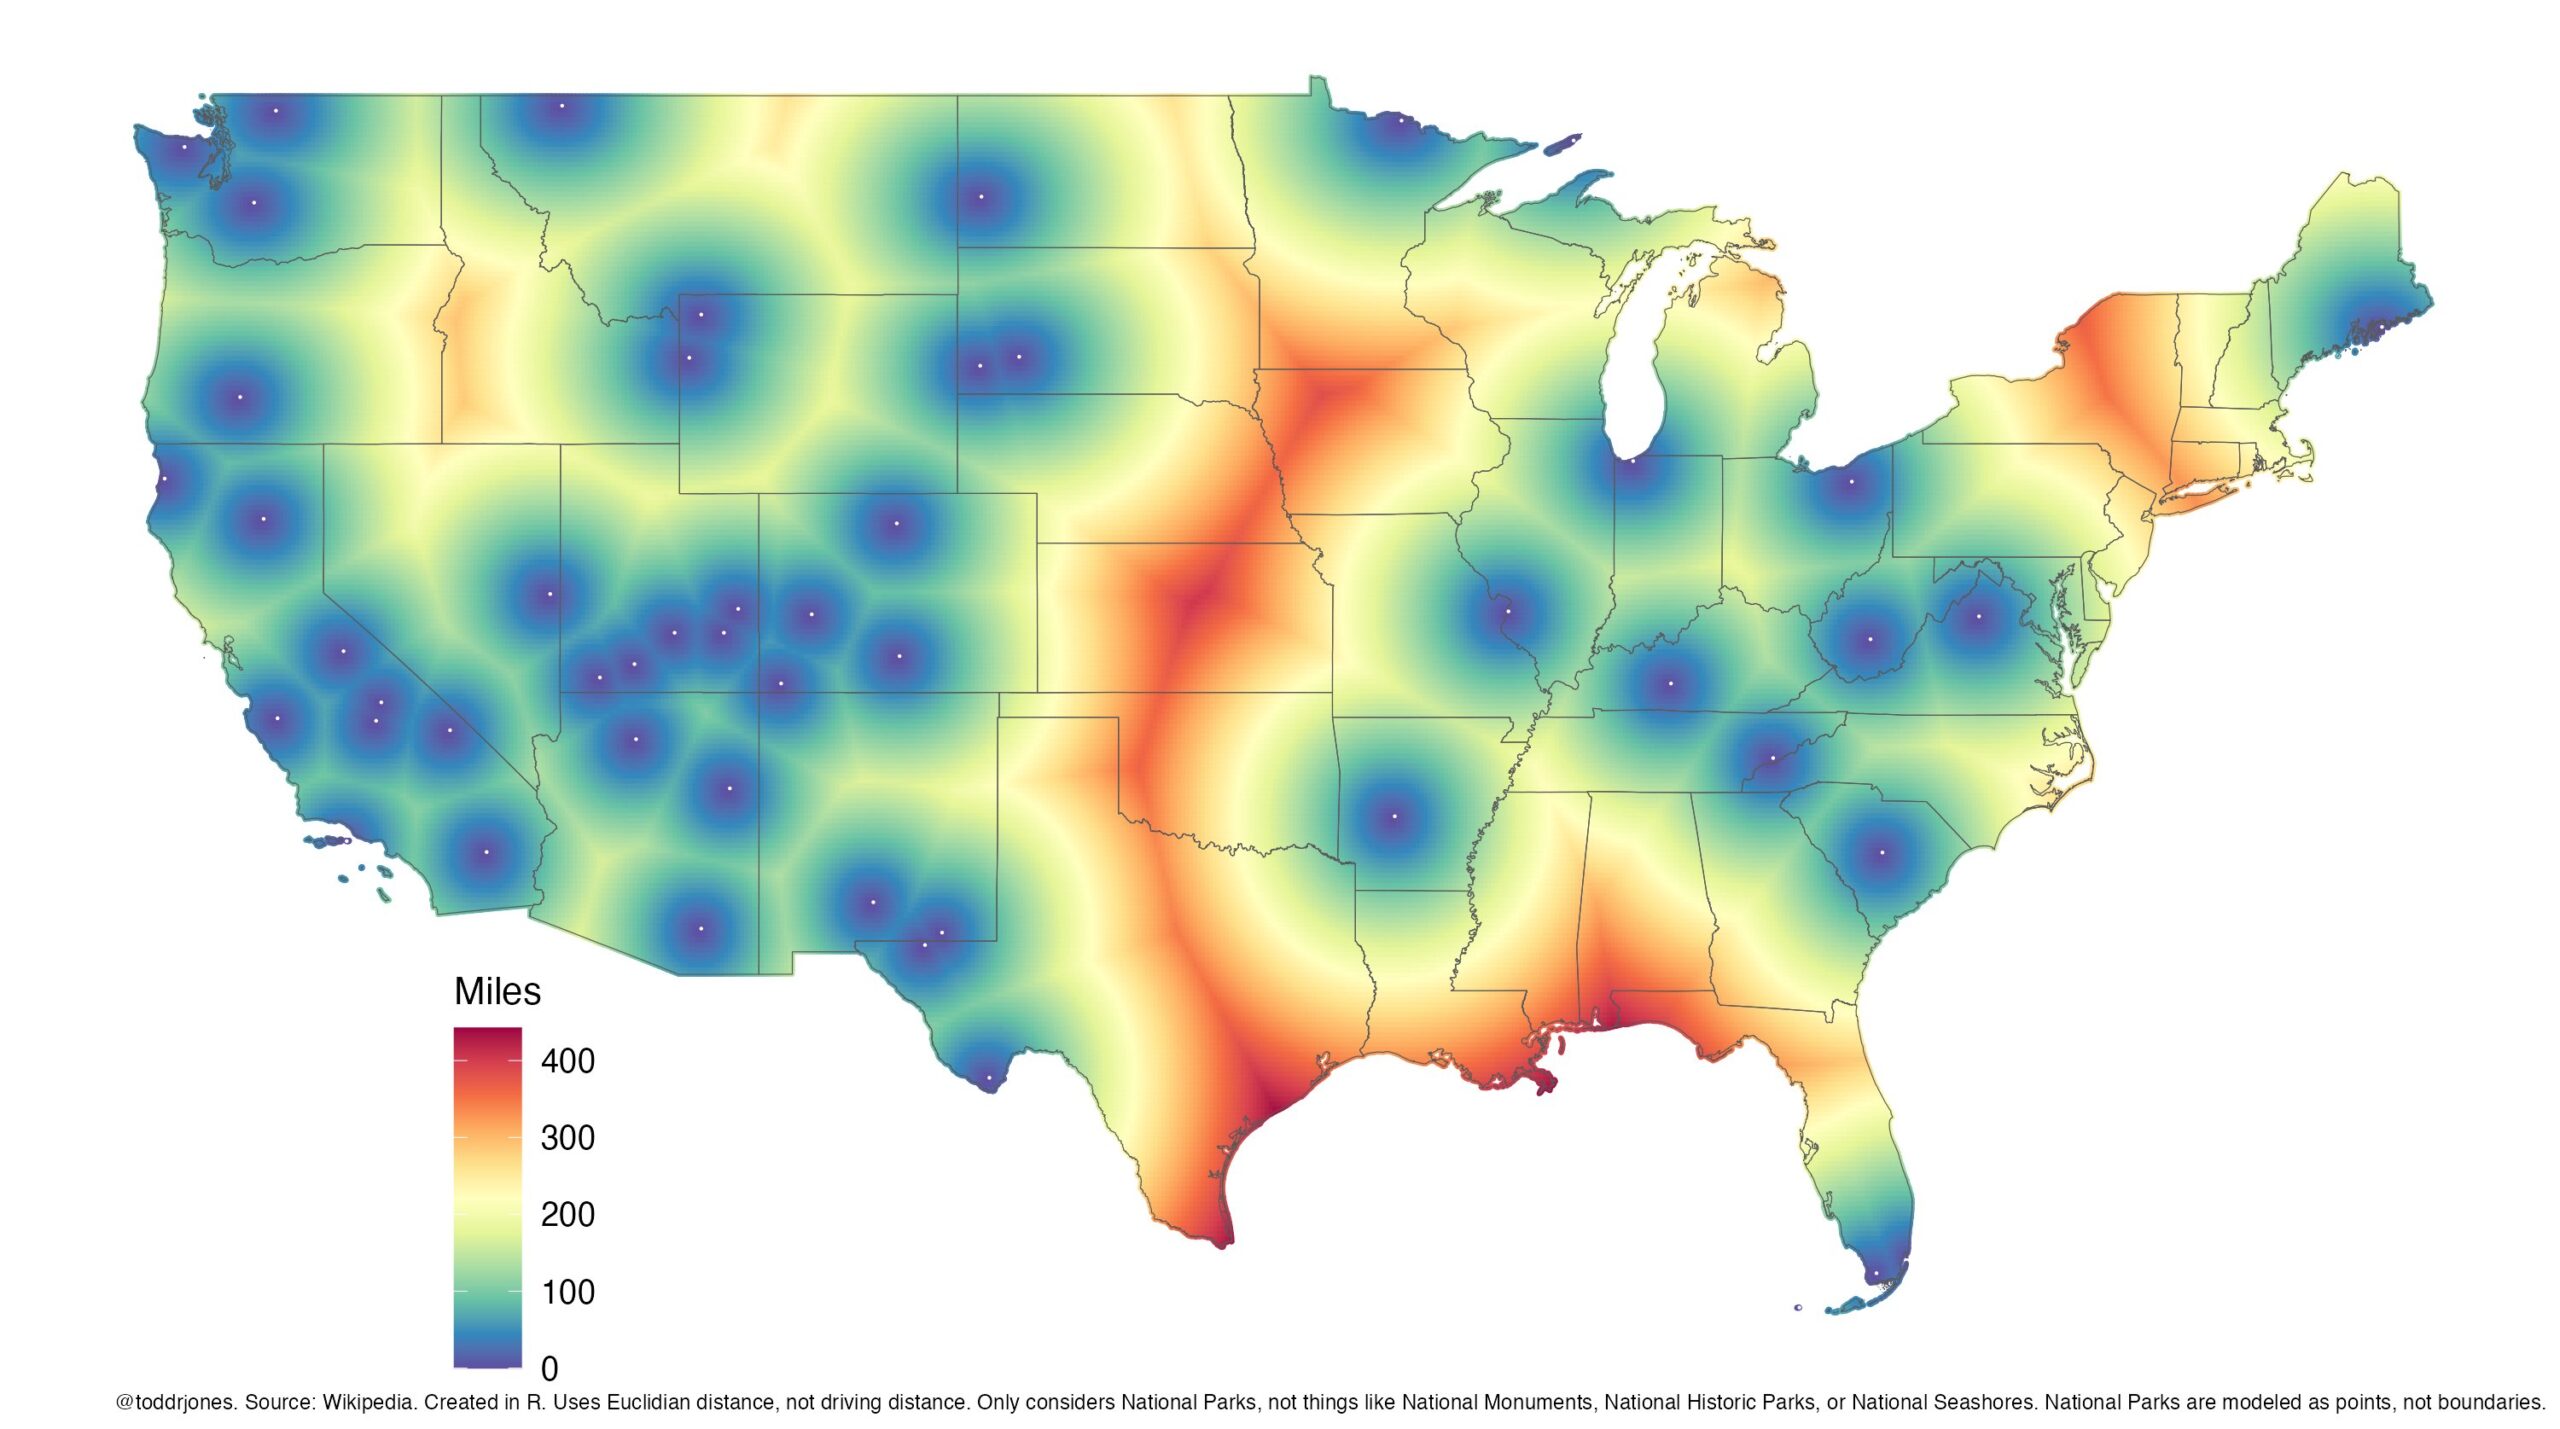
Distance to nearest National Park
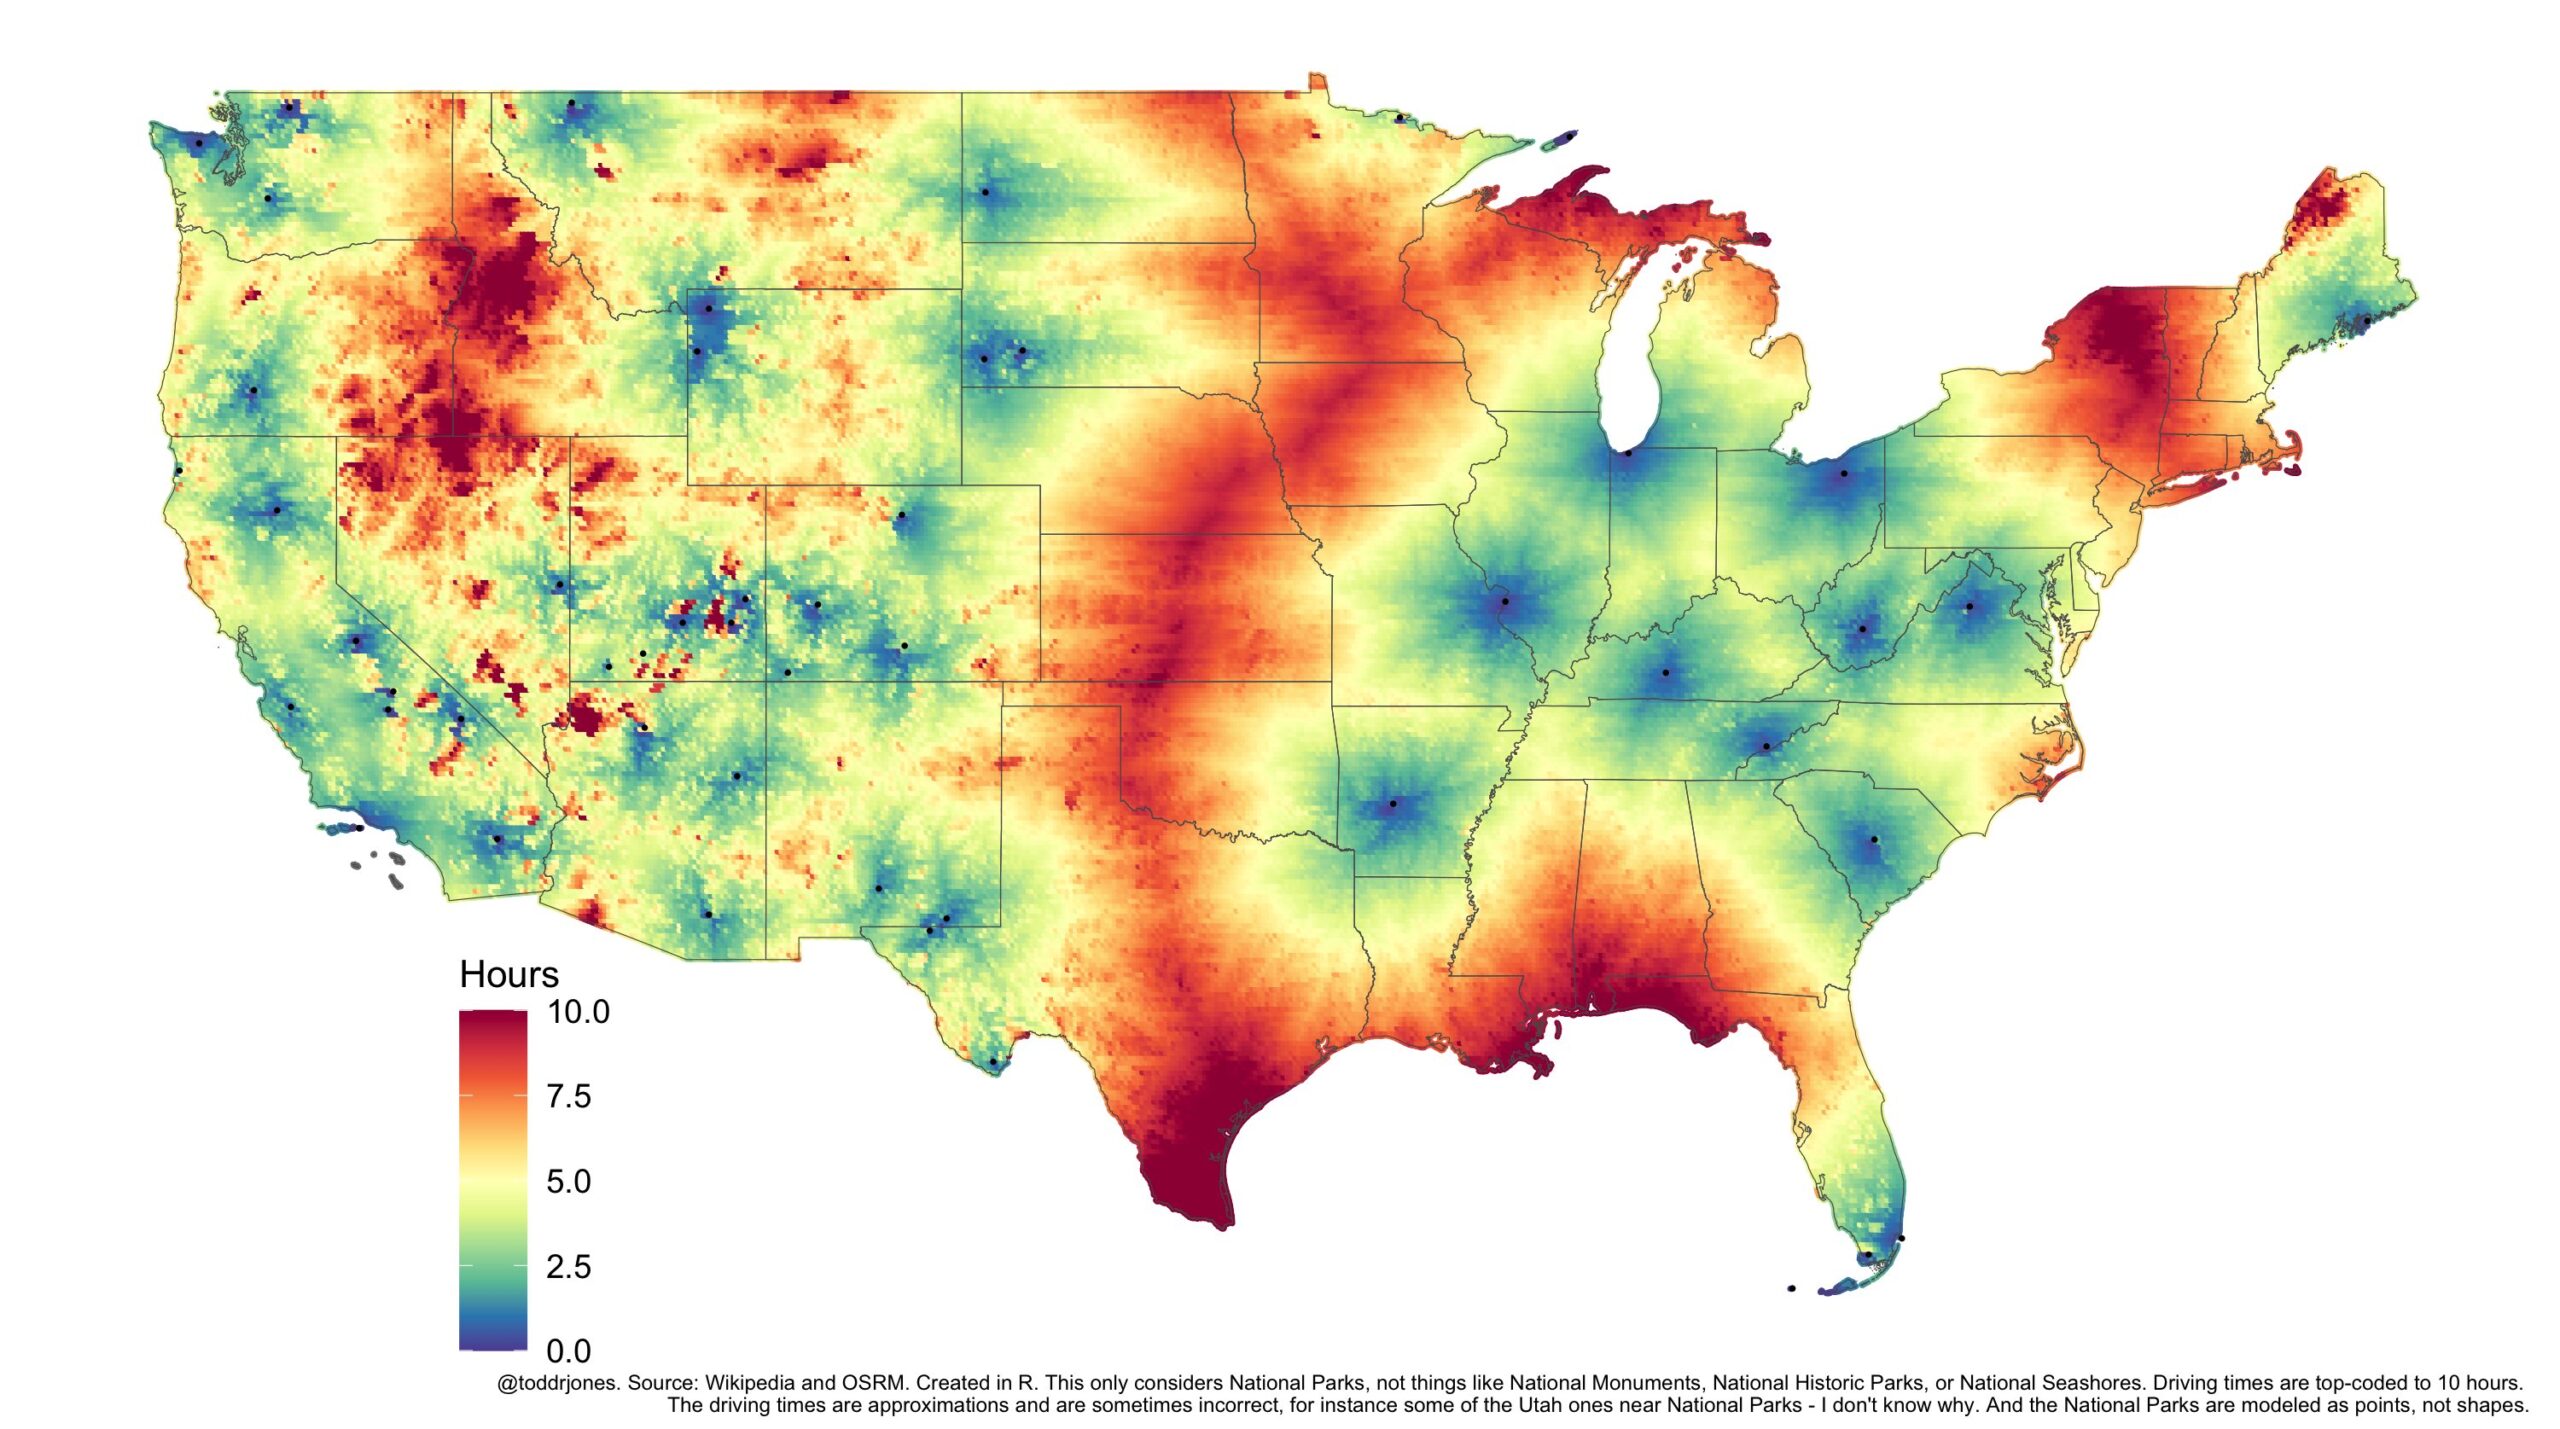
Driving time to nearest National Park
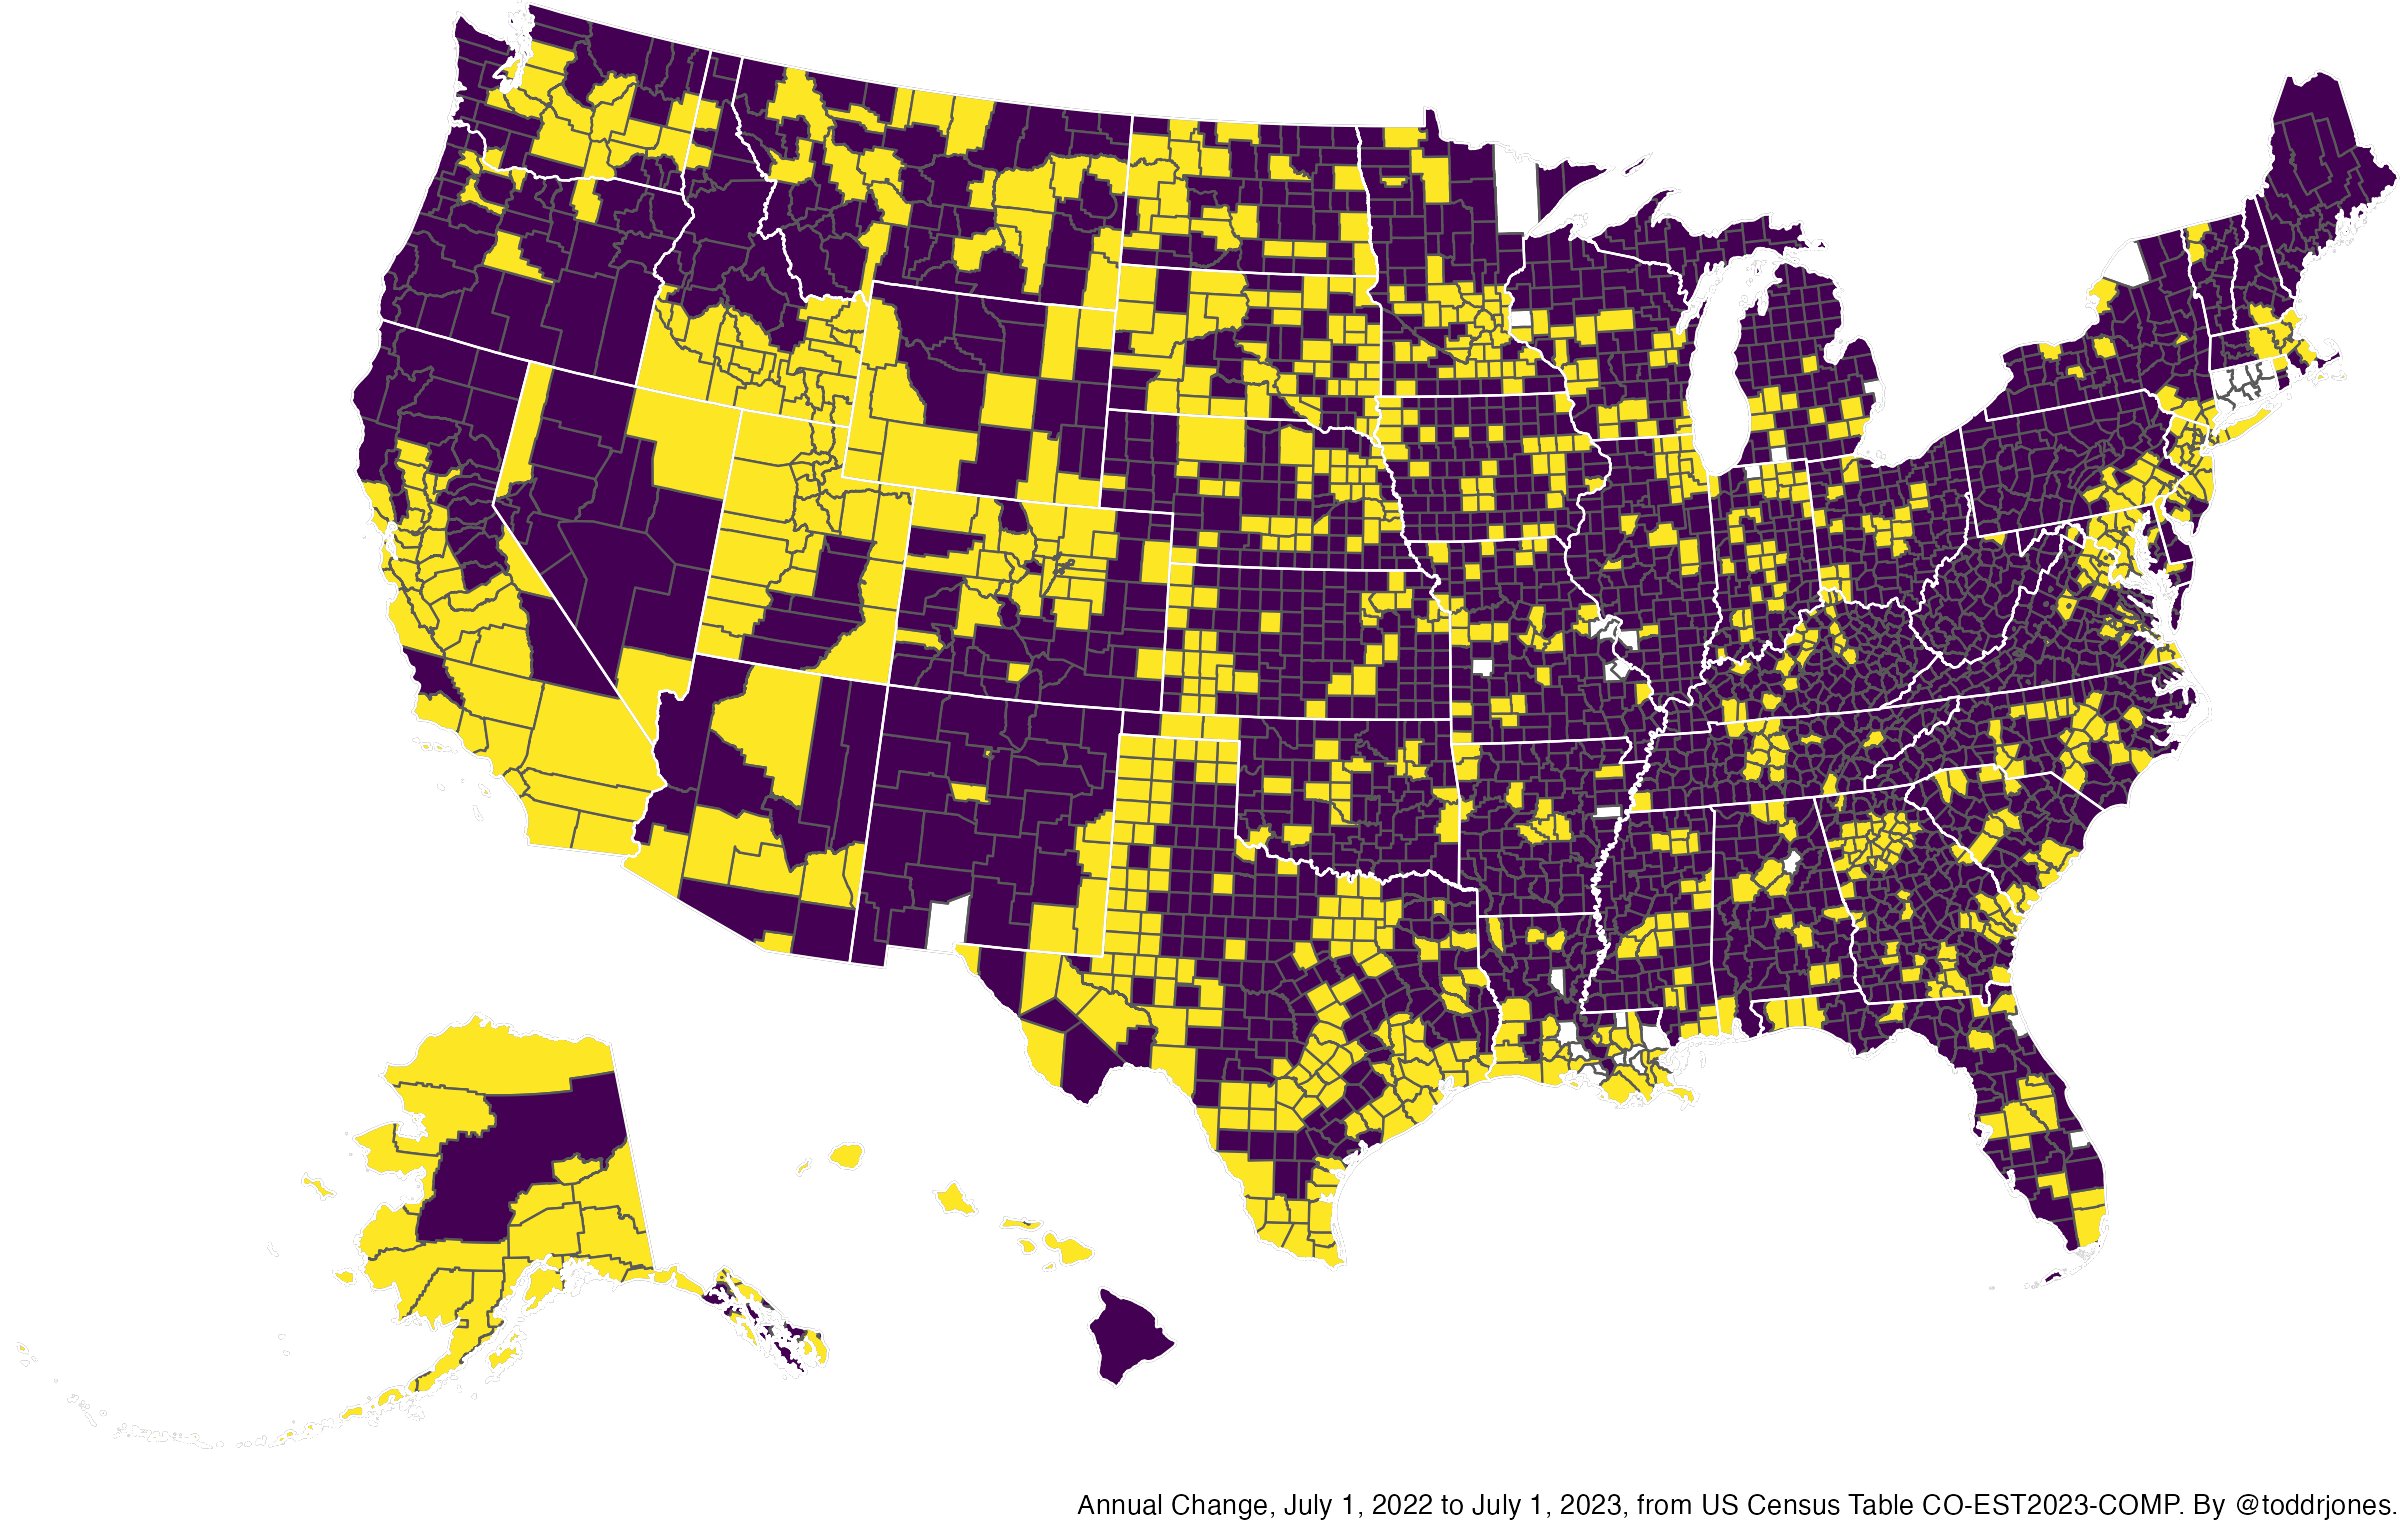
The purple counties had more deaths than births between 2022 and 2023
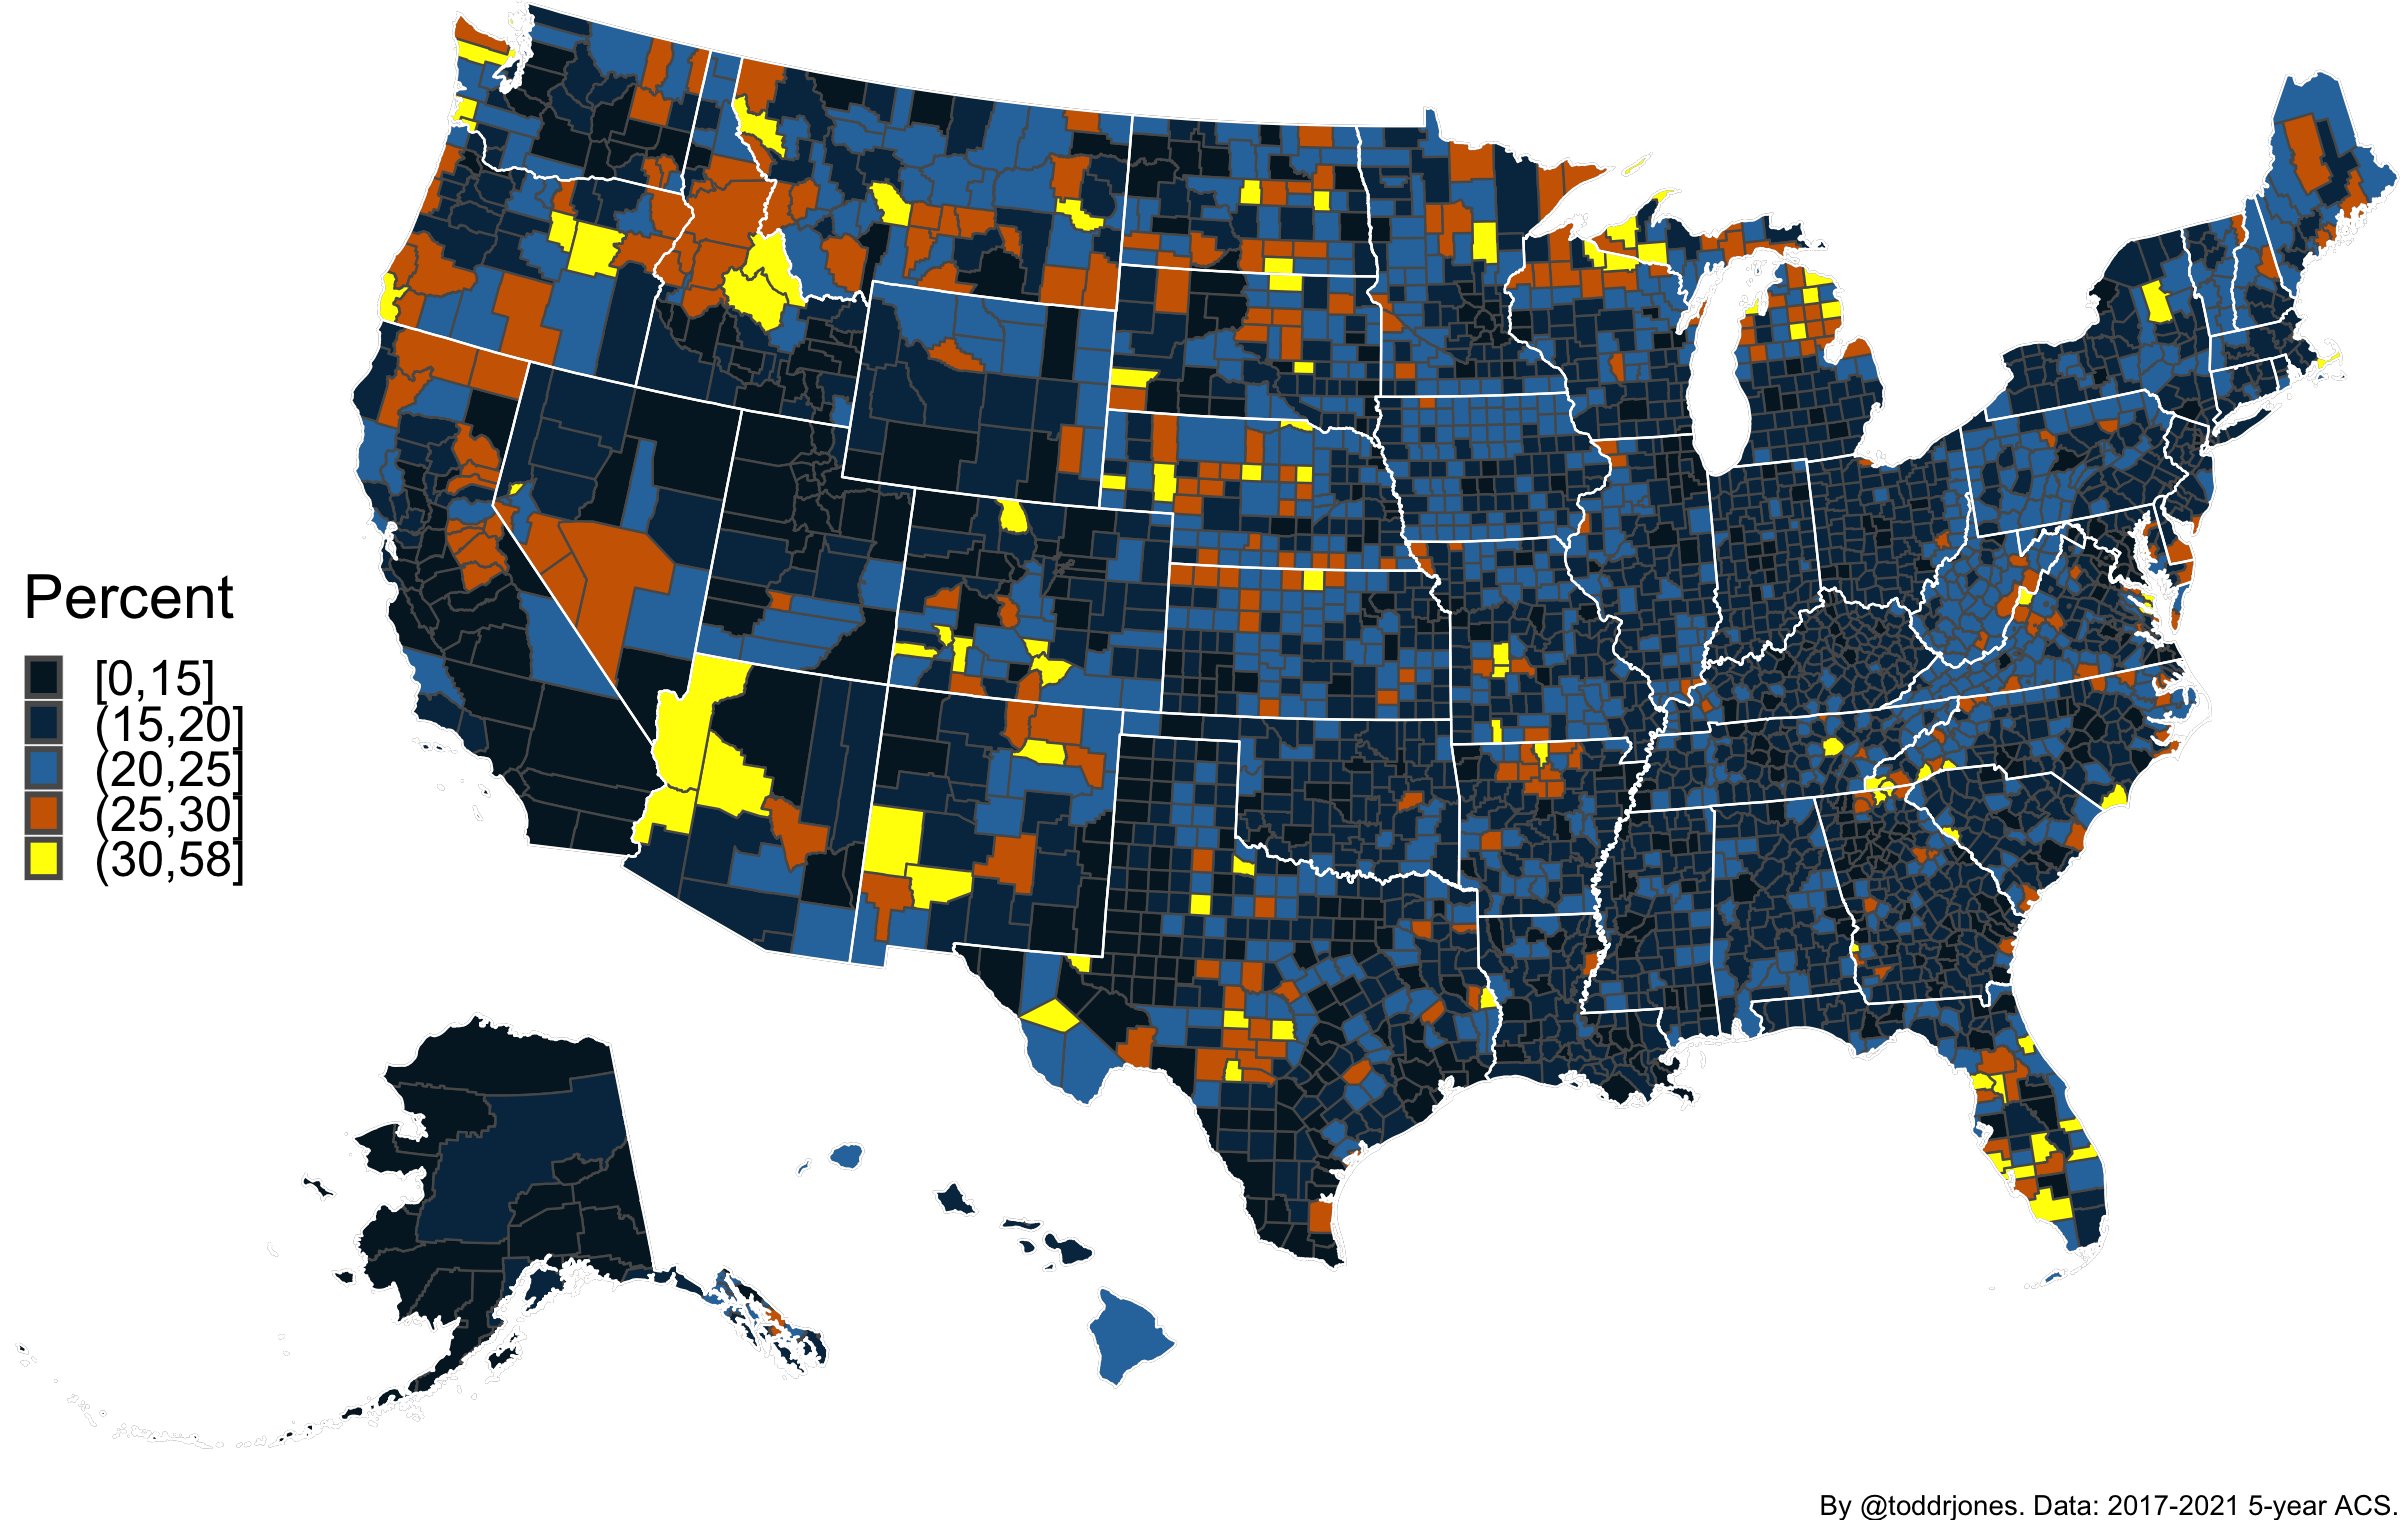
Percentage of each county’s population who are 65 and older
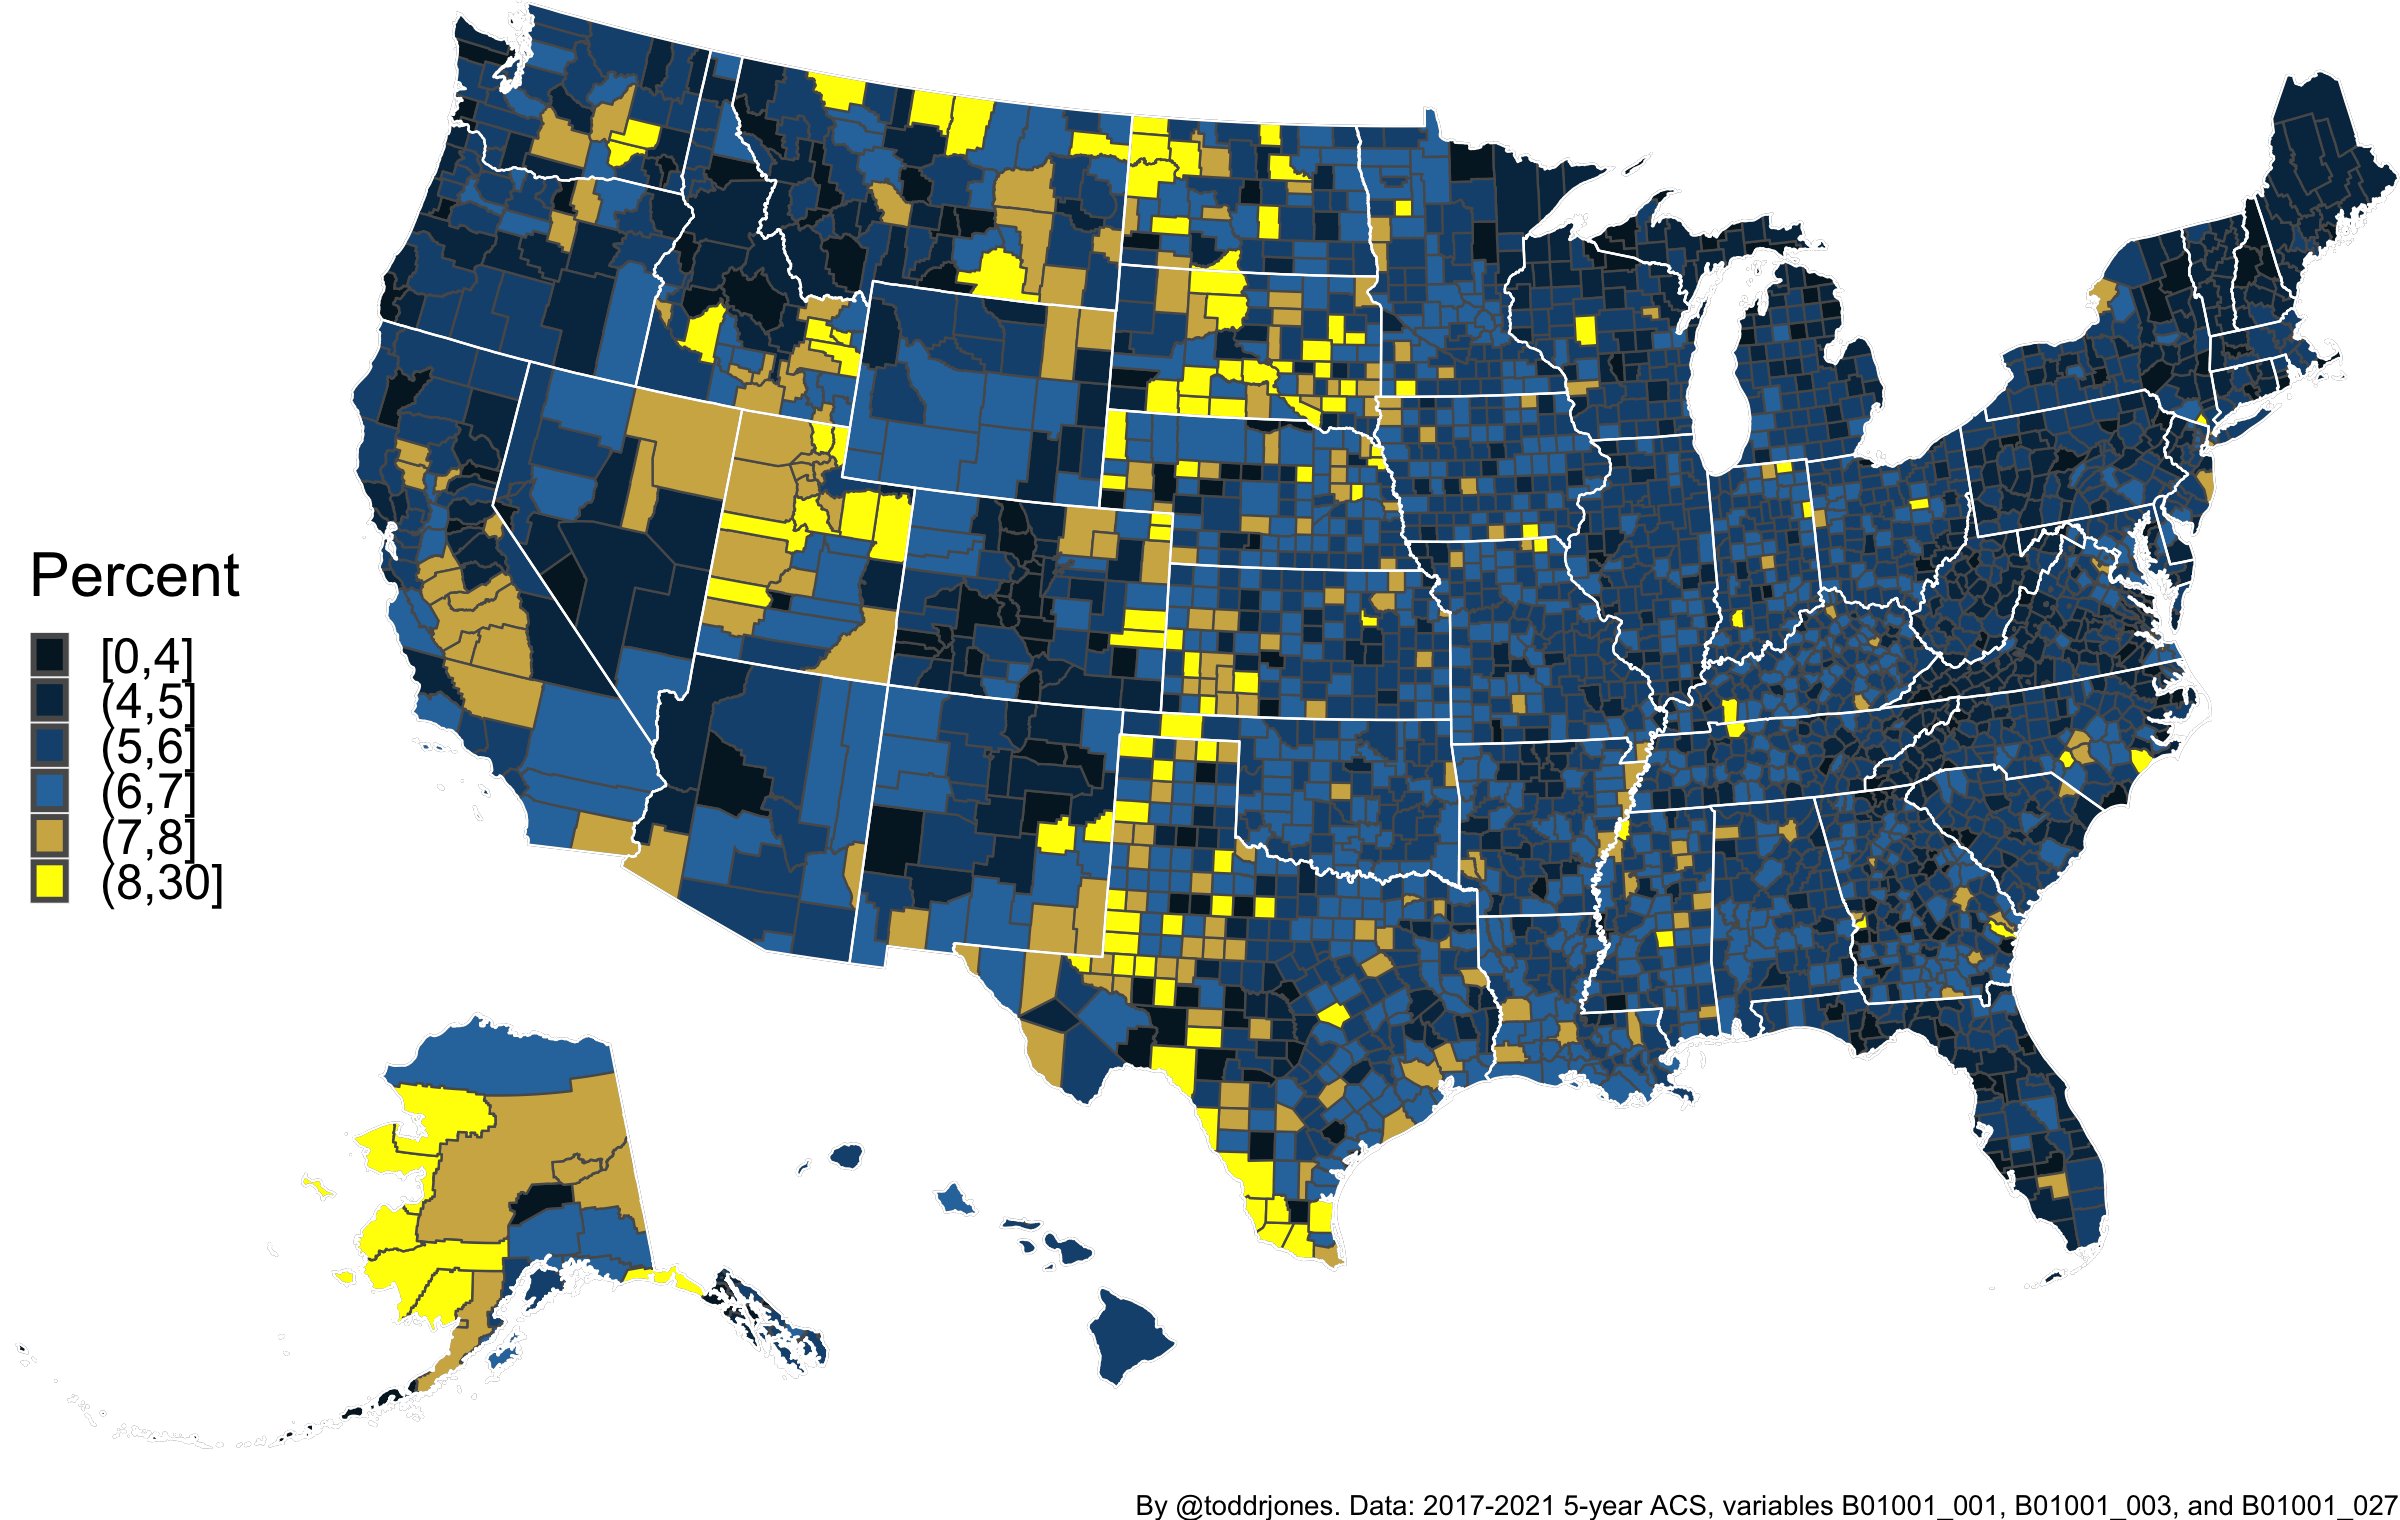
Percentage of population under 5 years old
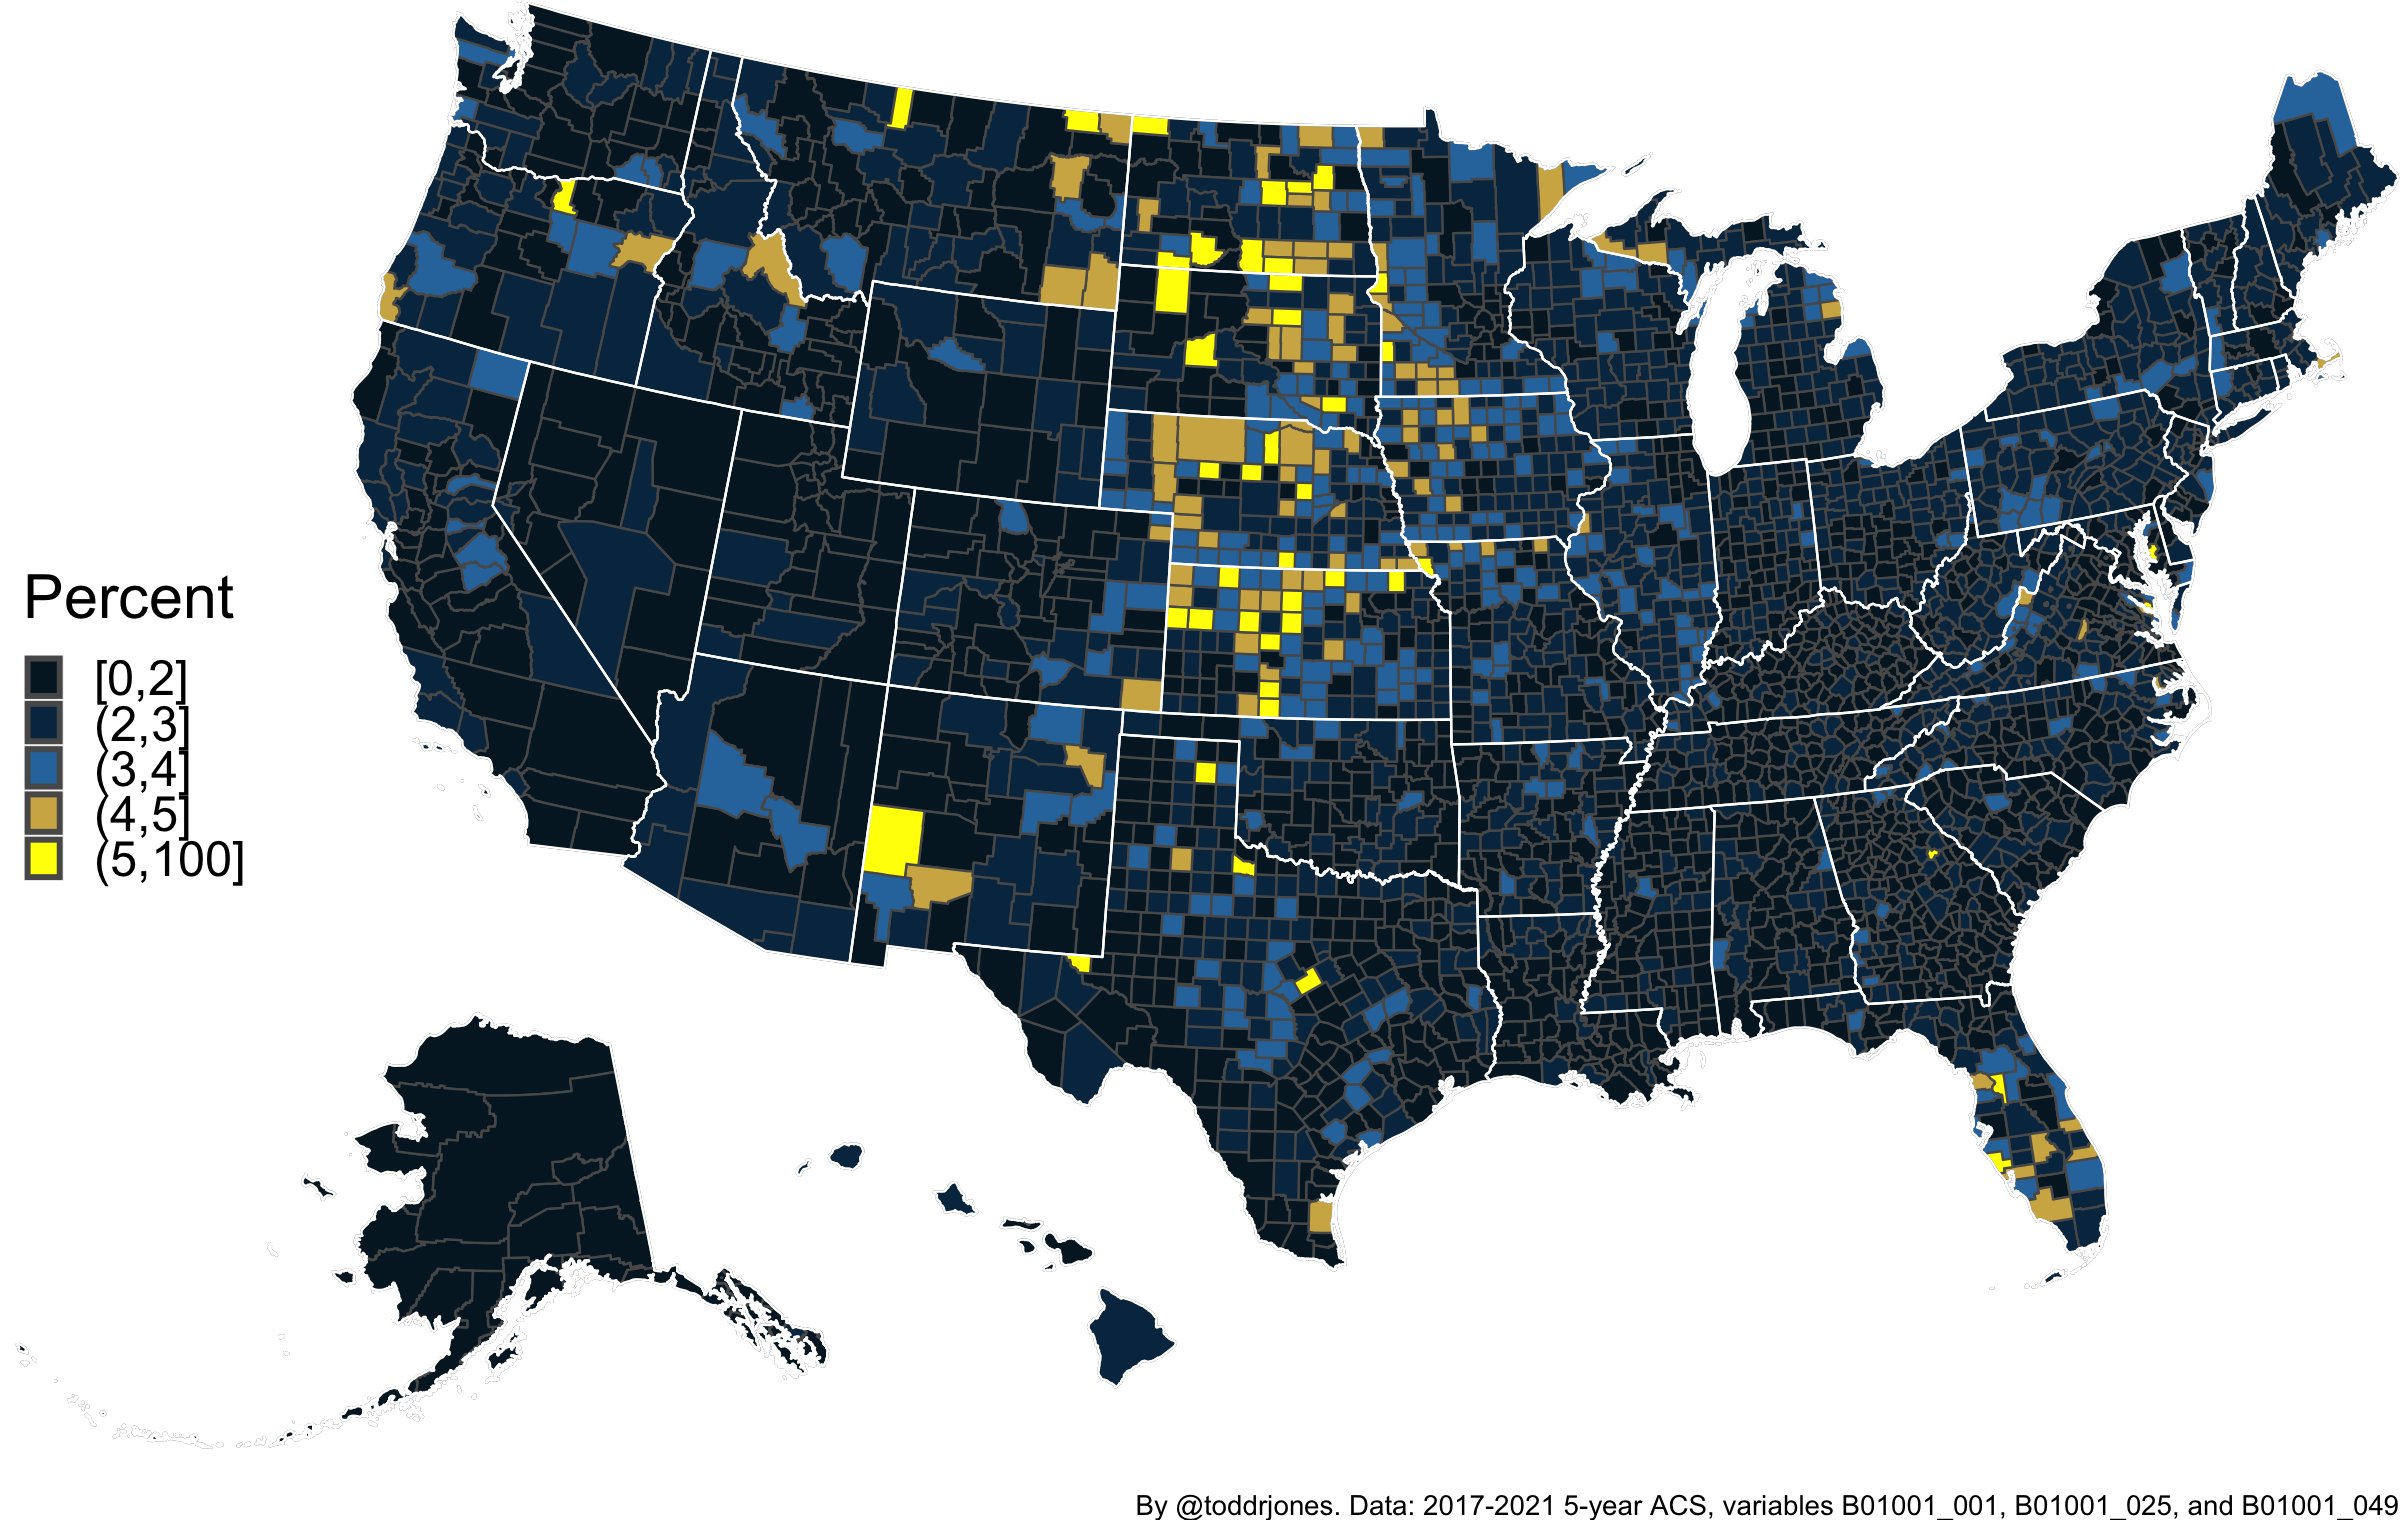
Percentage of county population 85 and older
In The Yellow States the highest paid public employee is a college football or basketball coach
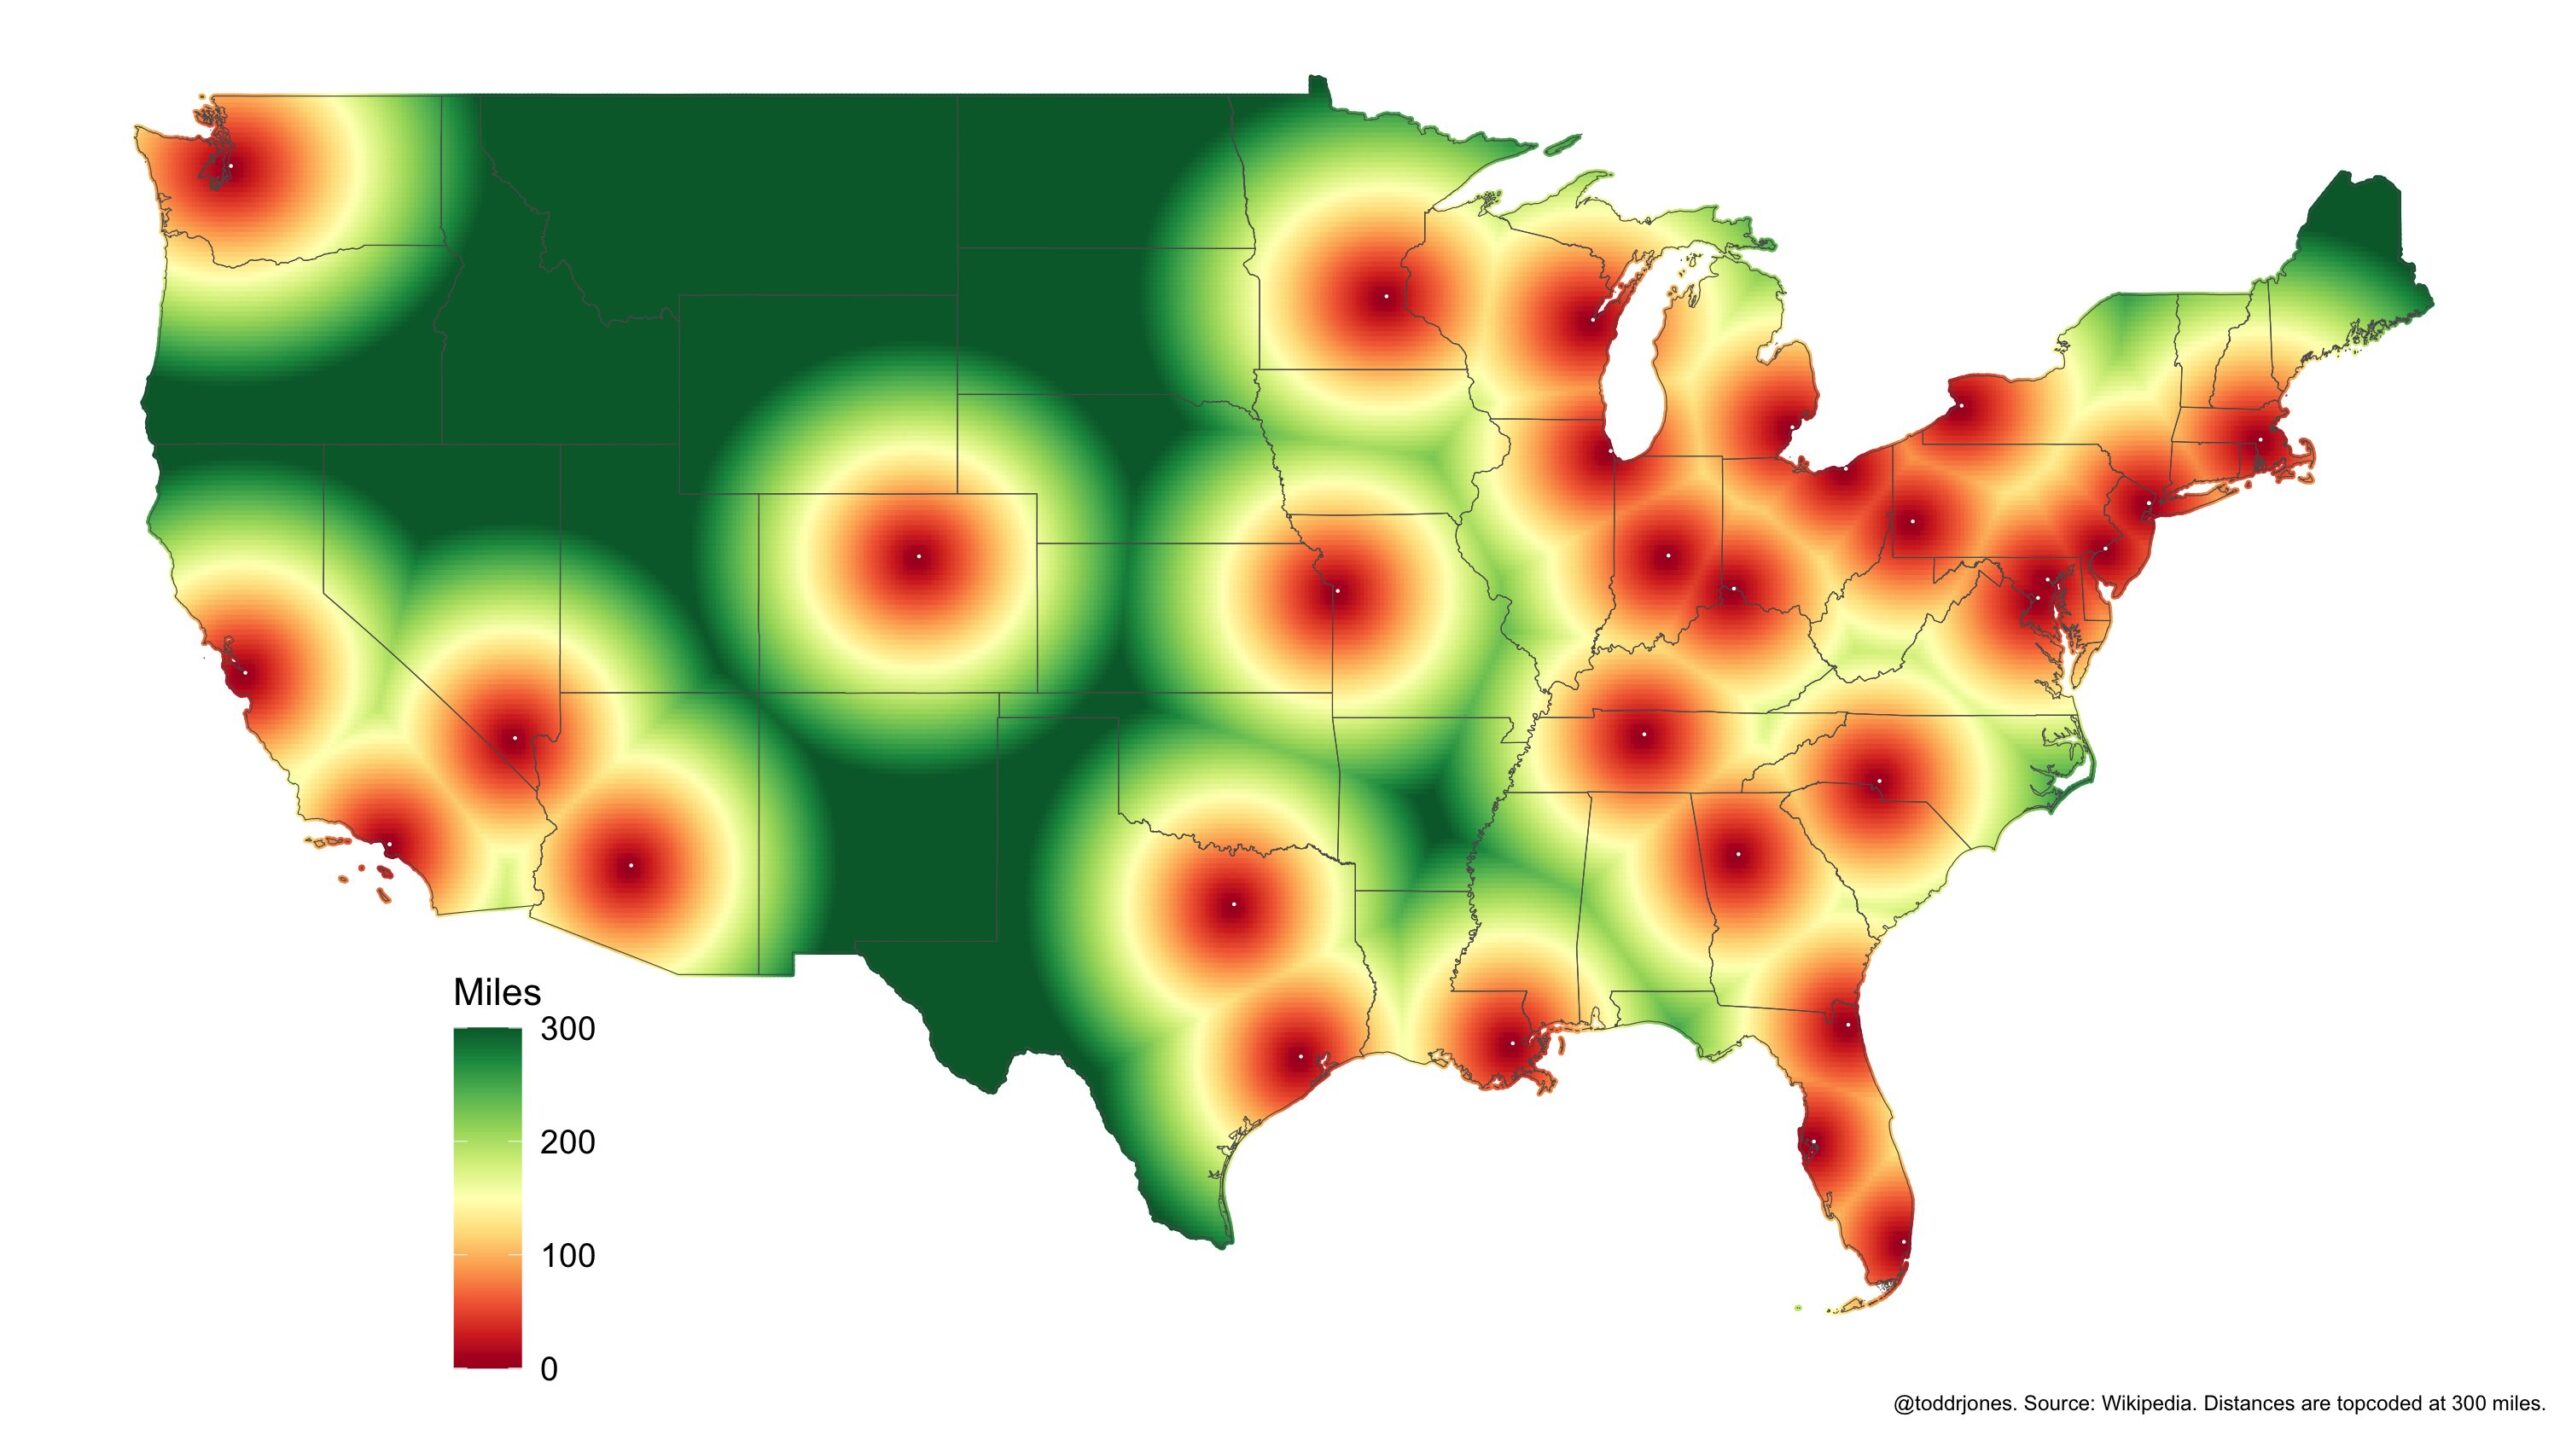
Distance to nearest NFL stadium
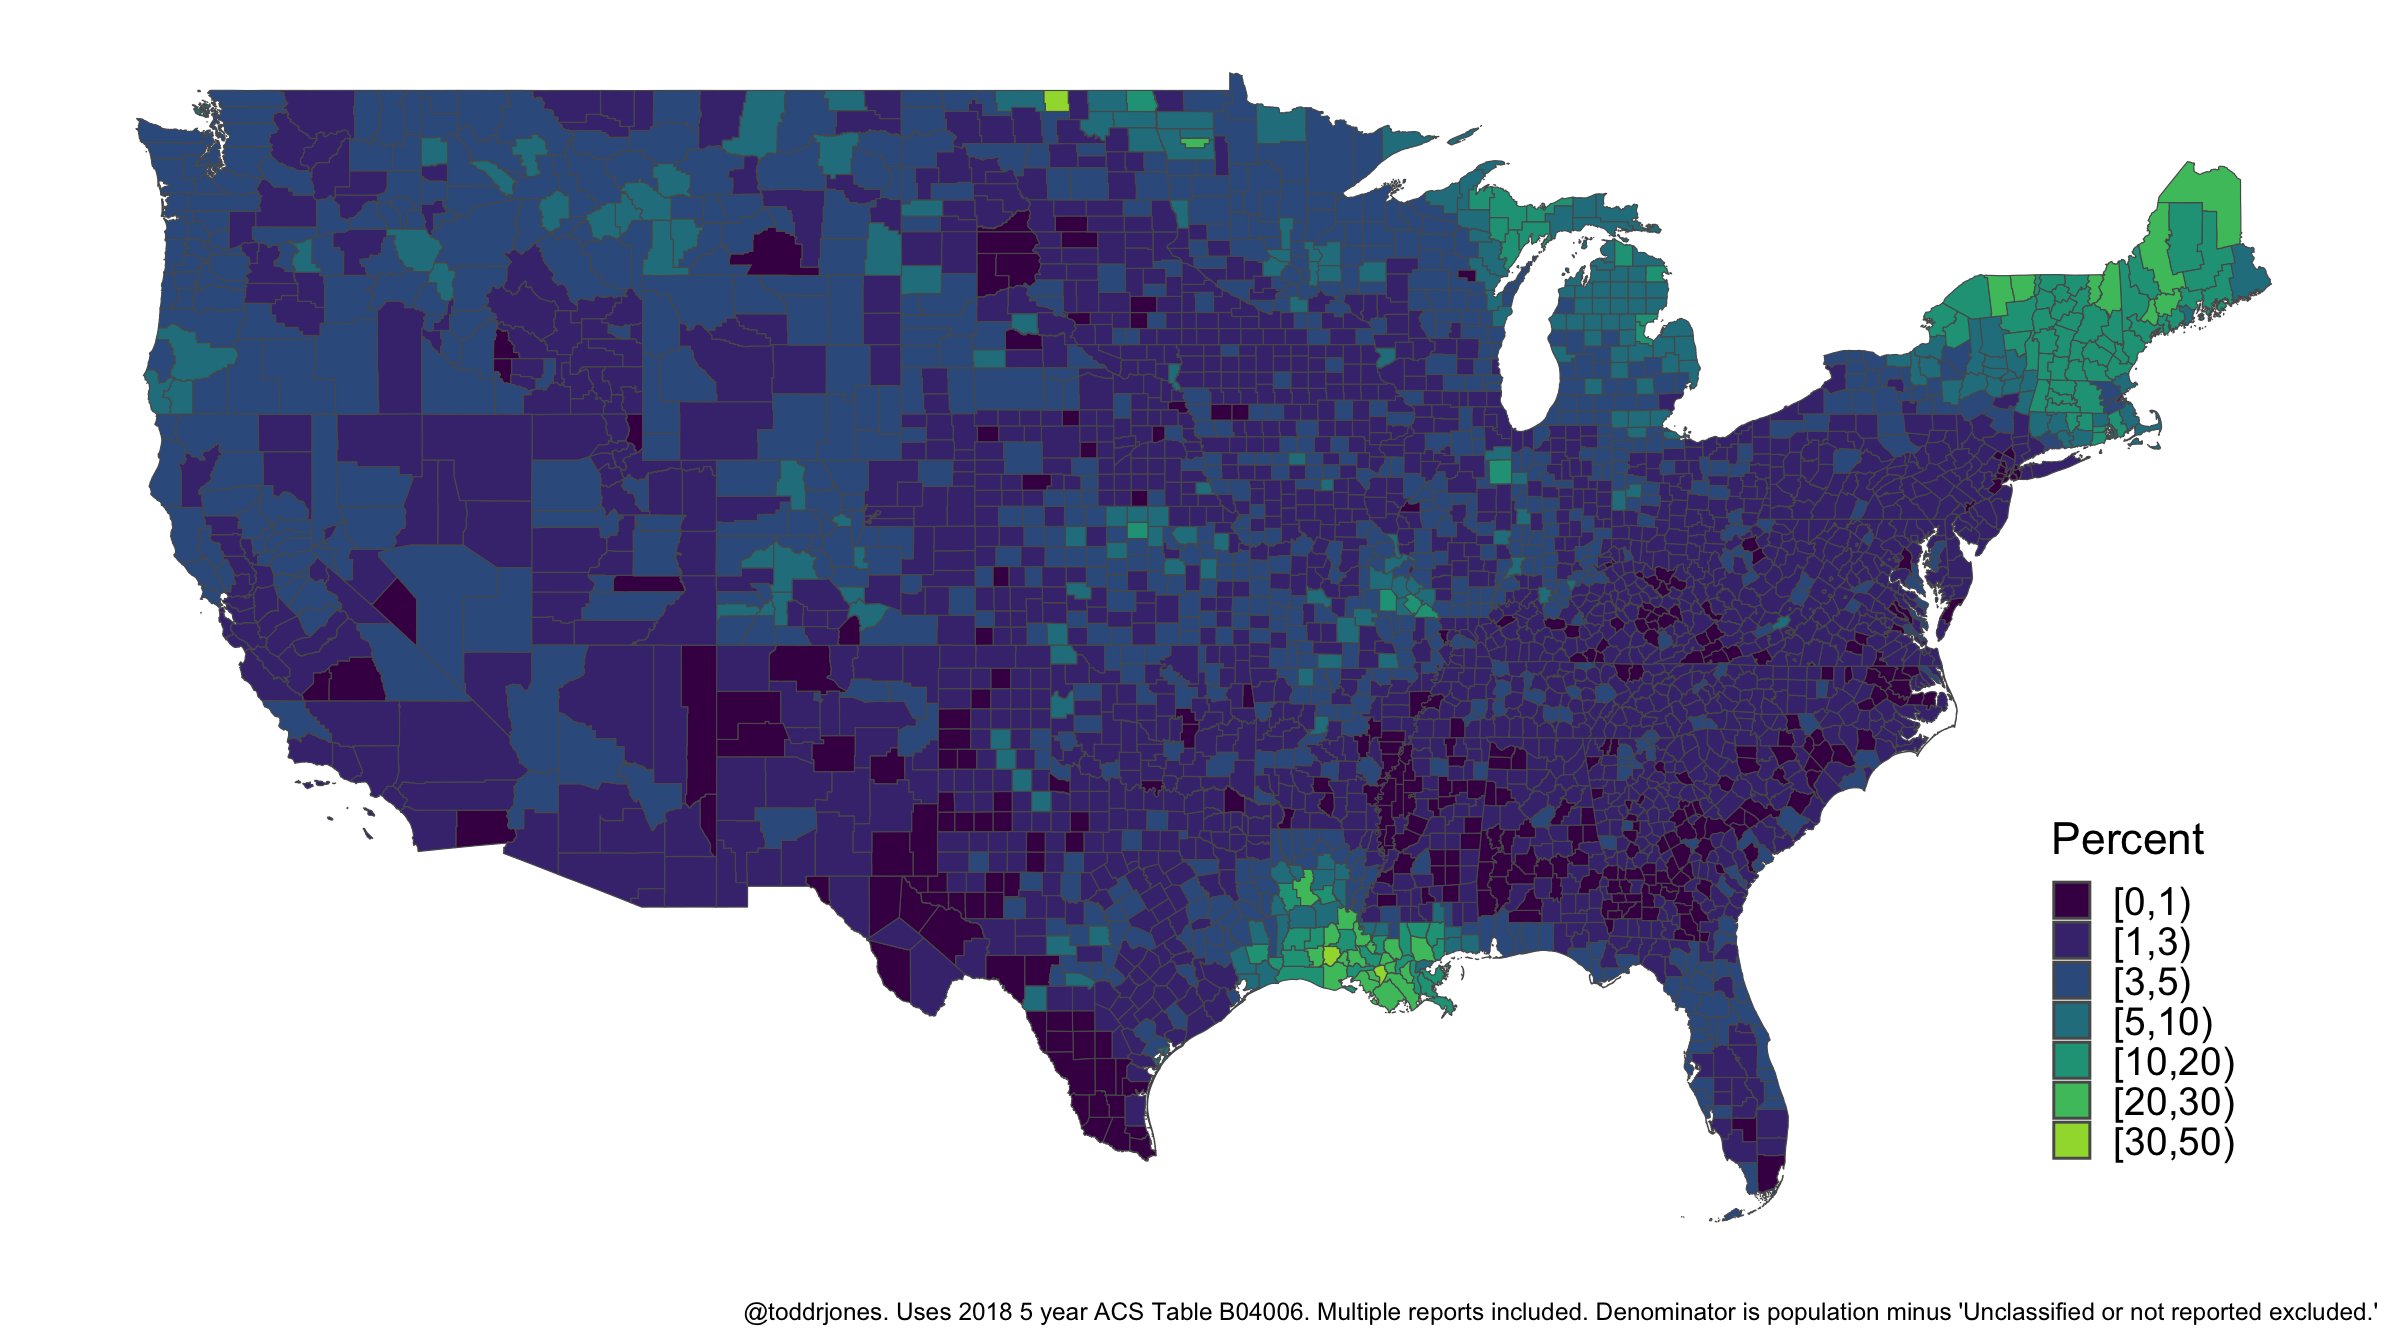
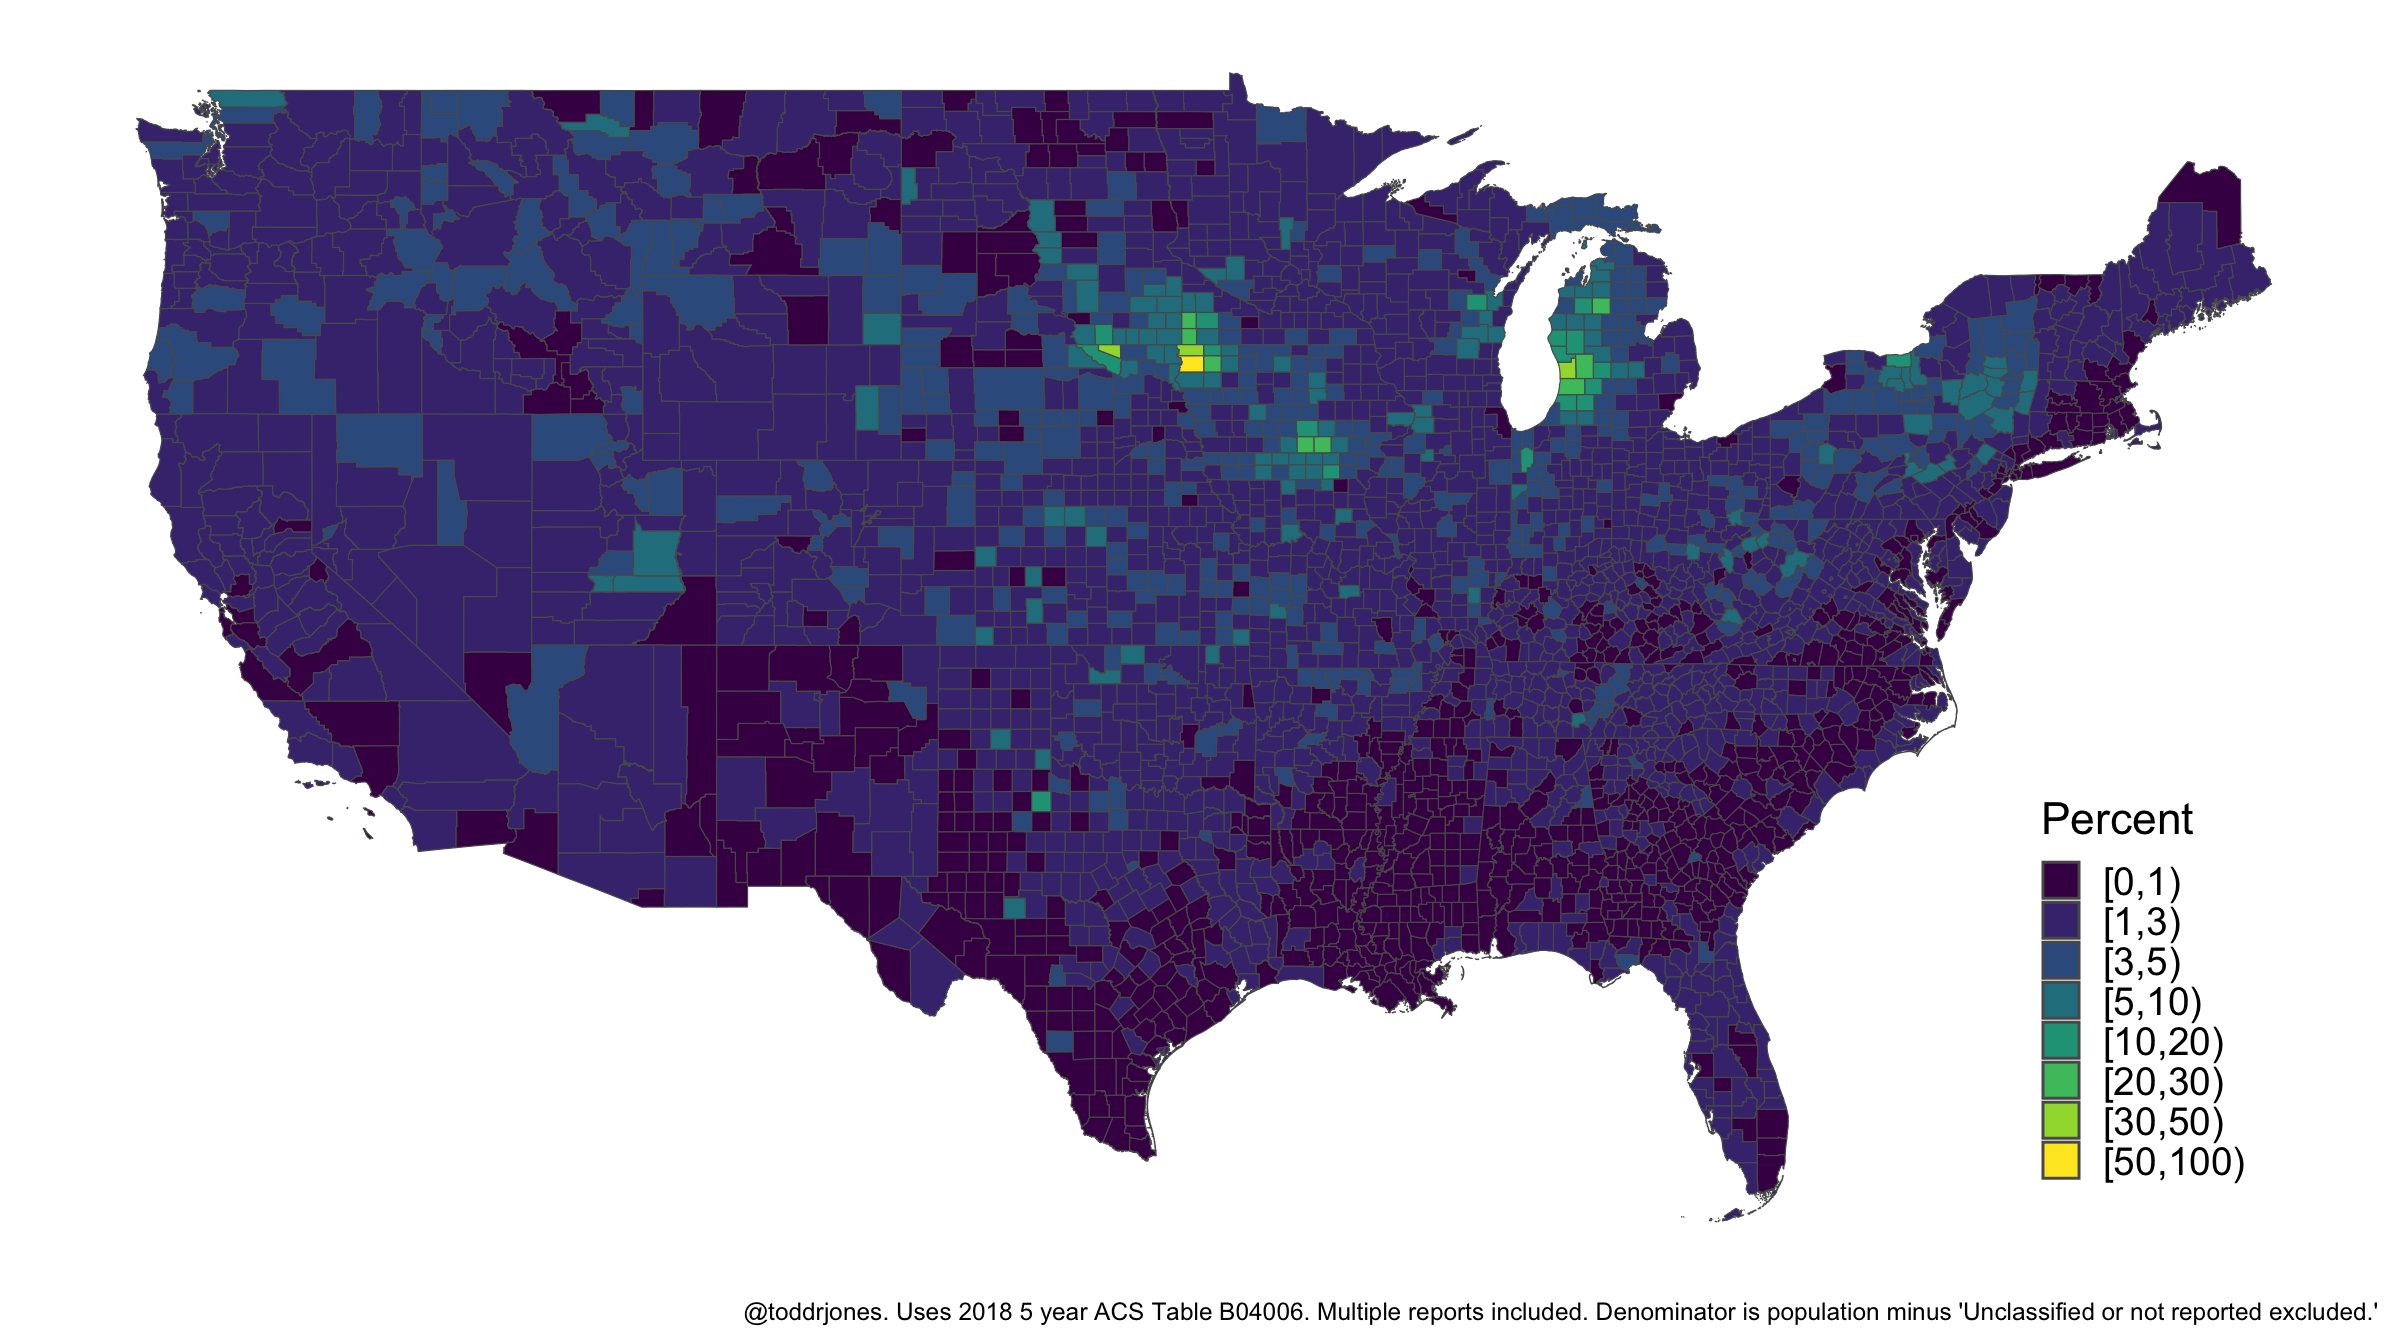
Percentage of county reporting French (excluding Basque) ancestry
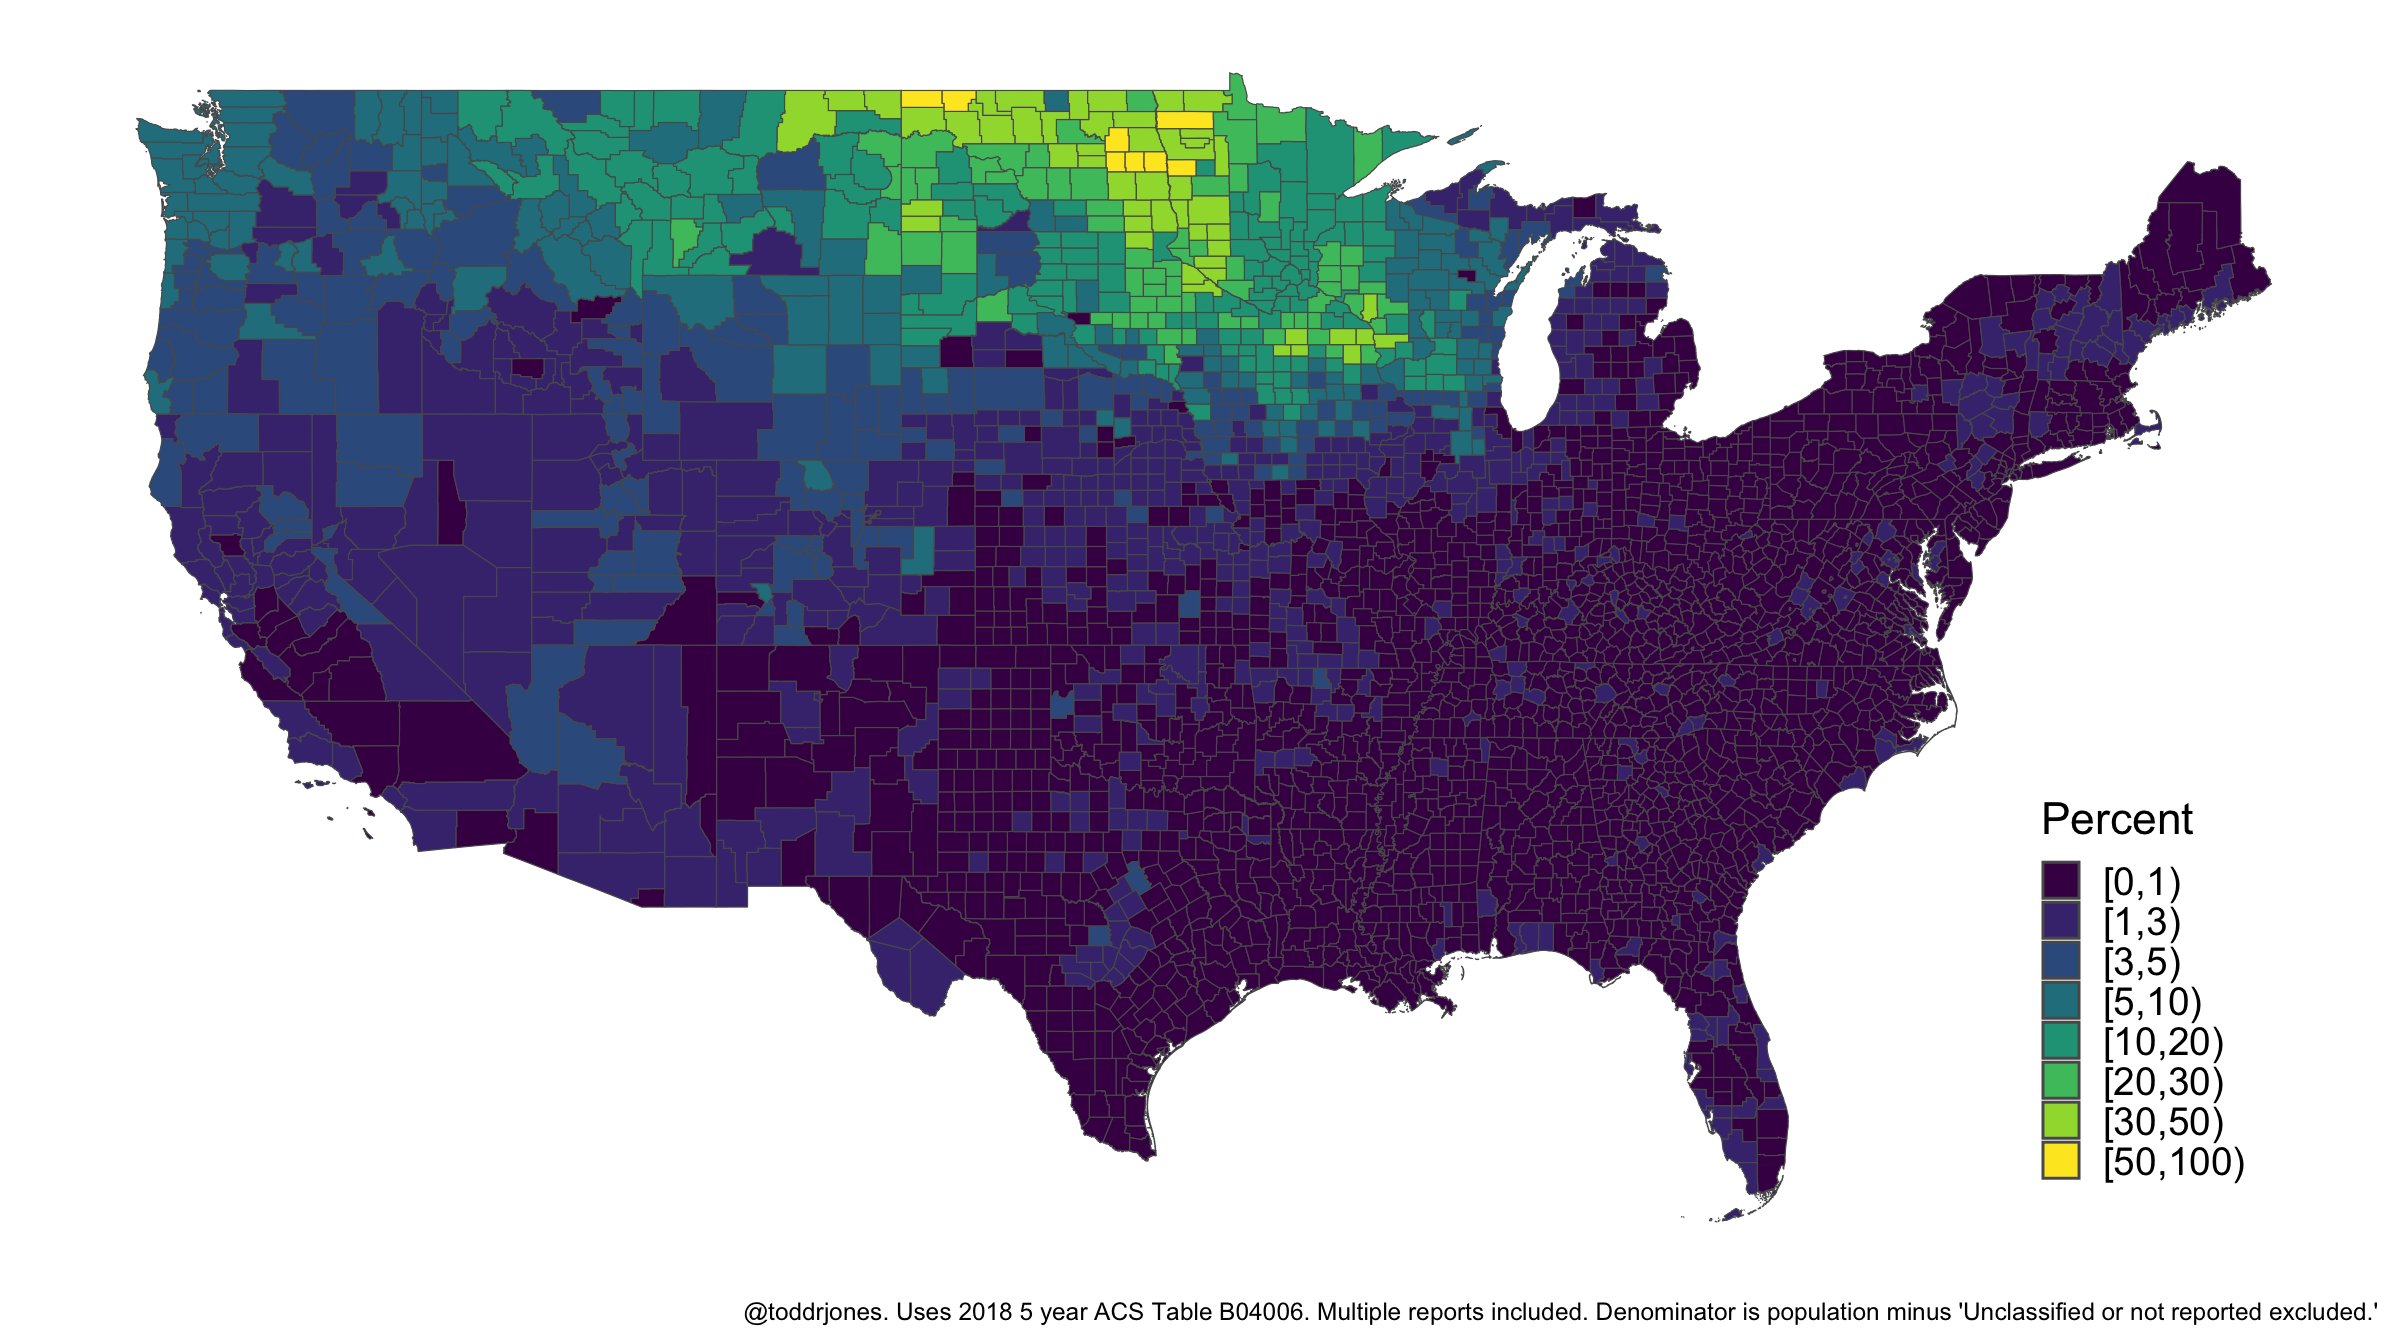
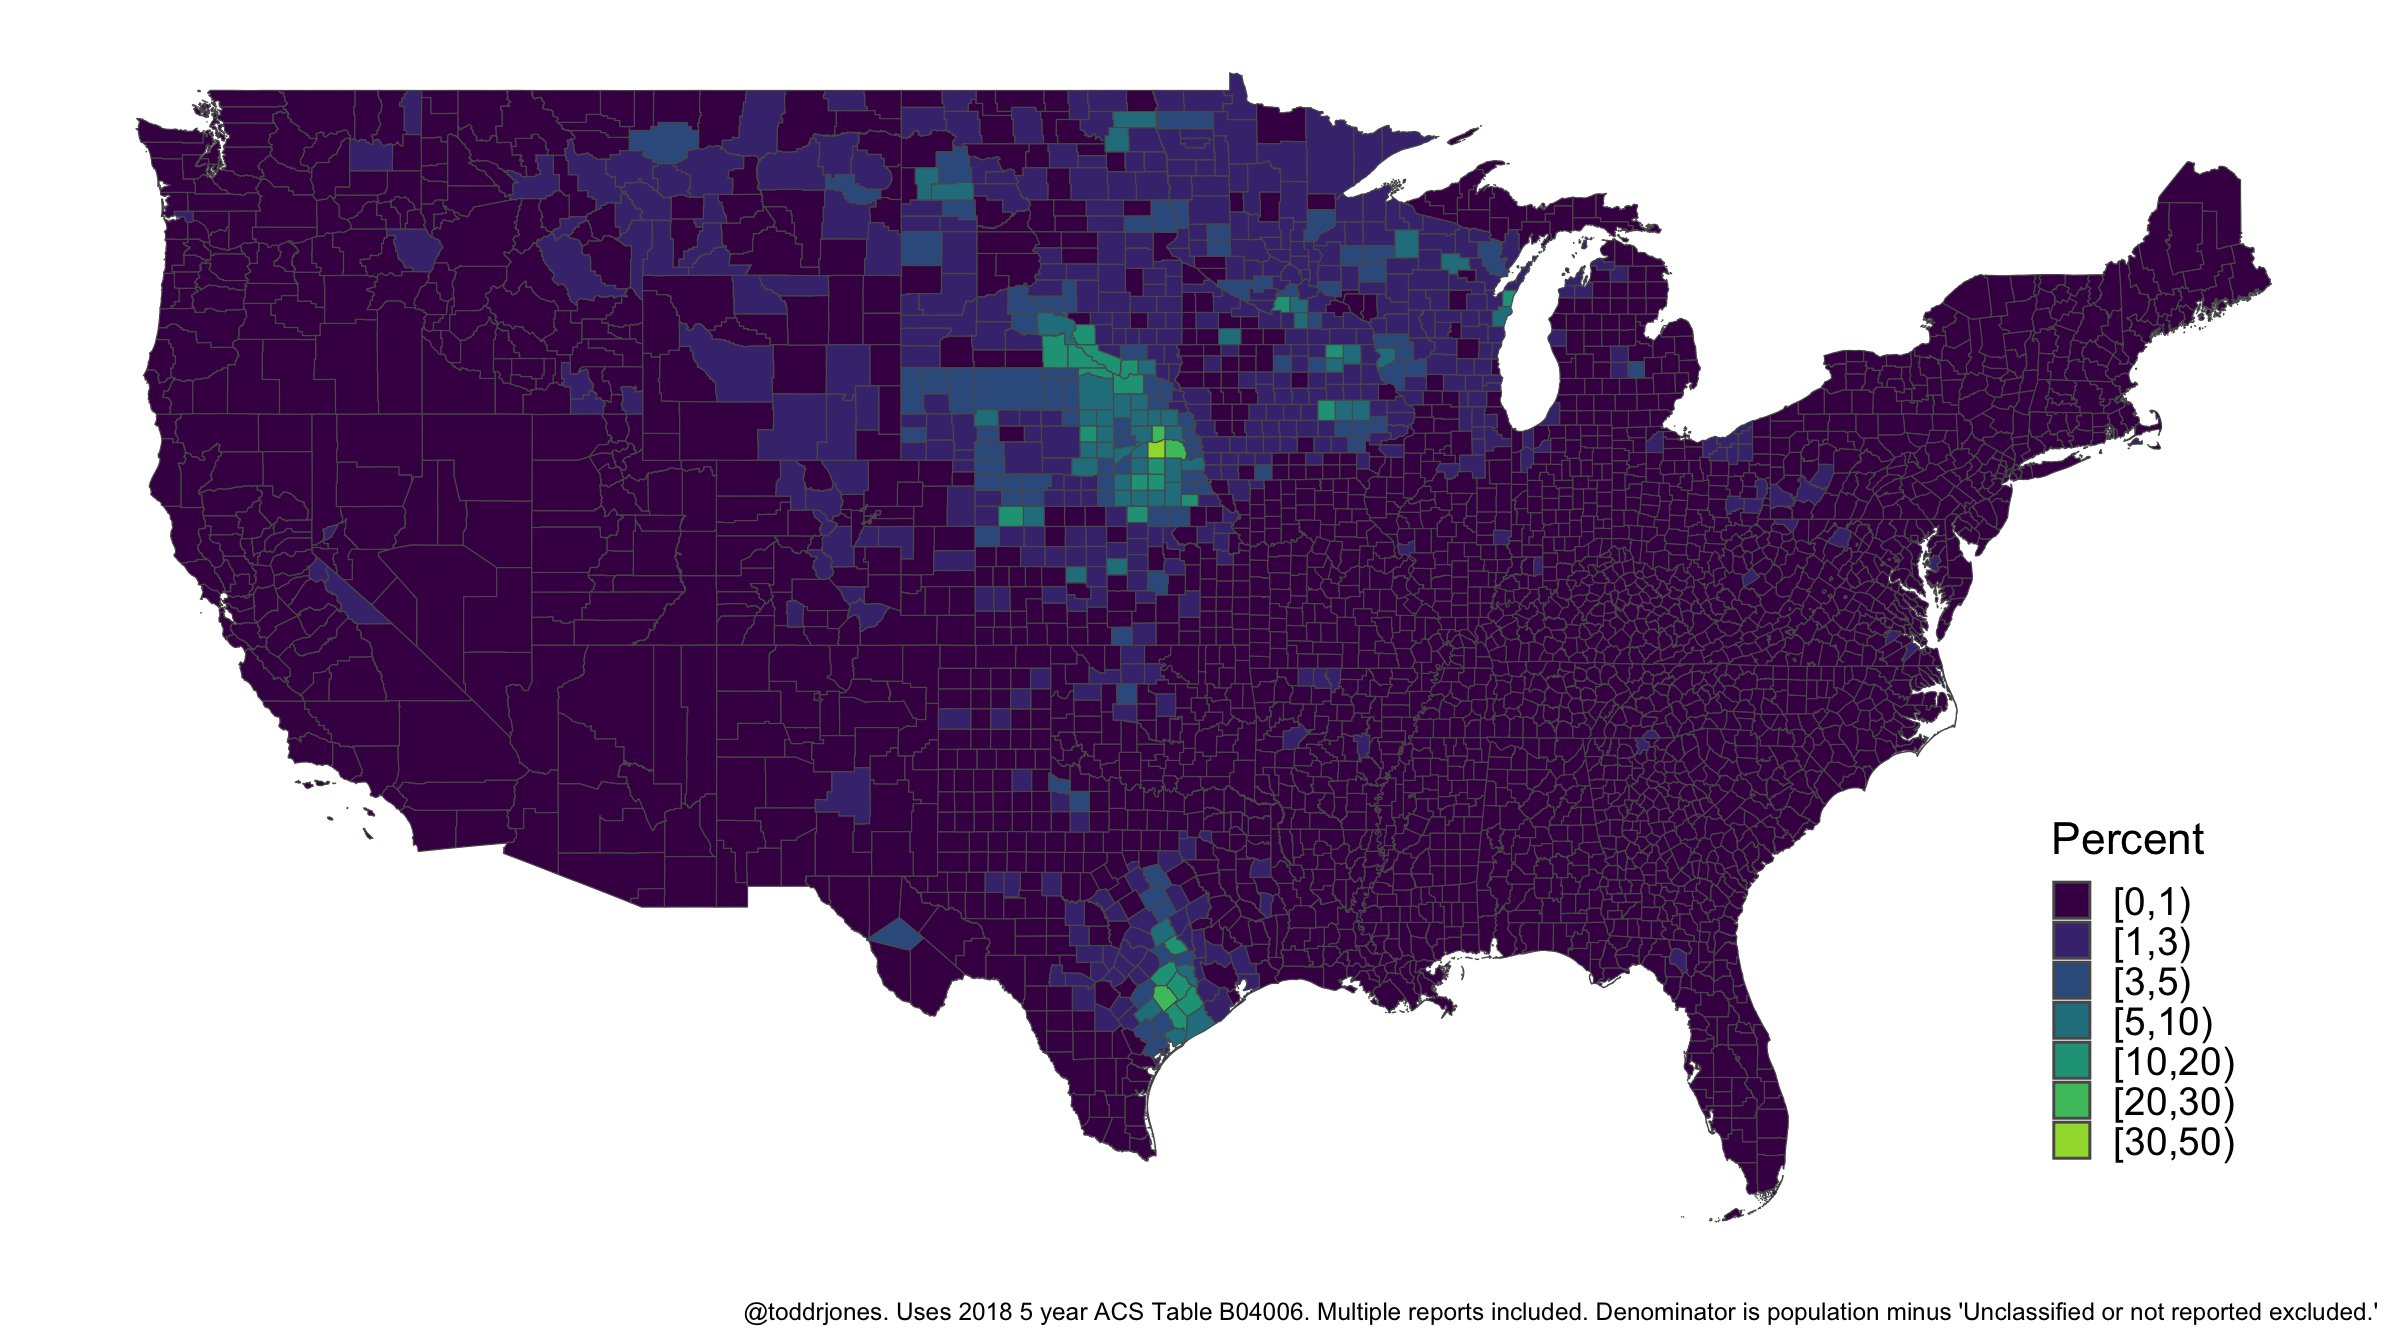
Percentage of county reporting Norwegian ancestry
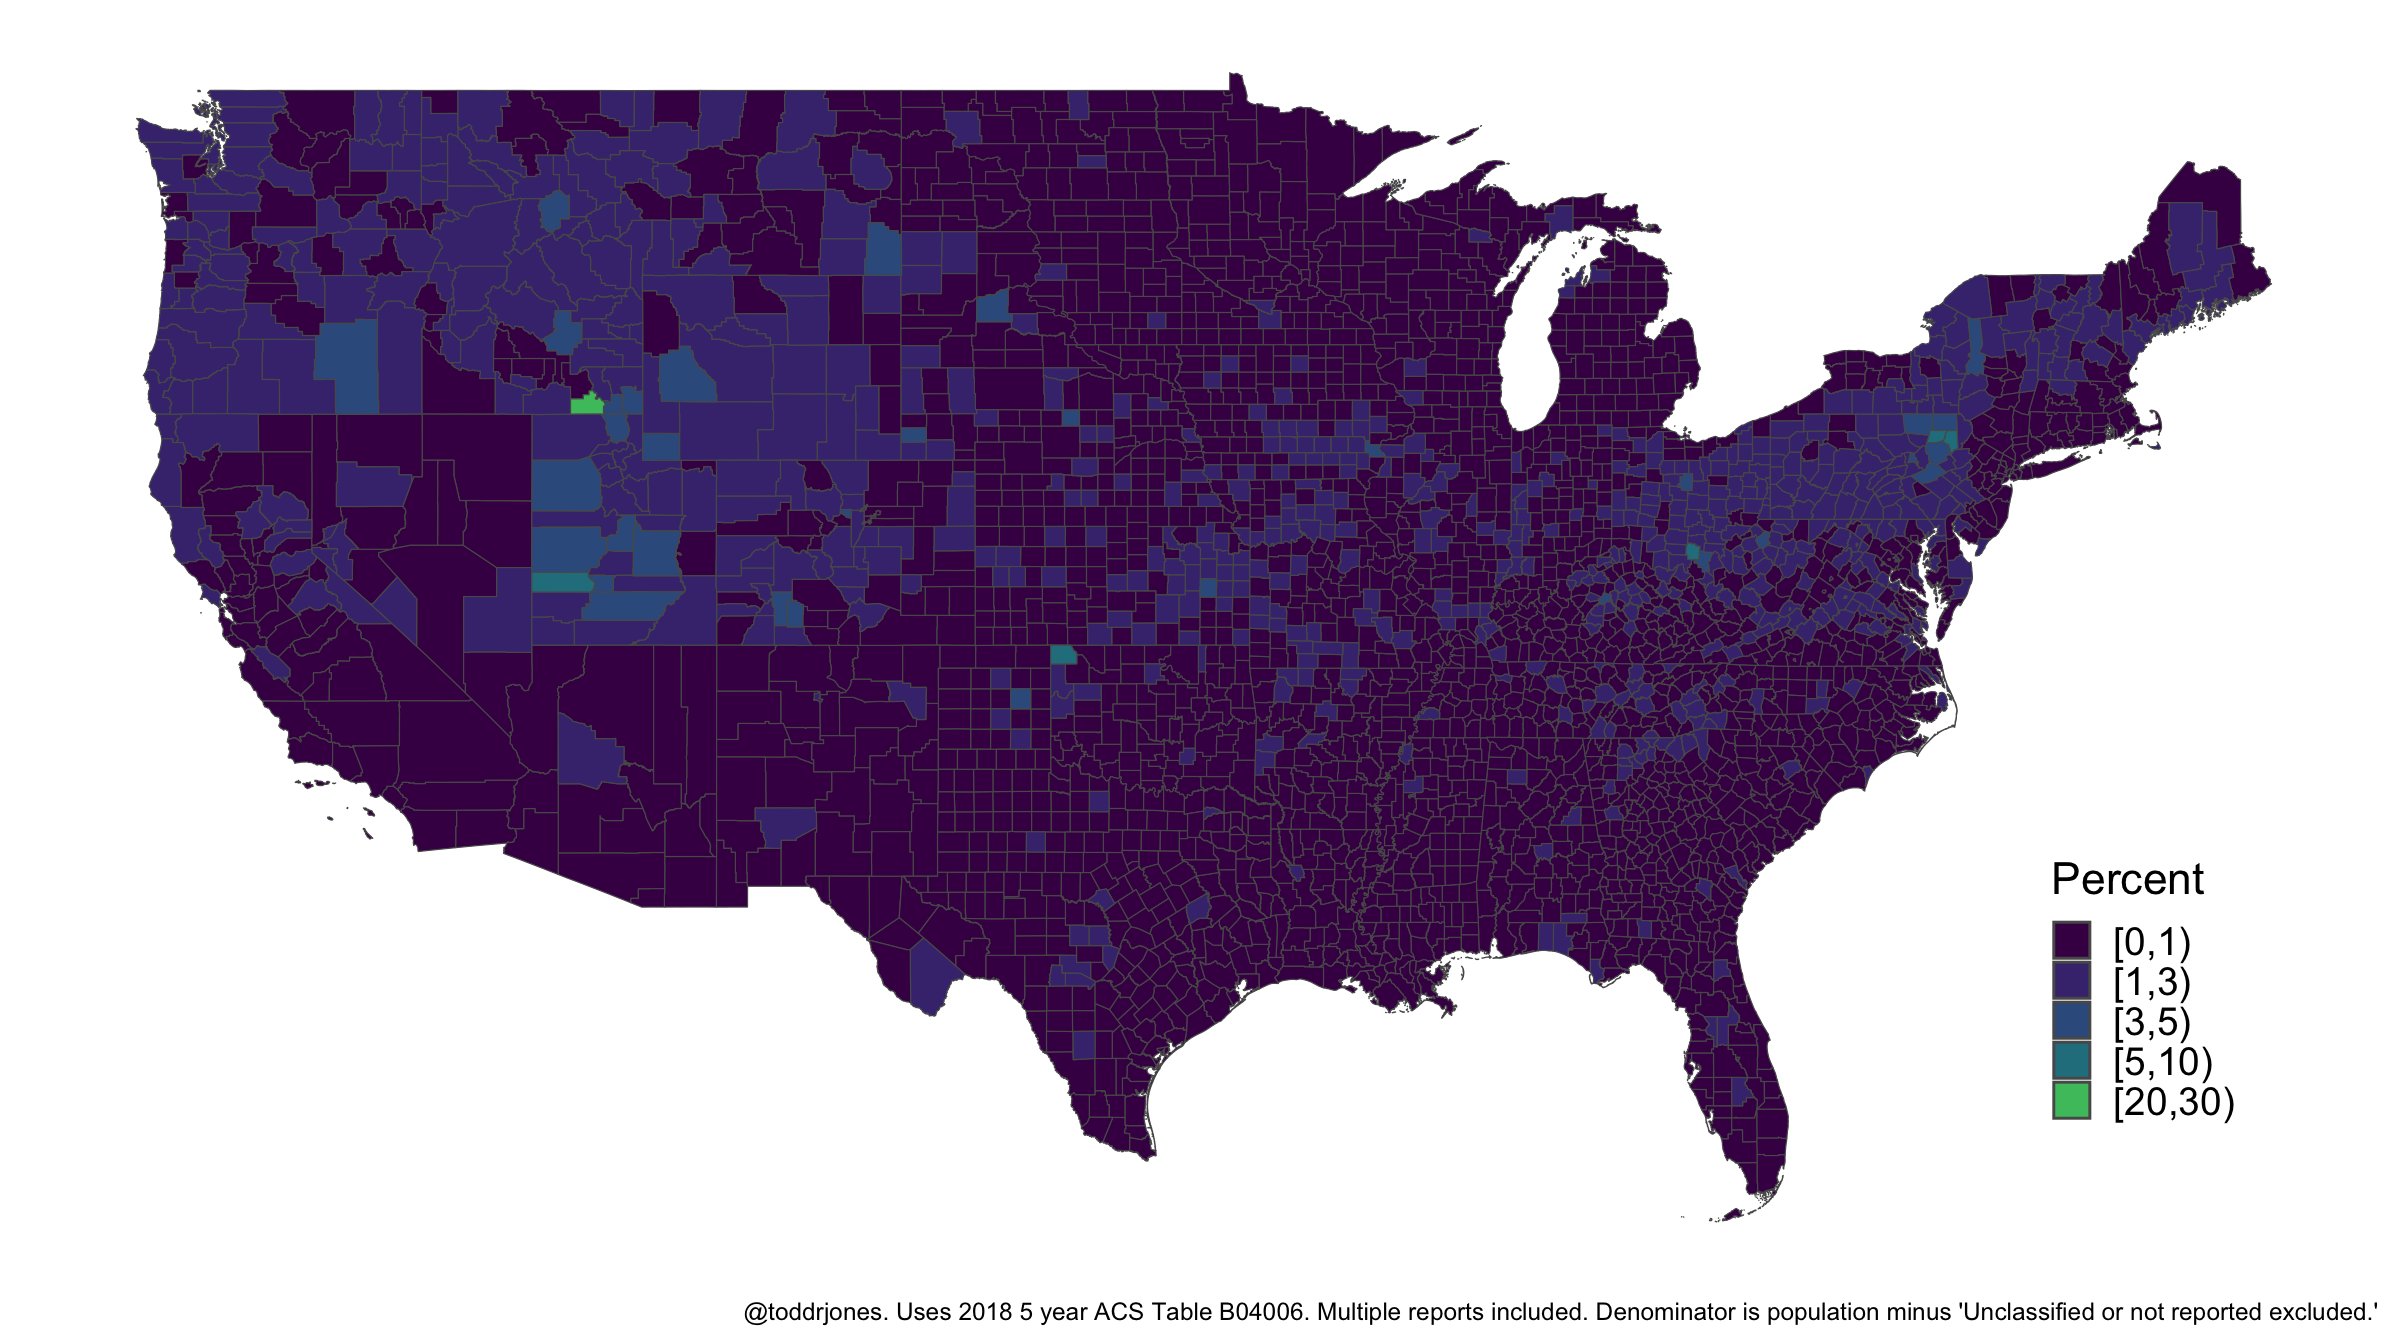
Percentage of county reporting Dutch ancestry
Percentage of county reporting Czech ancestry
Percentage of county reporting Welsh ancestry
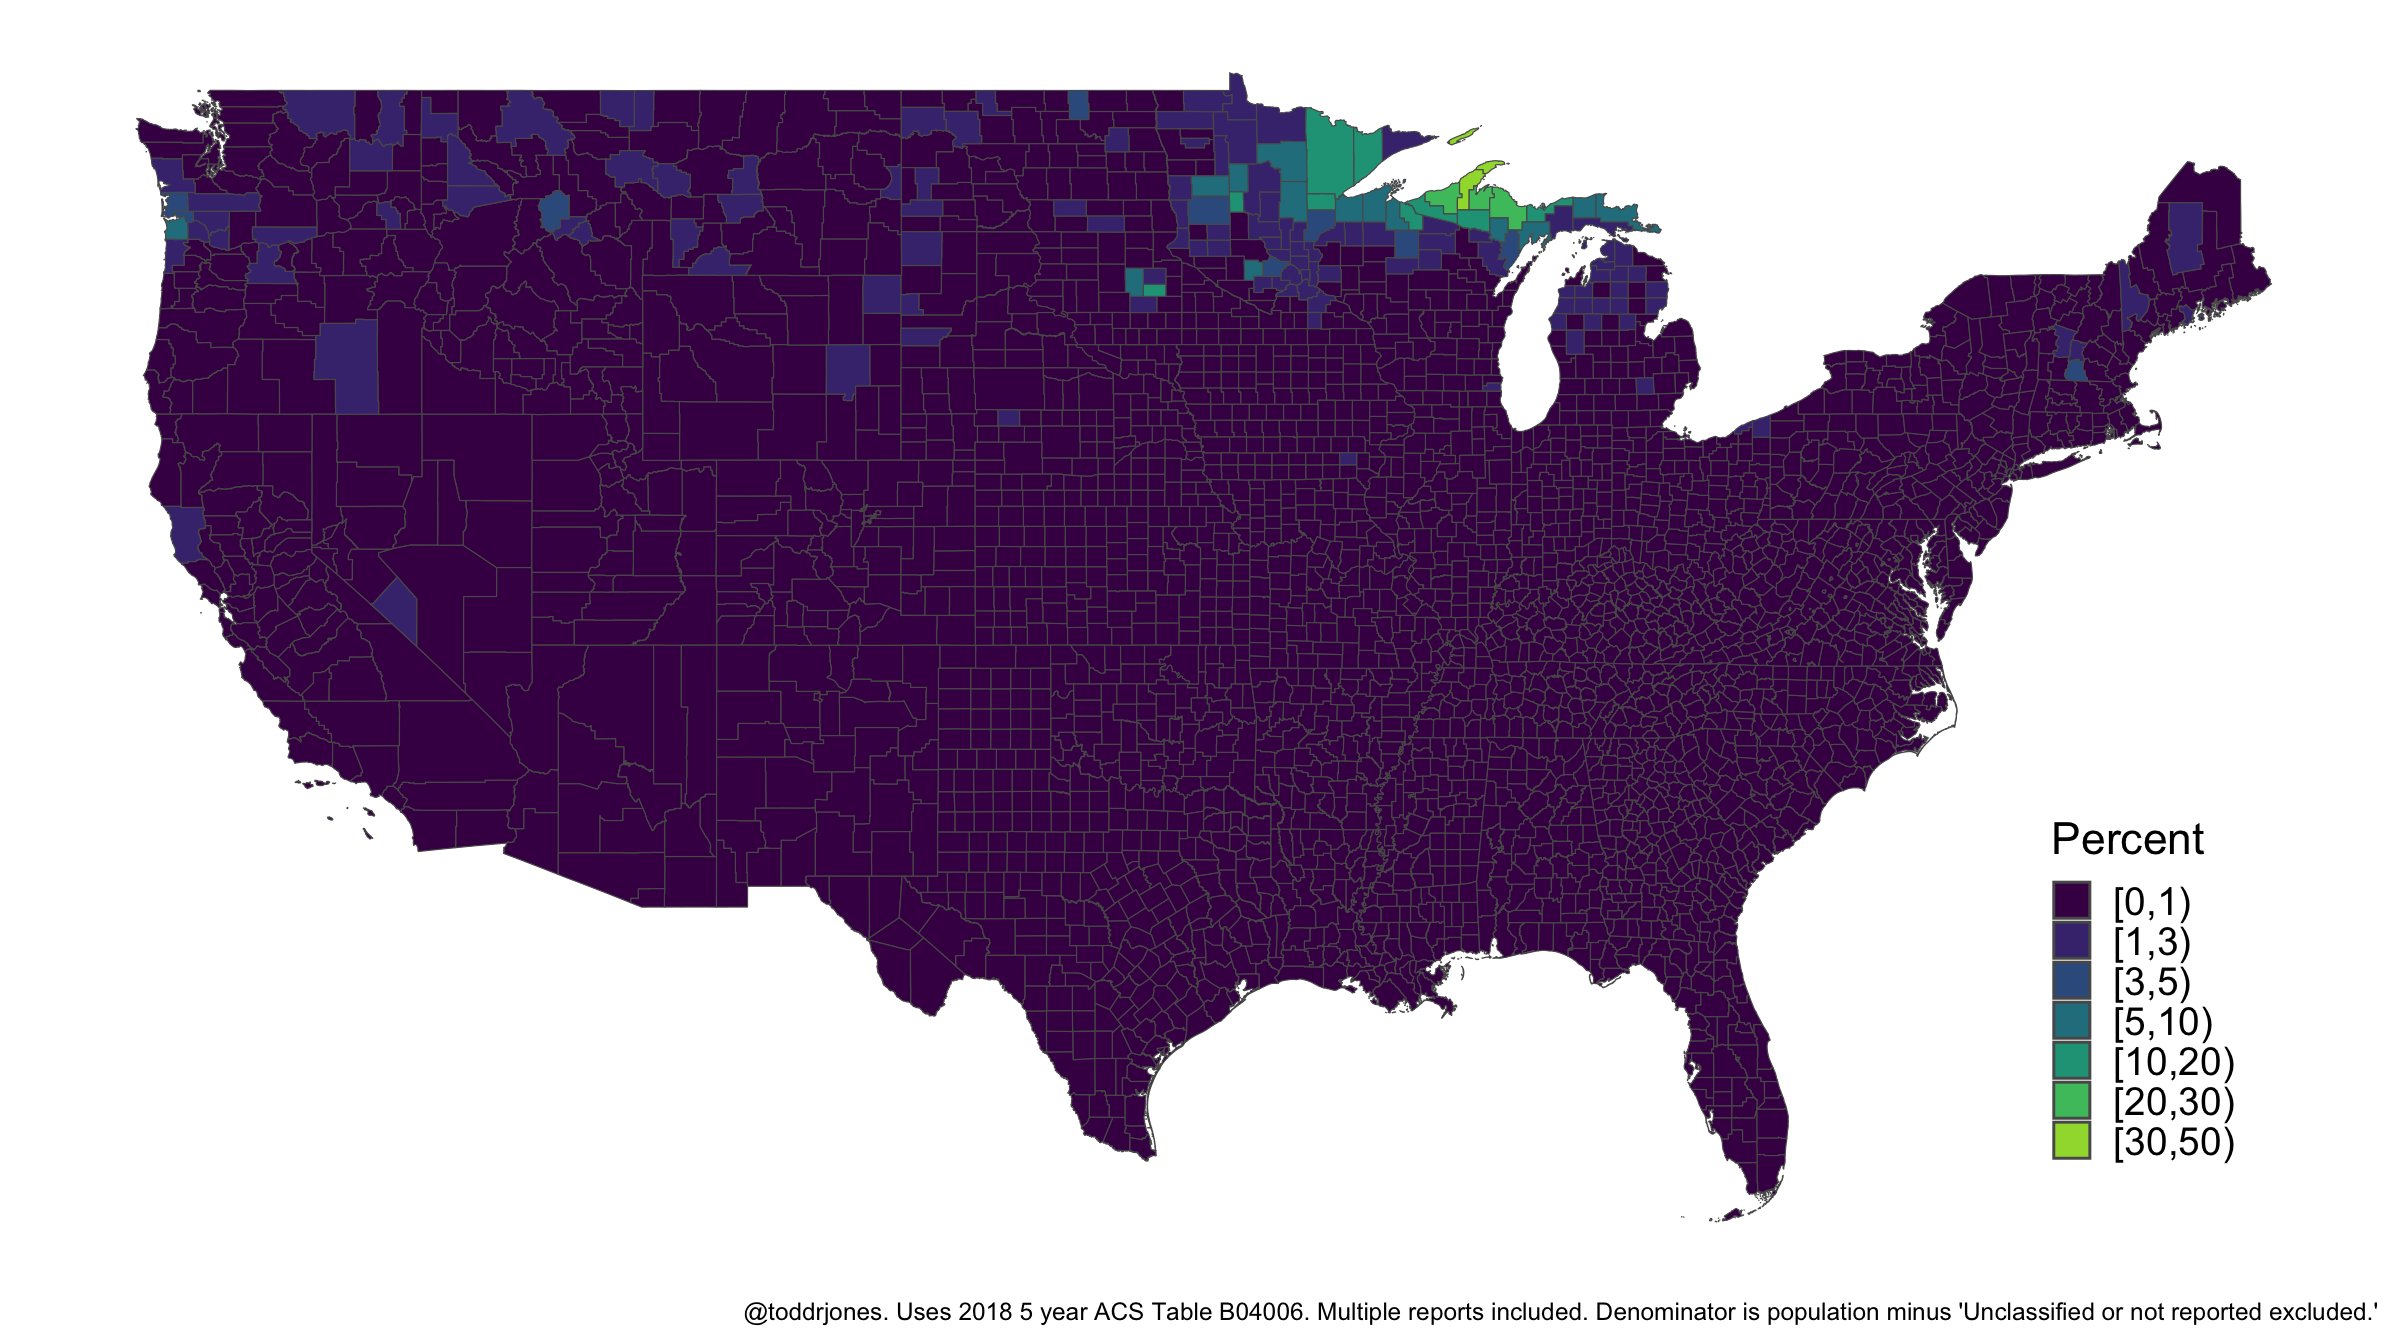
Percentage of county reporting Finnish ancestry
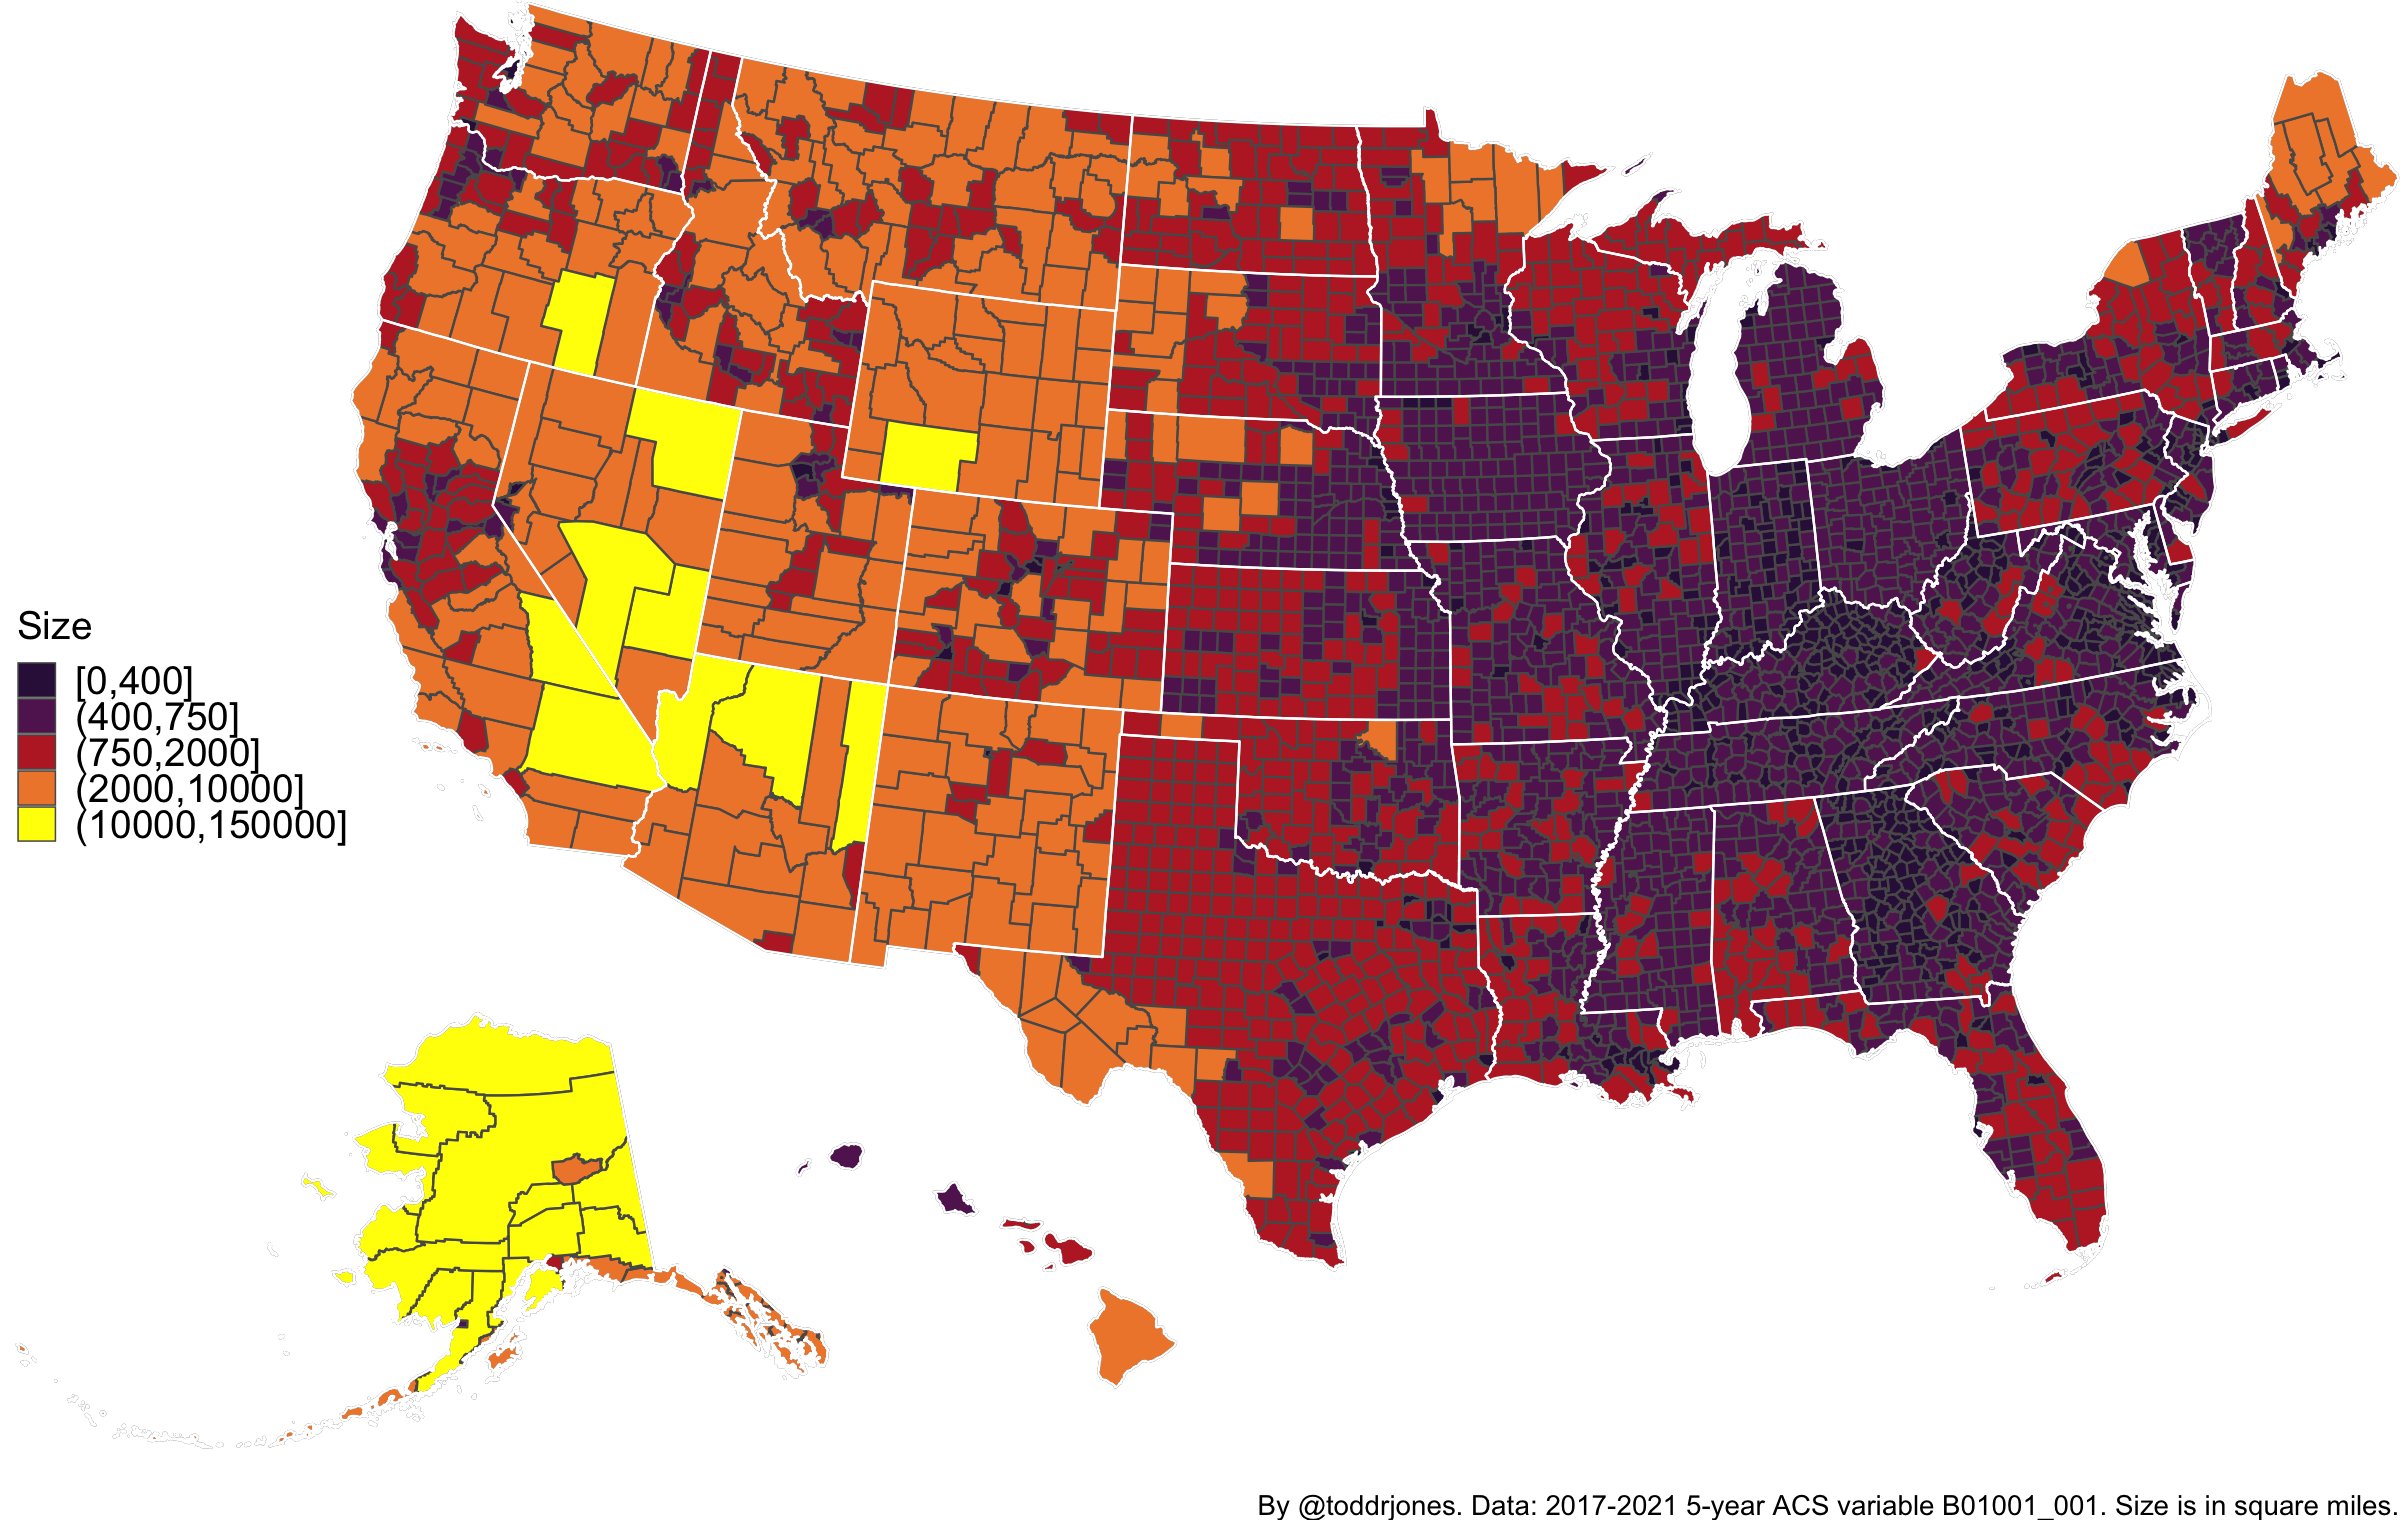
County size in square miles
Mean Center of US Population, 1790-2020
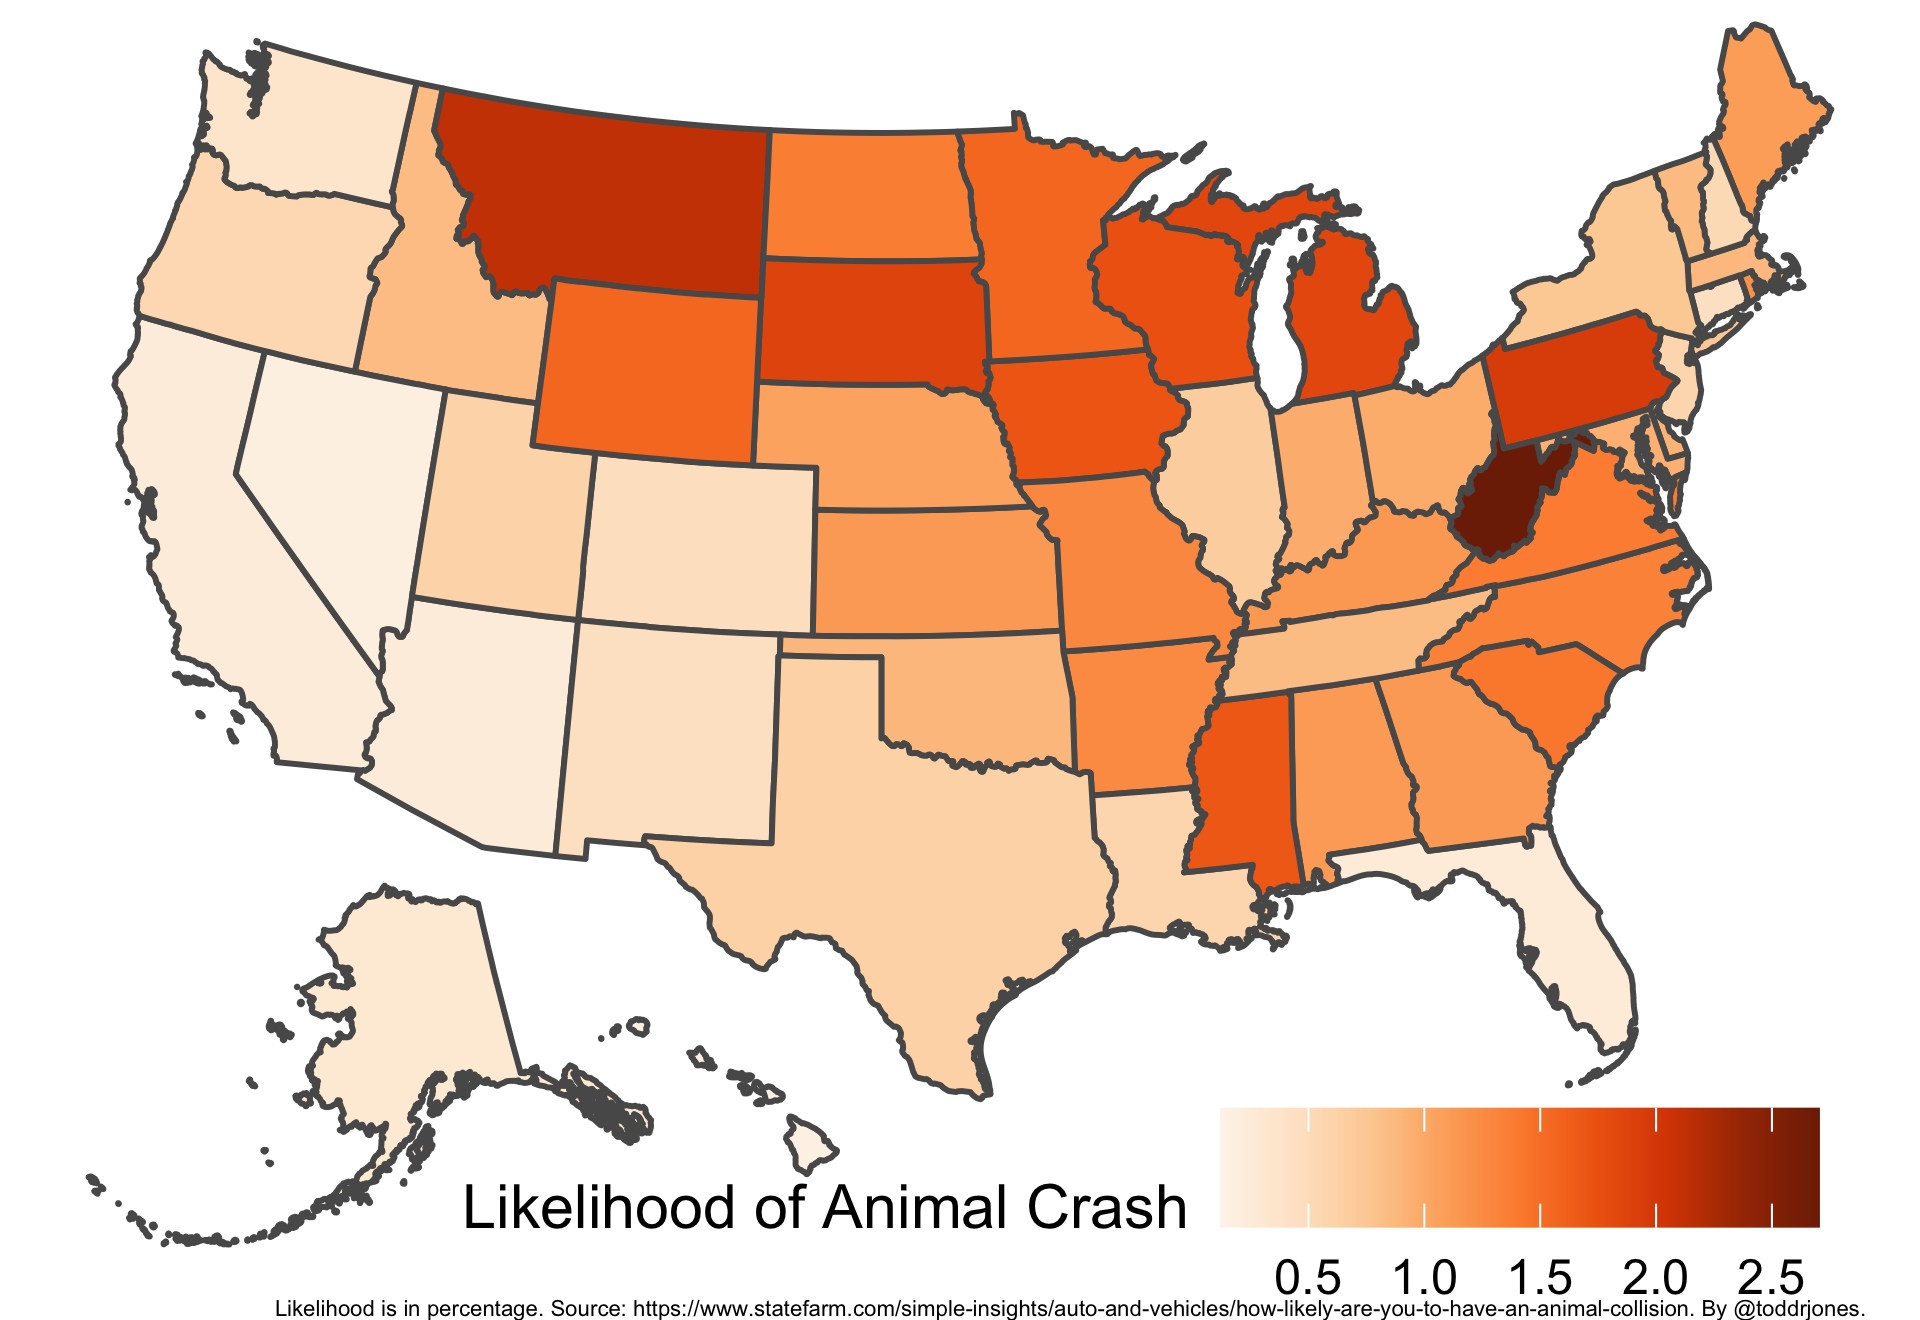
How Likely Car Drivers Are To Hit A Deer, Elk, Moose, Caribou or Other Large Animal Per Year
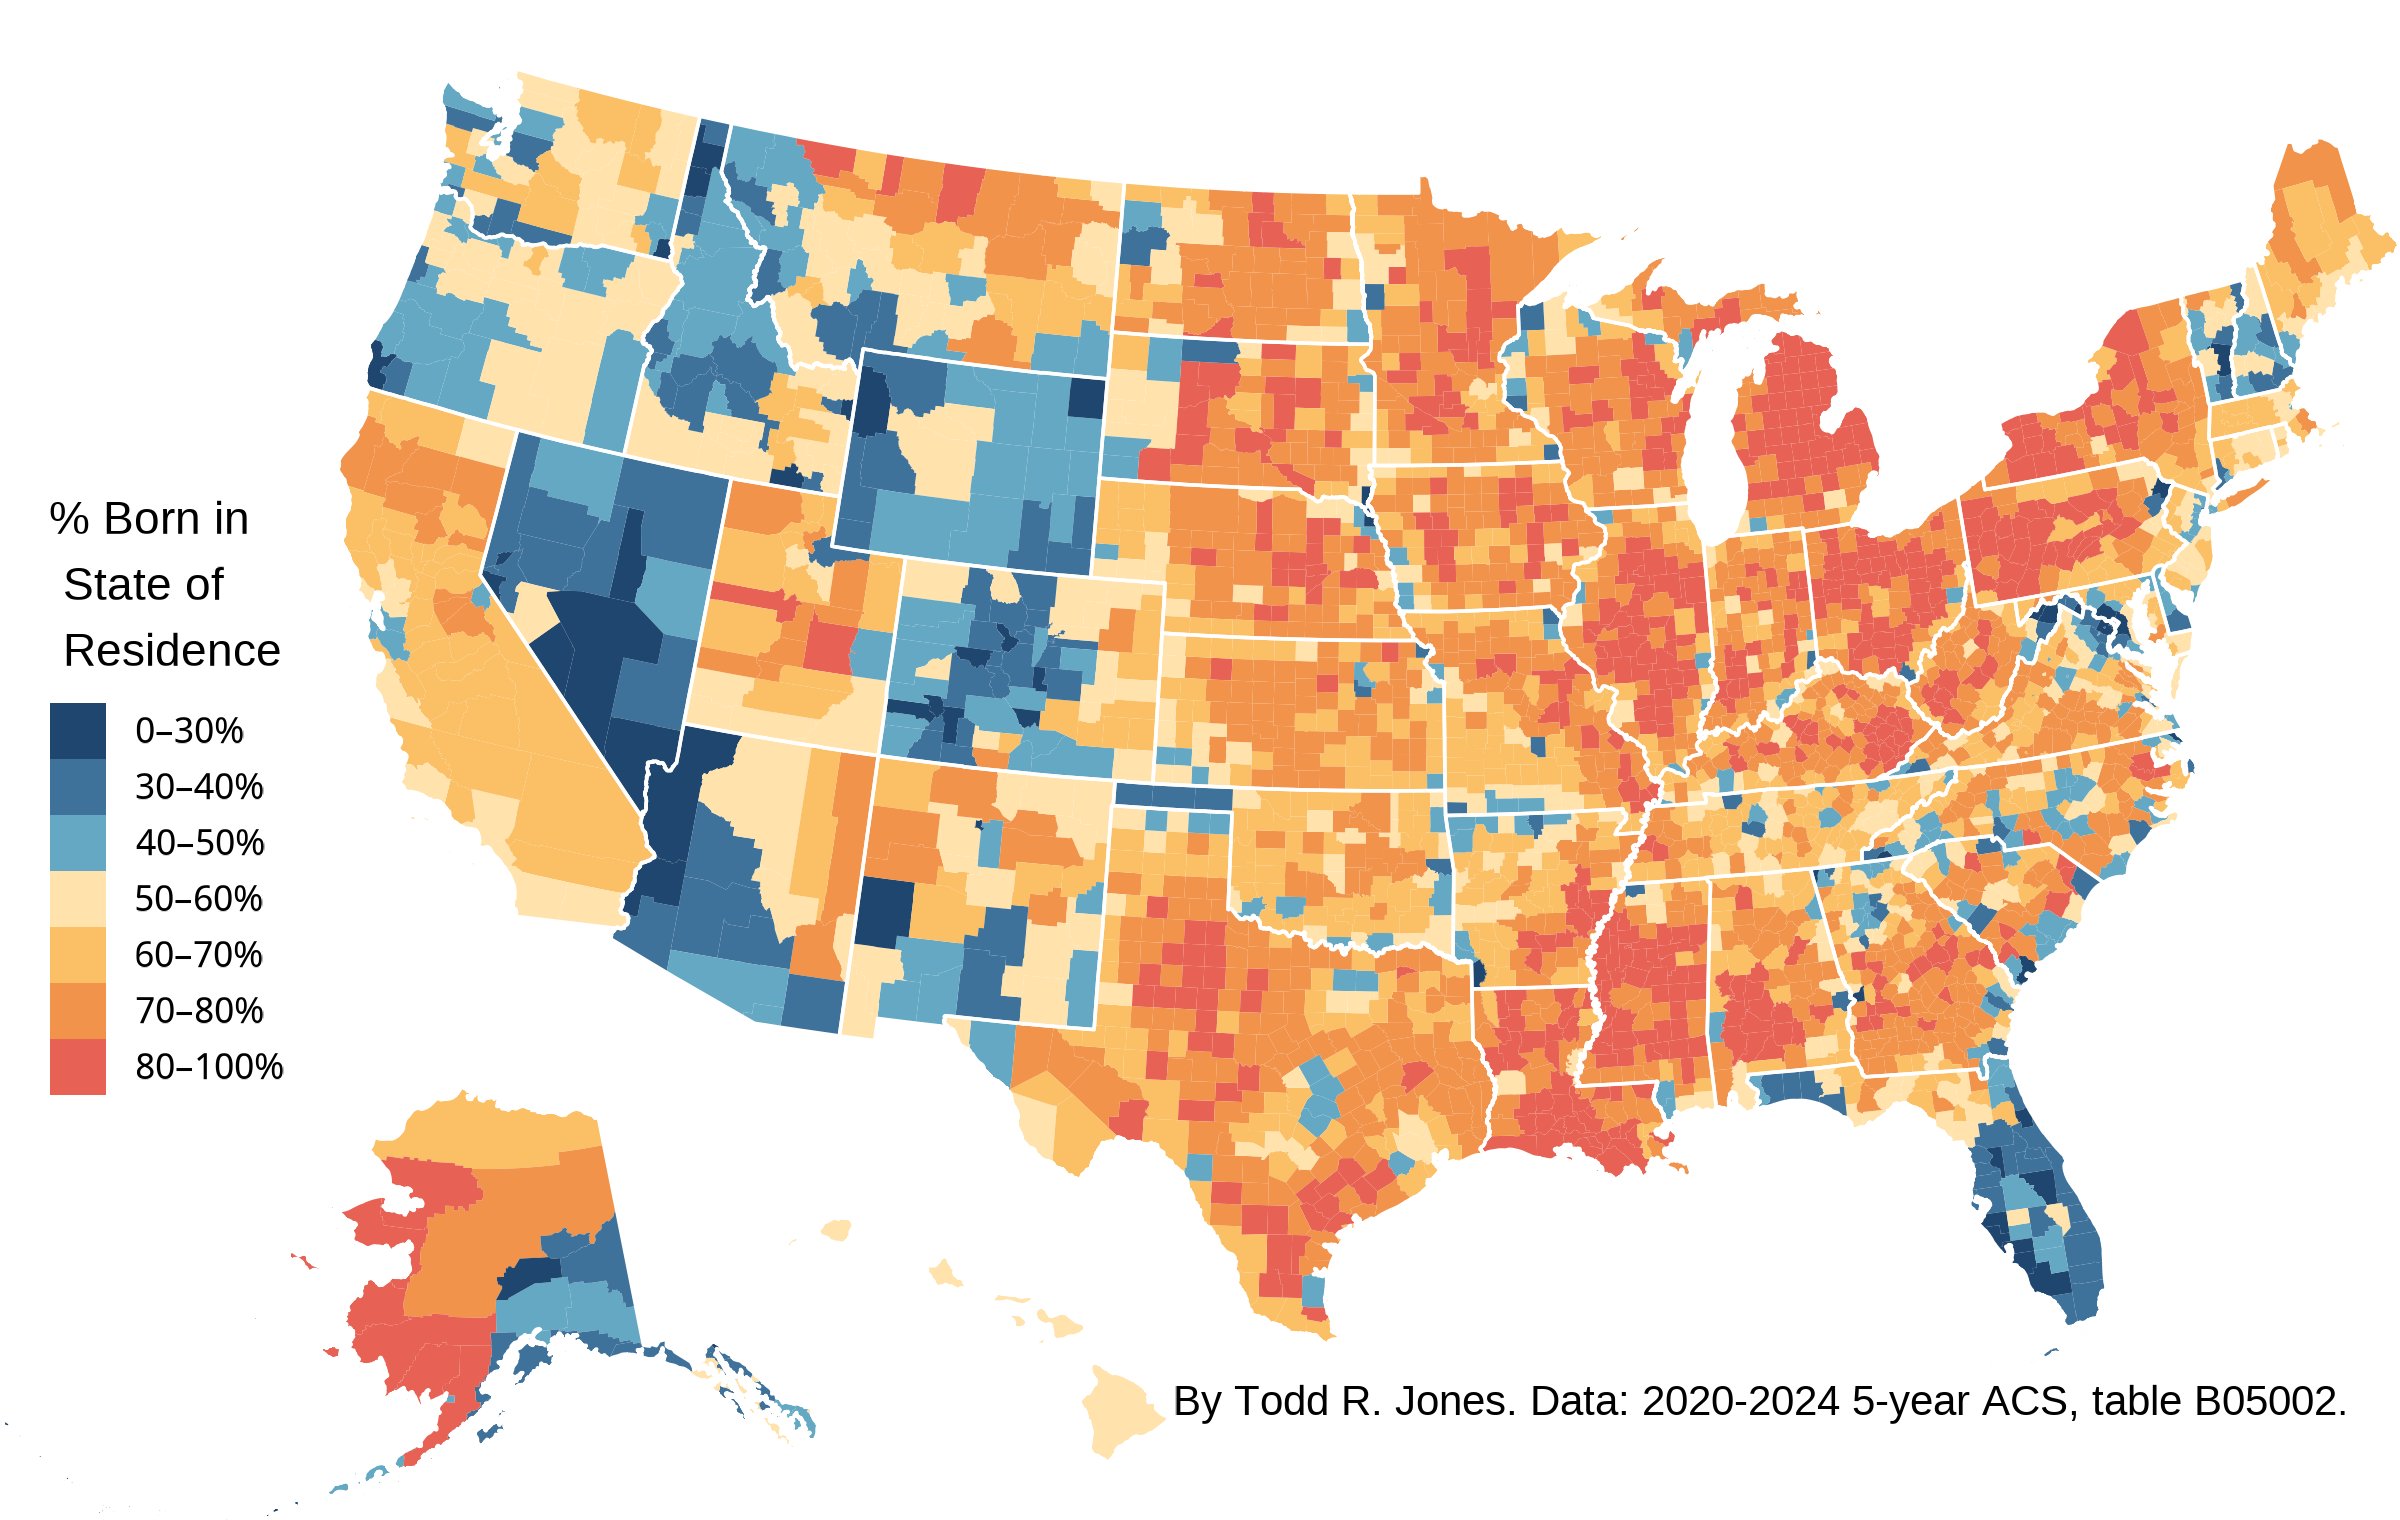
The Percent of Residents Living in Their Birth State, by County


Walt Tracinski says
Cabela’s is now part of Bass Pro Shops (they were purchased). You should update this map.