The inspiration for these maps comes from Donald Trump’s repeated stated desire to make Canada a part of the United States.
Yet, a poll from 2024 showed 82% of Canadians oppose any such the plan!
And that was before the whole boycott US movement and elbows up campaigns got going.
Moreover, before continuing I will state I’m a proud Canadian who has zero interest in seeing the US annex Canada.
However, I’m sure that doesn’t matter to Trump or his MAGA supporters.
Instead these maps are designed to show why it’s in the Republicans best interests not to Annex Canada from a political point of view.
As of the 2021 Canadian census, Canada had a population of 36,991,981.
The US in contrast had a population of 331,449,281 based on the 2020 US census.
Which means Canada is currently 11.2% the size of the US.
Or if the two countries were joined they would have combined population of 368,441,262 of which the former Canada would represent just over 10%.
If Canada came in as 1 single gigantic state it would be the second most populous, behind California (39,538,223) and by far the largest geographically (5.8x the size of Alaska).
And once the next census is complete it would likely take the crown as the most populous state as estimates for late 2025 put Canada’s population up to 41,575,585 and California’s at just 39,431,263.
Electorally, it’s obviously difficult to predict exactly how Canadians would vote given the different political systems between the two countries.
So I’m going to use the results of this poll and assume anyone opposed to Canada joining the US would vote Democrat and everyone else would vote Republican (82% vs 18% nationally).
And for simplicity’s sake assume seats would go proportionally to vote share (although personally I think this is likely overly generous in the Republican’s favour).
The Apportionment Act of 1911 fixes the number of members of the United States House of Representatives at 435.
So new seats for the state of Canada would come at the expense of other states, unless a new law was passed.
Thankfully, Josh Nygaard created the Congressional Apportionment App, which can do all the work for us.
Based on the data above Canada would get 44 Member of congress and 2 senators. And come from the following states:

Data by state:
| State | Population | House Seats | Population / Seat | 2024 Winner | Electroal College Votes |
|---|---|---|---|---|---|
| Alabama | 5,030,053 | (-1) 6 | 838,342 | Rep | 8 |
| Alaska | 736,081 | 1 | 736,081 | Rep | 3 |
| Arizona | 7,158,923 | (-1) 8 | 894,865 | Rep | 10 |
| Arkansas | 3,013,756 | 4 | 753,439 | Rep | 6 |
| California | 39,576,757 | (-5) 47 | 842,059 | Dem | 49 |
| Canada | 36,991,981 | 44 | 840,727 | Dem | 46 |
| Colorado | 5,782,171 | (-1) 7 | 826,024 | Dem | 9 |
| Connecticut | 3,608,298 | (-1) 4 | 902,075 | Dem | 6 |
| Delaware | 990,837 | 1 | 990,837 | Dem | 3 |
| Florida | 21,570,527 | (-3) 25 | 862,821 | Rep | 27 |
| Georgia | 10,725,274 | (-1) 13 | 825,021 | Rep | 15 |
| Hawaii | 1,460,137 | 2 | 730,069 | Dem | 4 |
| Idaho | 1,841,377 | 2 | 920,689 | Rep | 4 |
| Illinois | 12,822,739 | (-2) 15 | 854,849 | Dem | 17 |
| Indiana | 6,790,280 | (-1) 8 | 848,785 | Rep | 10 |
| Iowa | 3,192,406 | 4 | 798,102 | Rep | 6 |
| Kansas | 2,940,865 | (-1) 3 | 980,288 | Rep | 5 |
| Kentucky | 4,509,342 | (-1) 5 | 901,868 | Rep | 7 |
| Louisiana | 4,661,468 | 6 | 776,911 | Rep | 8 |
| Maine | 1,363,582 | 2 | 681,791 | Split | 4 |
| Maryland | 6,185,278 | (-1) 7 | 883,611 | Dem | 9 |
| Massachusetts | 7,033,469 | (-1) 8 | 879,184 | Dem | 10 |
| Michigan | 10,084,442 | (-1) 12 | 840,370 | Rep | 14 |
| Minnesota | 5,709,752 | (-1) 7 | 815,679 | Dem | 9 |
| Mississippi | 2,963,914 | 4 | 740,979 | Rep | 6 |
| Missouri | 6,160,281 | (-1) 7 | 880,040 | Rep | 9 |
| Montana | 1,085,407 | (-1) 1 | 1,085,407 | Rep | 3 |
| Nebraska | 1,963,333 | (-1) 2 | 981,667 | Split | 4 |
| Nevada | 3,108,462 | 4 | 777,116 | Rep | 6 |
| New Hampshire | 1,379,089 | 2 | 689,545 | Dem | 4 |
| New Jersey | 9,294,493 | (-1) 11 | 844,954 | Dem | 13 |
| New Mexico | 2,120,220 | 3 | 706,740 | Dem | 5 |
| New York | 20,215,751 | (-2) 24 | 842,323 | Dem | 26 |
| North Carolina | 10,453,948 | (-2) 12 | 871,162 | Rep | 14 |
| North Dakota | 779,702 | 1 | 779,702 | Rep | 3 |
| Ohio | 11,808,848 | (-1) 14 | 843,489 | Rep | 16 |
| Oklahoma | 3,963,516 | 5 | 792,703 | Rep | 7 |
| Oregon | 4,241,500 | (-1) 5 | 848,300 | Dem | 7 |
| Pennsylvania | 13,011,844 | (-2) 15 | 867,456 | Rep | 17 |
| Rhode Island | 1,098,163 | (-1) 1 | 1,098,163 | Dem | 3 |
| South Carolina | 5,124,712 | (-1) 6 | 854,119 | Rep | 8 |
| South Dakota | 887,770 | 1 | 887,770 | Rep | 3 |
| Tennessee | 6,916,897 | (-1) 8 | 864,612 | Rep | 10 |
| Texas | 29,183,290 | (-4) 34 | 858,332 | Rep | 36 |
| Utah | 3,275,252 | 4 | 818,813 | Rep | 6 |
| Vermont | 643,503 | 1 | 643,503 | Dem | 3 |
| Virginia | 8,654,542 | (-1) 10 | 865,454 | Dem | 12 |
| Washington | 7,715,946 | (-1) 9 | 857,327 | Dem | 11 |
| West Virginia | 1,795,045 | 2 | 897,523 | Rep | 4 |
| Wisconsin | 5,897,473 | (-1) 7 | 842,496 | Rep | 9 |
| Wyoming | 577,719 | 1 | 577,719 | Rep | 3 |
| DC | 689,545 | NA | NA | Dem | 3 |
Using our political calculous above the Democrats would get 2 additional senators, but this would still not be enough for them to gain control of the Senate (49-53).
However, members of Congress would be a different story.
Worst case, 36 of the new 44 members would be Democrats and just 8 would Republicans (based on the very generous criteria mentioned above).
Given that the Republicans currently have only 5 more seats than the Democrats in the House, we can safely assume adding Canada would give the Democrats a huge structural advantage in Congress for the foreseeable future. (It’s difficult to calculate by how much, because we don’t know how the the states losing representatives would redistrict).
And finally what would have happened in the 2024 Presidential Election if Canada had been a state. (Because of the extra 2 Canadian Senators there would be a total of 540 electoral college votes).
Assuming all states voted they way they did in 2024, but with corresponding fewer electoral college votes, Trump would still have won 287-253. See the map below:
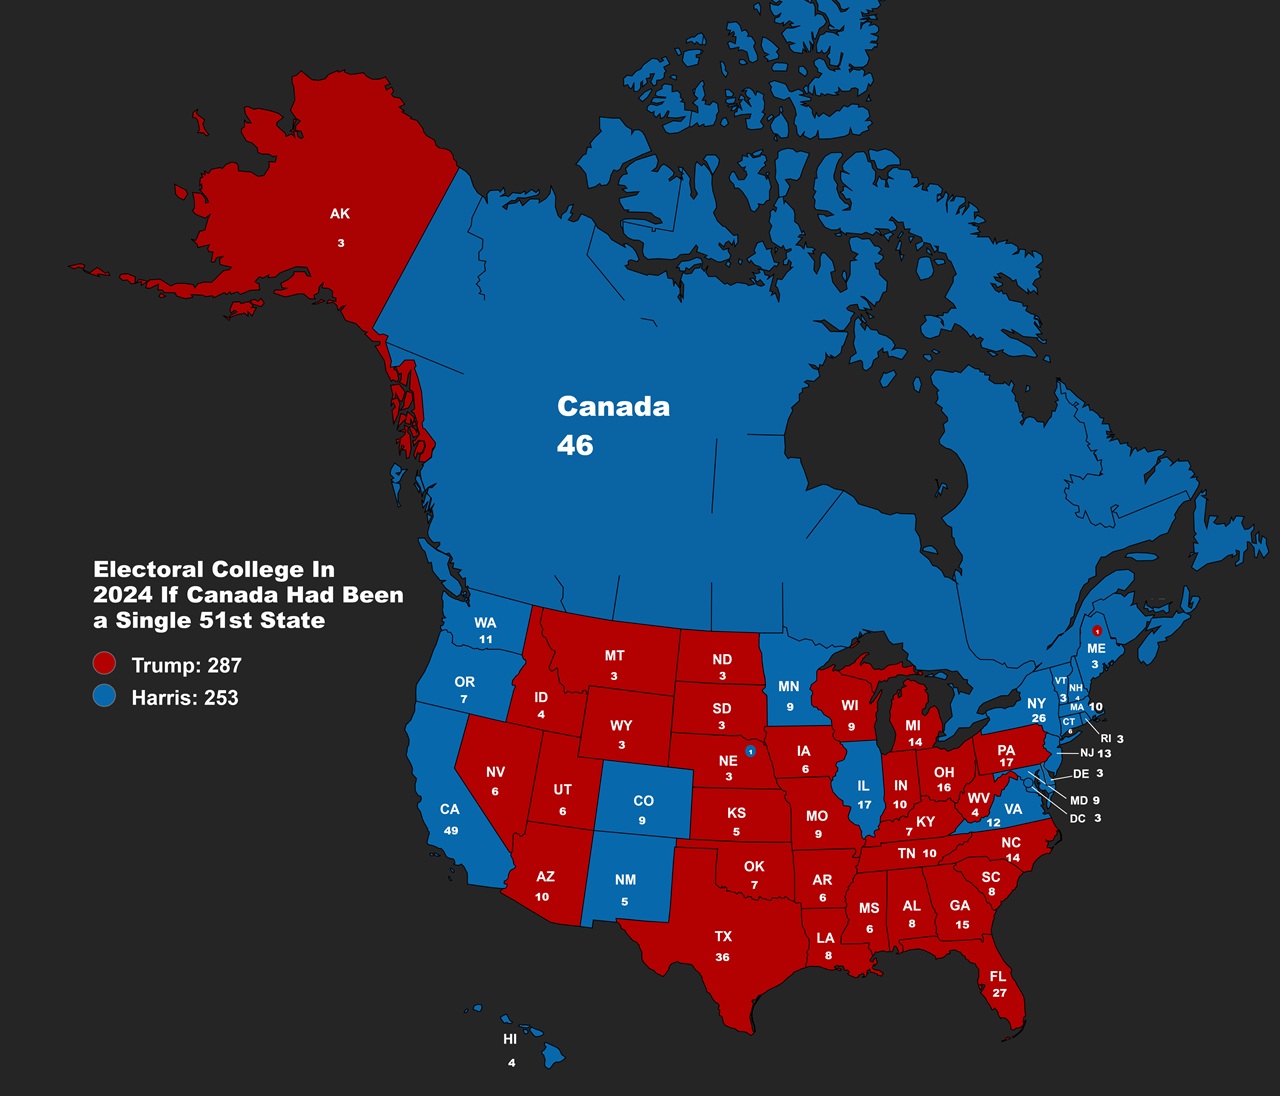
Therefore, with Canada coming in as 1 big state, the Republicans would retain control of the Senate (but with a reduced margin), still have won the Presidential election based on the 2024 results (although almost certainly losing the popular vote) BUT they would lose total control of the House for the foreseeable future.
So while it would be far from a complete disaster the Republicans, it does nothing to help them.
However, Canada coming in as 1 giant 51st state is highly unlikely.
Canada already has 10 provinces which work almost exactly like US states (we’ll ignore the 3 Canadian Territories for now, here’s why).
Therefore the most logical and likely way for Canada to join the US would be to just to turn each Canadian Province into a US state.
But then what happens politically?
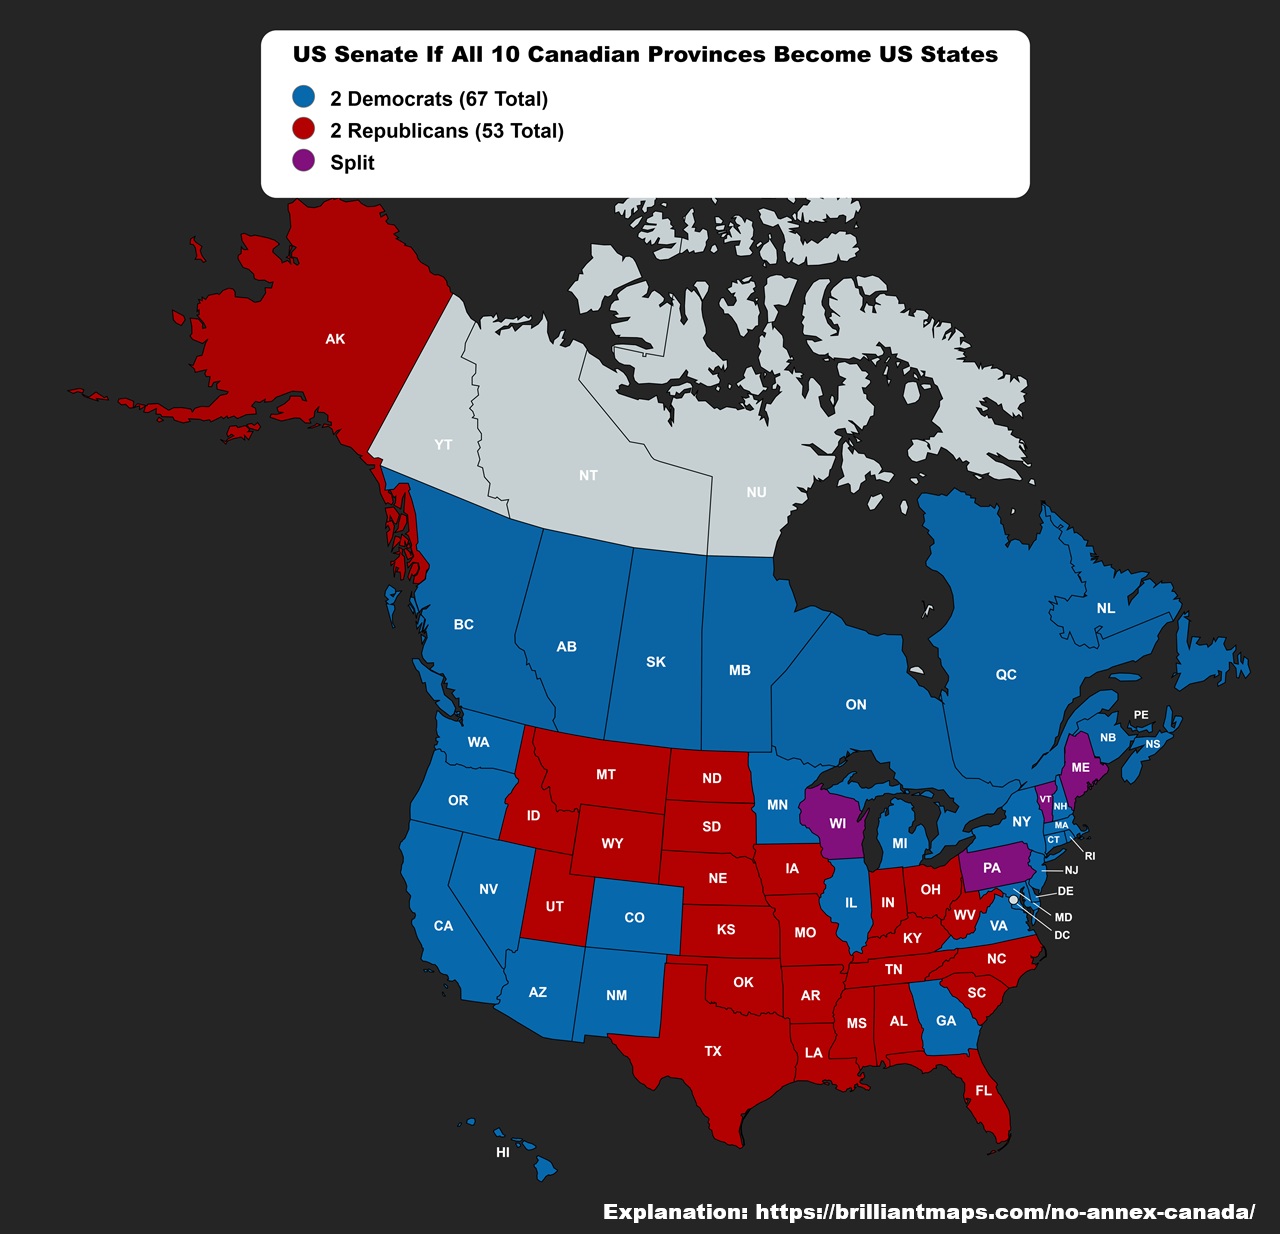
First of all, the former Canadian provinces would have 20 new Senators, all of whom (at least initially) would very likely be Democrats.
So the new enlarged Senate of 120 Senators would be split 67 Democrats to 53 Republicans. See map:
And here’s the number of Members of the House would look with the new Canadian States.
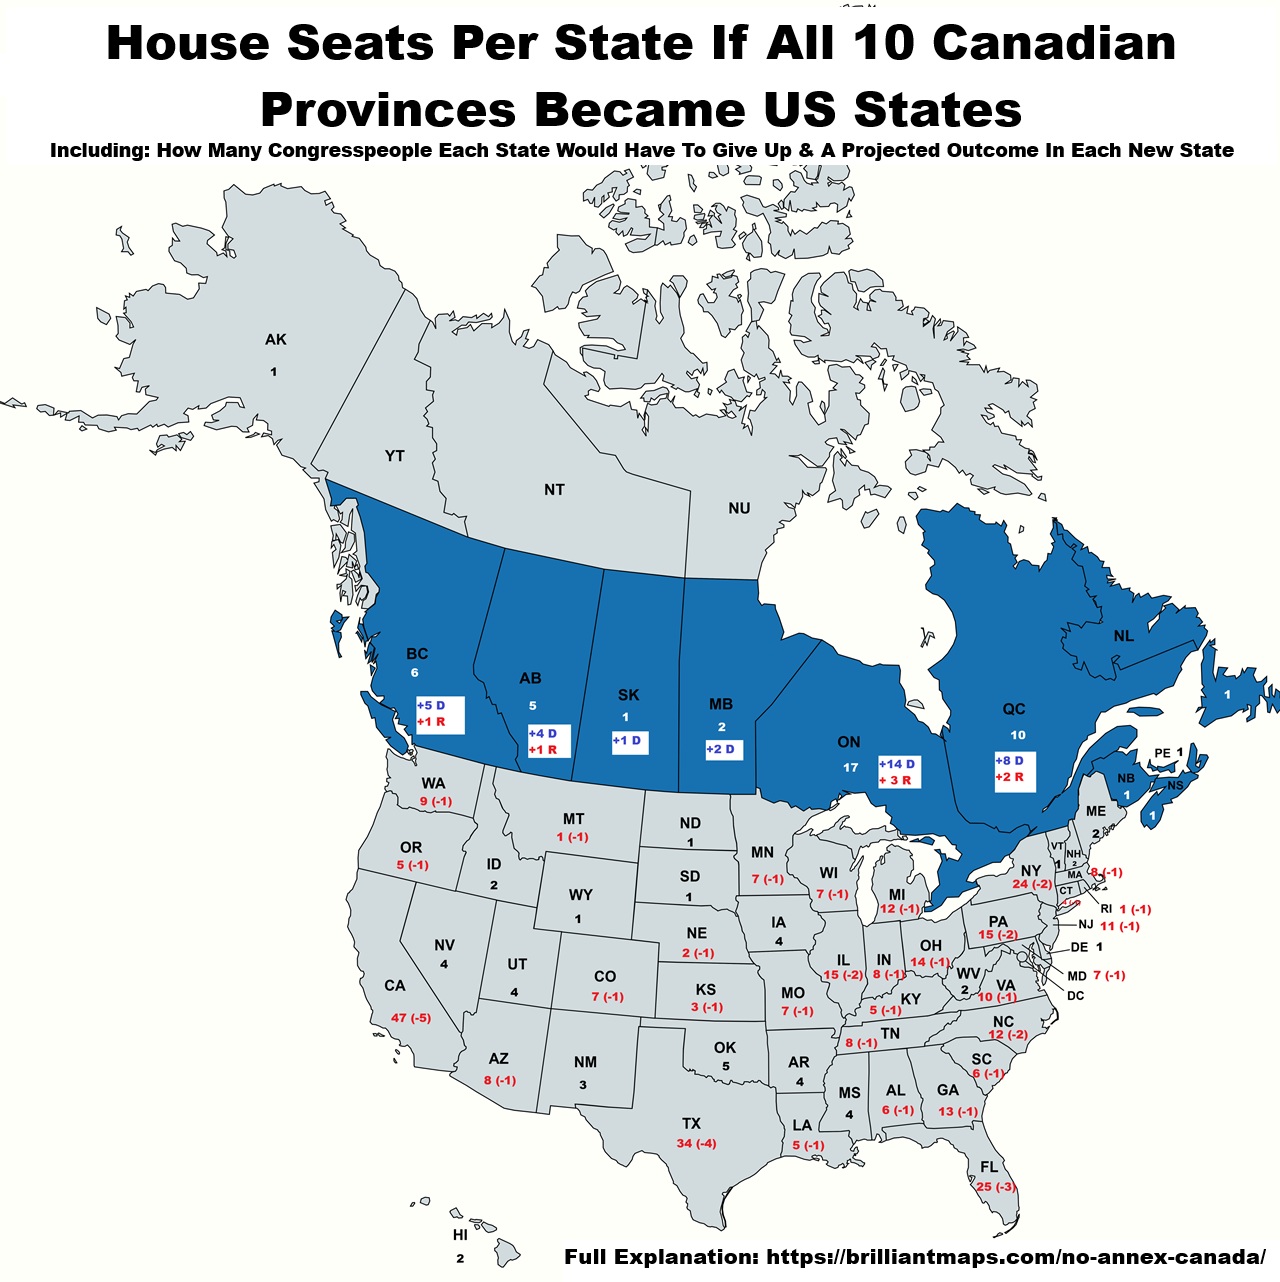
In this Canada would actually get 45 new Members of Congress compared to the 44 in the single 51st State Scenario due to the fact each state gets a least 1 Member of the House and Canada has several small provinces.
And in theory this would mean 38 Democrats vs just 7 Republicans.
| New Canadian States | Total Seats | Democrats | Republican |
|---|---|---|---|
| Ontario | 17 | 14 | 3 |
| Quebec | 10 | 8 | 2 |
| British Columbia | 6 | 5 | 1 |
| Alberta | 5 | 4 | 1 |
| Manitoba | 2 | 2 | 0 |
| Saskatchewan | 1 | 1 | 0 |
| Nova Scotia | 1 | 1 | 0 |
| New Brunswick | 1 | 1 | 0 |
| Newfoundland and Labrador | 1 | 1 | 0 |
| Prince Edward Island | 1 | 1 | 0 |
And how would this have changed the 2024 election?
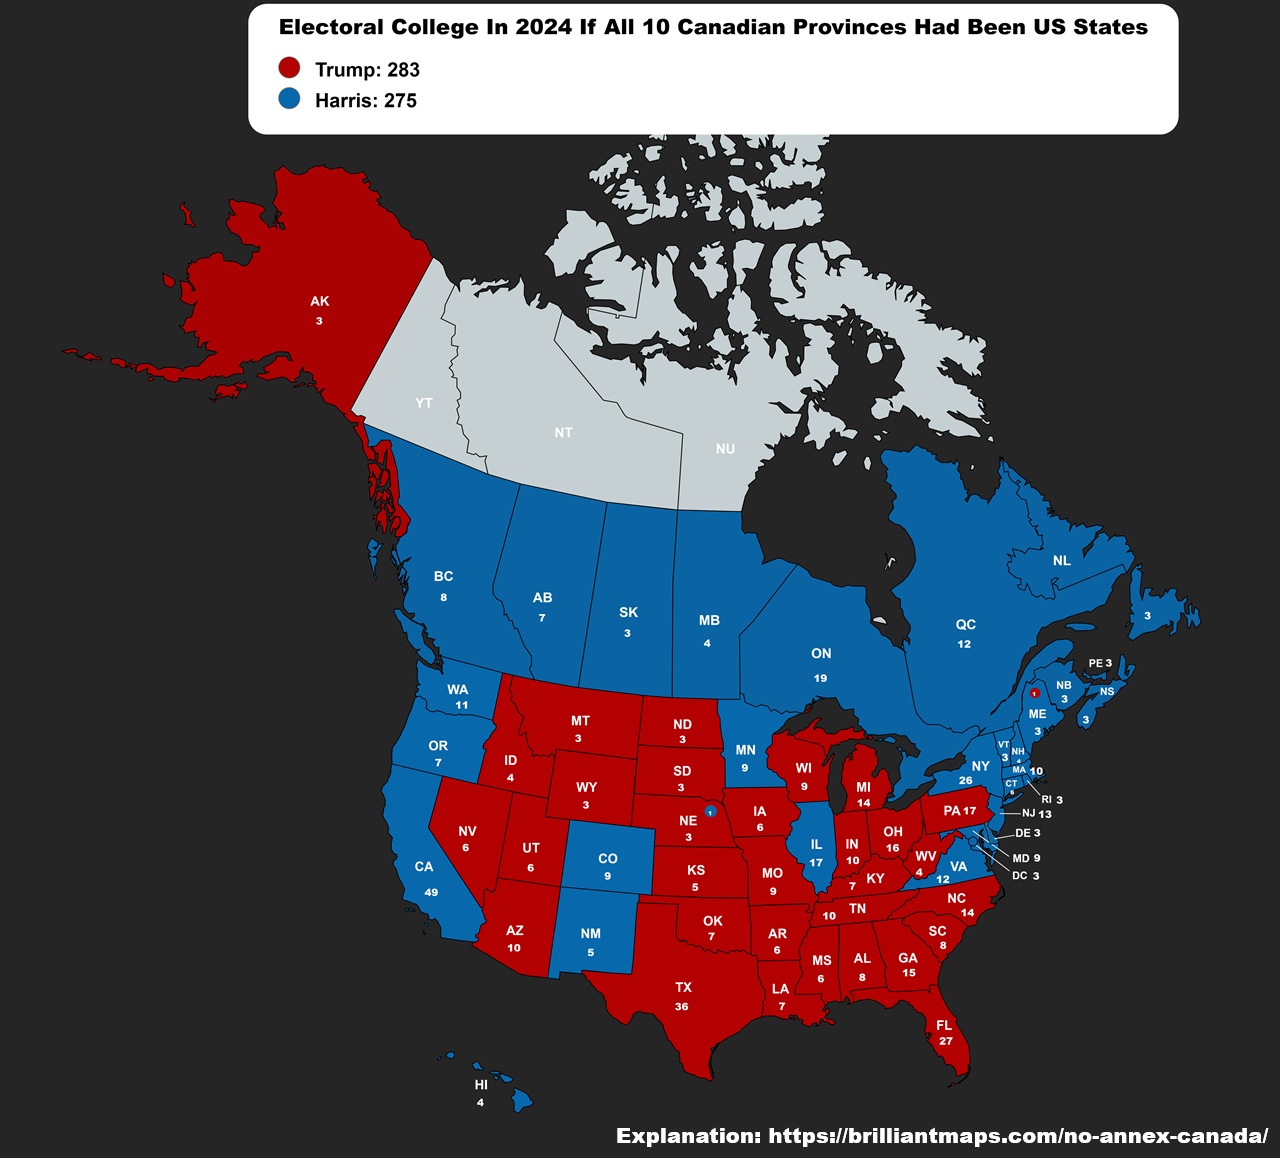
Amazingly, Donald Trump still would have won! But with a much, much closer Electoral College margin (and again losing the popular vote).
Results by state:
| State | Population | Seats | Winner | Population / Seat | Electroal College Votes |
|---|---|---|---|---|---|
| Alabama | 5,030,053 | (-1) 6 | Rep | 838,342 | 8 |
| Alaska | 736,081 | 1 | Rep | 736,081 | 3 |
| Alberta | 4,262,635 | 5 | Dem | 852,527 | 7 |
| Arizona | 7,158,923 | (-1) 8 | Rep | 894,865 | 10 |
| Arkansas | 3,013,756 | 4 | Rep | 753,439 | 6 |
| British Columbia | 5,000,879 | 6 | Dem | 833,480 | 8 |
| California | 39,576,757 | (-5) 47 | Dem | 842,059 | 49 |
| Colorado | 5,782,171 | (-1) 7 | Dem | 826,024 | 9 |
| Connecticut | 3,608,298 | (-1) 4 | Dem | 902,075 | 6 |
| DC | 689,545 | 0 | Dem | NA | 3 |
| Delaware | 990,837 | 1 | Dem | 990,837 | 3 |
| Florida | 21,570,527 | (-3) 25 | Rep | 862,821 | 27 |
| Georgia | 10,725,274 | (-1) 13 | Rep | 825,021 | 15 |
| Hawaiʻi | 1,460,137 | 2 | Dem | 730,069 | 4 |
| Idaho | 1,841,377 | 2 | Rep | 920,689 | 4 |
| Illinois | 12,822,739 | (-2) 15 | Dem | 854,849 | 17 |
| Indiana | 6,790,280 | (-1) 8 | Rep | 848,785 | 10 |
| Iowa | 3,192,406 | 4 | Rep | 798,102 | 6 |
| Kansas | 2,940,865 | (-1) 3 | Rep | 980,288 | 5 |
| Kentucky | 4,509,342 | (-1) 5 | Rep | 901,868 | 7 |
| Louisiana | 4,661,468 | (-1) 5 | Rep | 932,294 | 7 |
| Maine | 1,363,582 | 2 | Split | 681,791 | 4 |
| Manitoba | 1,342,153 | 2 | Dem | 671,077 | 4 |
| Maryland | 6,185,278 | (-1) 7 | Dem | 883,611 | 9 |
| Massachusetts | 7,033,469 | (-1) 8 | Dem | 879,184 | 10 |
| Michigan | 10,084,442 | (-1) 12 | Rep | 840,370 | 14 |
| Minnesota | 5,709,752 | (-1) 7 | Dem | 815,679 | 9 |
| Mississippi | 2,963,914 | 4 | Rep | 740,979 | 6 |
| Missouri | 6,160,281 | (-1) 7 | Rep | 880,040 | 9 |
| Montana | 1,085,407 | (-1) 1 | Rep | 1,085,407 | 3 |
| Nebraska | 1,963,333 | (-1) 2 | Split | 981,667 | 4 |
| Nevada | 3,108,462 | 4 | Rep | 777,116 | 6 |
| New Brunswick | 775,610 | 1 | Dem | 775,610 | 3 |
| New Hampshire | 1,379,089 | 2 | Dem | 689,545 | 4 |
| New Jersey | 9,294,493 | (-1) 11 | Dem | 844,954 | 13 |
| New Mexico | 2,120,220 | 3 | Dem | 706,740 | 5 |
| New York | 20,215,751 | (-2) 24 | Dem | 842,323 | 26 |
| Newfoundland and Labrador | 510,550 | 1 | Dem | 510,550 | 3 |
| North Carolina | 10,453,948 | (-2) 12 | Rep | 871,162 | 14 |
| North Dakota | 779,702 | 1 | Rep | 779,702 | 3 |
| Nova Scotia | 969,383 | 1 | Dem | 969,383 | 3 |
| Ohio | 11,808,848 | (-1) 14 | Rep | 843,489 | 16 |
| Oklahoma | 3,963,516 | 5 | Rep | 792,703 | 7 |
| Ontario | 14,223,942 | 17 | Dem | 836,702 | 19 |
| Oregon | 4,241,500 | (-1) 5 | Dem | 848,300 | 7 |
| Pennsylvania | 13,011,844 | (-2) 15 | Rep | 867,456 | 17 |
| Prince Edward Island | 154,331 | 1 | Dem | 154,331 | 3 |
| Quebec | 8,501,833 | 10 | Dem | 850,183 | 12 |
| Rhode Island | 1,098,163 | (-1) 1 | Dem | 1,098,163 | 3 |
| Saskatchewan | 1,132,505 | 1 | Dem | 1,132,505 | 3 |
| South Carolina | 5,124,712 | (-1) 6 | Rep | 854,119 | 8 |
| South Dakota | 887,770 | 1 | Rep | 887,770 | 3 |
| Tennessee | 6,916,897 | (-1) 8 | Rep | 864,612 | 10 |
| Texas | 29,183,290 | (-4) 34 | Rep | 858,332 | 36 |
| Utah | 3,275,252 | 4 | Rep | 818,813 | 6 |
| Vermont | 643,503 | 1 | Dem | 643,503 | 3 |
| Virginia | 8,654,542 | (-1) 10 | Dem | 865,454 | 12 |
| Washington | 7,715,946 | (-1) 9 | Dem | 857,327 | 11 |
| West Virginia | 1,795,045 | 2 | Rep | 897,523 | 4 |
| Wisconsin | 5,897,473 | (-1) 7 | Rep | 842,496 | 9 |
| Wyoming | 577,719 | 1 | Dem | 577,719 | 3 |
So while, Donald Trump would keep his job in this scenario, Republicans would lose both branches of Congress, which would make any future Republican’s job much more difficult.
Finally, for any Republicans still not convinced. The map below should also help:
Map of GDP Per Capita in US States & Canadian Provinces

The US is simply much richer than Canada. Canada’s average is GDP per capita is $54,236 (USD) vs the United States at $77,190.
You can see the breakdown by state and province here, but Canada’s two largest provinces Ontario and Quebec have GDP per capita’s between that of Mississippi and West Virginia.
Which means not only would Republicans lose control control of Congress, the rest of the country would likely have to foot a rather large bill to support their 10 new states.
What do you think of the plan?


Leave a Reply