It feels like there is a lot of doom and gloom in the world today, from global warming to crime to economic and integrational inequality to political polarization, etc.
It’s very easy to get wrapped up in this negative view of the world and I’m far from immune to it.
I’m now in my early 40s and have 3 young kids and I regularly worry about the type of world they’ll grow up and live in.
However, I thought it might be an interesting exercise to see how the world has changed in the last 40ish years.
And what I’ve found is that so much has gotten better for billions of people.
Past performance is no guarantee of future performance, but I think it’s very important that we believe and act to make the world a better place for our kids.
And now on to the maps (note all data maps come from Our World In Data and specific countries are only included if they appear in both datasets.):
Life Expectancy At Birth 1982 vs 2021

Between 1982 and 2021 only 6 countries experienced a decline in life expectancy: Lesotho, Eswatini, Saint Vincent and the Grenadines, Zimbabwe, Botswana and Dominica.
All others saw at least some increase, with 11 seeing increase in life expectancy of 20+ years!
The Data:
| Country | Life expectancy at birth 1982 | Life expectancy at birth 2021 | Absoulte Change In Number of Years | Relative Change |
|---|---|---|---|---|
| Afghanistan | 37.77 | 61.98 | 24.22 | 64.1% |
| Africa | 50.28 | 61.66 | 11.38 | 22.6% |
| Albania | 71.02 | 76.46 | 5.44 | 7.7% |
| Algeria | 57.43 | 76.38 | 18.95 | 33.0% |
| American Samoa | 69.31 | 72.54 | 3.23 | 4.7% |
| Americas | 68.32 | 74.19 | 5.87 | 8.6% |
| Andorra | 77.54 | 80.37 | 2.83 | 3.6% |
| Angola | 43.05 | 61.64 | 18.59 | 43.2% |
| Anguilla | 69.35 | 76.61 | 7.26 | 10.5% |
| Antigua and Barbuda | 73.46 | 78.50 | 5.04 | 6.9% |
| Argentina | 68.94 | 75.39 | 6.45 | 9.4% |
| Armenia | 66.89 | 72.04 | 5.15 | 7.7% |
| Aruba | 71.96 | 74.63 | 2.67 | 3.7% |
| Asia | 60.61 | 72.53 | 11.92 | 19.7% |
| Australia | 74.72 | 84.53 | 9.81 | 13.1% |
| Austria | 73.14 | 81.58 | 8.43 | 11.5% |
| Azerbaijan | 61.45 | 69.37 | 7.92 | 12.9% |
| Bahamas | 68.44 | 71.60 | 3.16 | 4.6% |
| Bahrain | 71.47 | 78.76 | 7.29 | 10.2% |
| Bangladesh | 52.54 | 72.38 | 19.84 | 37.8% |
| Barbados | 72.30 | 77.57 | 5.27 | 7.3% |
| Belarus | 70.46 | 72.44 | 1.98 | 2.8% |
| Belgium | 73.88 | 81.88 | 8.00 | 10.8% |
| Belize | 67.95 | 70.47 | 2.52 | 3.7% |
| Benin | 48.81 | 59.82 | 11.01 | 22.6% |
| Bermuda | 73.75 | 79.28 | 5.53 | 7.5% |
| Bhutan | 49.85 | 71.82 | 21.96 | 44.1% |
| Bolivia | 52.05 | 63.63 | 11.58 | 22.2% |
| Bonaire Sint Eustatius and Saba | 73.63 | 75.09 | 1.46 | 2.0% |
| Bosnia and Herzegovina | 70.87 | 75.30 | 4.43 | 6.2% |
| Botswana | 61.57 | 61.14 | -0.43 | -0.7% |
| Brazil | 62.86 | 72.75 | 9.89 | 15.7% |
| British Virgin Islands | 69.87 | 74.49 | 4.62 | 6.6% |
| Brunei | 69.84 | 74.64 | 4.80 | 6.9% |
| Bulgaria | 71.11 | 71.80 | 0.69 | 1.0% |
| Burkina Faso | 47.60 | 59.27 | 11.67 | 24.5% |
| Burundi | 47.29 | 61.66 | 14.37 | 30.4% |
| Cambodia | 48.74 | 69.58 | 20.85 | 42.8% |
| Cameroon | 52.08 | 60.33 | 8.25 | 15.8% |
| Canada | 75.69 | 82.66 | 6.96 | 9.2% |
| Cape Verde | 61.67 | 74.05 | 12.38 | 20.1% |
| Cayman Islands | 70.93 | 75.13 | 4.19 | 5.9% |
| Central African Republic | 50.30 | 53.89 | 3.59 | 7.1% |
| Chad | 43.73 | 52.53 | 8.80 | 20.1% |
| Chile | 70.30 | 78.94 | 8.64 | 12.3% |
| China | 65.46 | 78.21 | 12.75 | 19.5% |
| Colombia | 67.53 | 72.83 | 5.30 | 7.8% |
| Comoros | 51.89 | 63.42 | 11.52 | 22.2% |
| Congo | 57.02 | 63.52 | 6.50 | 11.4% |
| Cook Islands | 66.28 | 74.76 | 8.48 | 12.8% |
| Costa Rica | 74.65 | 77.02 | 2.37 | 3.2% |
| Cote d'Ivoire | 52.92 | 58.60 | 5.68 | 10.7% |
| Croatia | 69.57 | 77.58 | 8.01 | 11.5% |
| Cuba | 73.13 | 73.68 | 0.55 | 0.8% |
| Curacao | 71.27 | 75.44 | 4.17 | 5.9% |
| Cyprus | 71.98 | 81.20 | 9.22 | 12.8% |
| Czechia | 70.88 | 77.73 | 6.85 | 9.7% |
| Democratic Republic of Congo | 45.92 | 59.19 | 13.27 | 28.9% |
| Denmark | 74.59 | 81.38 | 6.78 | 9.1% |
| Djibouti | 52.77 | 62.30 | 9.54 | 18.1% |
| Dominica | 72.99 | 72.81 | -0.18 | -0.2% |
| Dominican Republic | 62.65 | 72.61 | 9.97 | 15.9% |
| East Timor | 30.82 | 67.74 | 36.91 | 119.8% |
| Ecuador | 64.11 | 73.67 | 9.56 | 14.9% |
| Egypt | 57.95 | 70.22 | 12.27 | 21.2% |
| El Salvador | 51.10 | 70.75 | 19.64 | 38.4% |
| Equatorial Guinea | 48.60 | 60.59 | 12.00 | 24.7% |
| Eritrea | 44.86 | 66.54 | 21.68 | 48.3% |
| Estonia | 69.73 | 77.14 | 7.42 | 10.6% |
| Eswatini | 59.02 | 57.07 | -1.95 | -3.3% |
| Ethiopia | 43.77 | 64.97 | 21.21 | 48.5% |
| Europe | 71.53 | 77.03 | 5.50 | 7.7% |
| Falkland Islands | 52.19 | 78.62 | 26.43 | 50.7% |
| Faroe Islands | 75.68 | 79.26 | 3.58 | 4.7% |
| Fiji | 62.79 | 67.11 | 4.32 | 6.9% |
| Finland | 74.53 | 82.04 | 7.51 | 10.1% |
| France | 74.76 | 82.50 | 7.73 | 10.3% |
| French Guiana | 67.04 | 74.89 | 7.85 | 11.7% |
| French Polynesia | 68.88 | 79.49 | 10.60 | 15.4% |
| Gabon | 58.11 | 65.82 | 7.72 | 13.3% |
| Gambia | 46.38 | 62.08 | 15.71 | 33.9% |
| Georgia | 67.90 | 71.69 | 3.79 | 5.6% |
| Germany | 73.63 | 80.63 | 7.00 | 9.5% |
| Ghana | 51.38 | 63.80 | 12.41 | 24.2% |
| Gibraltar | 73.34 | 79.33 | 5.99 | 8.2% |
| Greece | 75.29 | 80.11 | 4.82 | 6.4% |
| Greenland | 63.47 | 72.35 | 8.88 | 14.0% |
| Grenada | 68.71 | 74.94 | 6.22 | 9.1% |
| Guadeloupe | 70.93 | 80.54 | 9.60 | 13.5% |
| Guam | 70.32 | 76.66 | 6.34 | 9.0% |
| Guatemala | 50.13 | 69.24 | 19.10 | 38.1% |
| Guernsey | 75.00 | 82.23 | 7.23 | 9.6% |
| Guinea | 43.93 | 58.89 | 14.97 | 34.1% |
| Guinea-Bissau | 44.37 | 59.65 | 15.28 | 34.4% |
| Guyana | 61.41 | 65.67 | 4.27 | 6.9% |
| Haiti | 50.55 | 63.19 | 12.64 | 25.0% |
| High-income countries | 73.66 | 80.27 | 6.61 | 9.0% |
| Honduras | 61.53 | 70.12 | 8.60 | 14.0% |
| Hong Kong | 75.64 | 85.47 | 9.84 | 13.0% |
| Hungary | 69.35 | 74.53 | 5.18 | 7.5% |
| Iceland | 76.77 | 82.68 | 5.90 | 7.7% |
| India | 54.73 | 67.24 | 12.51 | 22.9% |
| Indonesia | 59.76 | 67.57 | 7.81 | 13.1% |
| Iran | 57.73 | 73.87 | 16.14 | 28.0% |
| Iraq | 59.73 | 70.38 | 10.65 | 17.8% |
| Ireland | 73.16 | 82.00 | 8.84 | 12.1% |
| Isle of Man | 69.10 | 80.53 | 11.42 | 16.5% |
| Israel | 73.81 | 82.26 | 8.45 | 11.4% |
| Italy | 74.91 | 82.85 | 7.94 | 10.6% |
| Jamaica | 70.24 | 70.50 | 0.26 | 0.4% |
| Japan | 77.06 | 84.78 | 7.72 | 10.0% |
| Jersey | 74.78 | 80.66 | 5.88 | 7.9% |
| Jordan | 67.15 | 74.26 | 7.10 | 10.6% |
| Kazakhstan | 63.36 | 69.36 | 6.00 | 9.5% |
| Kenya | 60.95 | 61.43 | 0.47 | 0.8% |
| Kiribati | 57.72 | 67.42 | 9.70 | 16.8% |
| Kosovo | 68.30 | 76.81 | 8.50 | 12.5% |
| Kuwait | 71.50 | 78.67 | 7.18 | 10.0% |
| Kyrgyzstan | 61.85 | 69.98 | 8.13 | 13.1% |
| Land-locked Developing Countries (LLDC) | 49.73 | 63.71 | 13.98 | 28.1% |
| Laos | 49.40 | 68.06 | 18.66 | 37.8% |
| Latin America and the Caribbean | 64.14 | 72.16 | 8.02 | 12.5% |
| Latvia | 69.68 | 73.58 | 3.90 | 5.6% |
| Least developed countries | 48.26 | 64.07 | 15.81 | 32.8% |
| Lebanon | 45.13 | 75.05 | 29.92 | 66.3% |
| Lesotho | 57.57 | 53.06 | -4.50 | -7.8% |
| Less developed regions | 58.69 | 69.56 | 10.87 | 18.5% |
| Less developed regions, excluding China | 56.54 | 67.18 | 10.63 | 18.8% |
| Less developed regions, excluding least developed countries | 60.54 | 70.74 | 10.20 | 16.8% |
| Liberia | 45.20 | 60.75 | 15.54 | 34.4% |
| Libya | 65.81 | 71.91 | 6.10 | 9.3% |
| Liechtenstein | 69.51 | 83.26 | 13.75 | 19.8% |
| Lithuania | 71.16 | 73.72 | 2.56 | 3.6% |
| Low-income countries | 47.13 | 62.45 | 15.32 | 32.5% |
| Lower-middle-income countries | 55.93 | 66.45 | 10.51 | 18.8% |
| Luxembourg | 72.74 | 82.63 | 9.89 | 13.6% |
| Macao | 74.34 | 85.40 | 11.06 | 14.9% |
| Madagascar | 49.63 | 64.49 | 14.85 | 29.9% |
| Malawi | 45.99 | 62.90 | 16.91 | 36.8% |
| Malaysia | 69.24 | 74.88 | 5.64 | 8.2% |
| Maldives | 57.30 | 79.92 | 22.62 | 39.5% |
| Mali | 41.82 | 58.94 | 17.12 | 40.9% |
| Malta | 70.90 | 83.78 | 12.88 | 18.2% |
| Marshall Islands | 61.40 | 65.27 | 3.87 | 6.3% |
| Martinique | 71.56 | 80.69 | 9.13 | 12.8% |
| Mauritania | 56.27 | 64.36 | 8.09 | 14.4% |
| Mauritius | 66.94 | 73.56 | 6.61 | 9.9% |
| Mayotte | 69.22 | 74.23 | 5.01 | 7.2% |
| Mexico | 65.97 | 70.21 | 4.24 | 6.4% |
| Micronesia (country) | 64.82 | 70.71 | 5.89 | 9.1% |
| Middle-income countries | 59.97 | 70.11 | 10.14 | 16.9% |
| Moldova | 66.18 | 68.85 | 2.67 | 4.0% |
| Monaco | 75.39 | 85.95 | 10.56 | 14.0% |
| Mongolia | 55.78 | 70.98 | 15.20 | 27.2% |
| Montenegro | 71.30 | 76.34 | 5.04 | 7.1% |
| Montserrat | 69.83 | 75.59 | 5.76 | 8.3% |
| More developed regions | 72.79 | 78.07 | 5.27 | 7.2% |
| Morocco | 56.90 | 74.04 | 17.15 | 30.1% |
| Mozambique | 40.70 | 59.32 | 18.62 | 45.7% |
| Myanmar | 54.95 | 65.67 | 10.72 | 19.5% |
| Namibia | 57.64 | 59.27 | 1.63 | 2.8% |
| Nauru | 61.88 | 63.62 | 1.74 | 2.8% |
| Nepal | 48.94 | 68.45 | 19.51 | 39.9% |
| Netherlands | 76.06 | 81.69 | 5.63 | 7.4% |
| New Caledonia | 66.93 | 79.02 | 12.09 | 18.1% |
| New Zealand | 73.72 | 82.45 | 8.73 | 11.8% |
| Nicaragua | 58.61 | 73.84 | 15.23 | 26.0% |
| Niger | 40.30 | 61.58 | 21.28 | 52.8% |
| Nigeria | 46.51 | 52.68 | 6.16 | 13.3% |
| Niue | 68.78 | 70.82 | 2.04 | 3.0% |
| No income group available | 69.42 | 70.58 | 1.16 | 1.7% |
| North Korea | 67.17 | 73.28 | 6.12 | 9.1% |
| North Macedonia | 69.98 | 73.84 | 3.86 | 5.5% |
| Northern America | 74.57 | 77.73 | 3.16 | 4.2% |
| Northern Mariana Islands | 69.39 | 77.19 | 7.80 | 11.2% |
| Norway | 76.02 | 83.23 | 7.21 | 9.5% |
| Oceania | 70.92 | 79.44 | 8.53 | 12.0% |
| Oman | 62.96 | 72.54 | 9.58 | 15.2% |
| Pakistan | 58.42 | 66.10 | 7.68 | 13.2% |
| Palau | 61.19 | 66.02 | 4.83 | 7.9% |
| Palestine | 63.45 | 73.47 | 10.02 | 15.8% |
| Panama | 69.94 | 76.22 | 6.28 | 9.0% |
| Papua New Guinea | 58.11 | 65.35 | 7.24 | 12.5% |
| Paraguay | 65.38 | 70.26 | 4.88 | 7.5% |
| Peru | 60.02 | 72.38 | 12.36 | 20.6% |
| Philippines | 62.78 | 69.27 | 6.48 | 10.3% |
| Poland | 70.99 | 76.46 | 5.47 | 7.7% |
| Portugal | 72.70 | 81.04 | 8.34 | 11.5% |
| Puerto Rico | 73.52 | 80.16 | 6.64 | 9.0% |
| Qatar | 71.50 | 79.27 | 7.77 | 10.9% |
| Reunion | 69.30 | 81.61 | 12.31 | 17.8% |
| Romania | 69.45 | 74.18 | 4.73 | 6.8% |
| Russia | 66.98 | 69.42 | 2.44 | 3.6% |
| Rwanda | 50.69 | 66.07 | 15.38 | 30.3% |
| Saint Barthelemy | 73.04 | 80.43 | 7.39 | 10.1% |
| Saint Helena | 70.12 | 76.84 | 6.72 | 9.6% |
| Saint Kitts and Nevis | 64.28 | 71.68 | 7.40 | 11.5% |
| Saint Lucia | 69.05 | 71.11 | 2.06 | 3.0% |
| Saint Martin (French part) | 73.02 | 80.38 | 7.36 | 10.1% |
| Saint Pierre and Miquelon | 71.60 | 77.19 | 5.59 | 7.8% |
| Saint Vincent and the Grenadines | 70.43 | 69.63 | -0.80 | -1.1% |
| Samoa | 65.42 | 72.77 | 7.35 | 11.2% |
| San Marino | 77.06 | 80.88 | 3.82 | 5.0% |
| Sao Tome and Principe | 59.56 | 67.59 | 8.03 | 13.5% |
| Saudi Arabia | 64.30 | 76.94 | 12.63 | 19.6% |
| Senegal | 50.56 | 67.09 | 16.53 | 32.7% |
| Serbia | 68.75 | 74.19 | 5.44 | 7.9% |
| Seychelles | 66.55 | 71.29 | 4.75 | 7.1% |
| Sierra Leone | 43.57 | 60.06 | 16.49 | 37.8% |
| Singapore | 72.26 | 82.75 | 10.50 | 14.5% |
| Sint Maarten (Dutch part) | 72.43 | 73.97 | 1.54 | 2.1% |
| Slovakia | 70.76 | 74.91 | 4.15 | 5.9% |
| Slovenia | 70.84 | 80.69 | 9.85 | 13.9% |
| Small Island Developing States (SIDS) | 62.94 | 70.81 | 7.87 | 12.5% |
| Solomon Islands | 63.51 | 70.35 | 6.84 | 10.8% |
| Somalia | 47.83 | 55.28 | 7.45 | 15.6% |
| South Africa | 60.93 | 62.34 | 1.41 | 2.3% |
| South Korea | 67.59 | 83.70 | 16.11 | 23.8% |
| South Sudan | 39.11 | 54.98 | 15.86 | 40.6% |
| Spain | 76.32 | 83.01 | 6.69 | 8.8% |
| Sri Lanka | 69.67 | 76.40 | 6.72 | 9.7% |
| Sudan | 54.32 | 65.27 | 10.95 | 20.1% |
| Suriname | 62.46 | 70.27 | 7.82 | 12.5% |
| Sweden | 76.35 | 82.98 | 6.63 | 8.7% |
| Switzerland | 76.16 | 83.99 | 7.83 | 10.3% |
| Syria | 61.12 | 72.06 | 10.94 | 17.9% |
| Taiwan | 72.51 | 81.01 | 8.50 | 11.7% |
| Tajikistan | 59.68 | 71.59 | 11.91 | 20.0% |
| Tanzania | 51.53 | 66.20 | 14.67 | 28.5% |
| Thailand | 65.16 | 78.72 | 13.55 | 20.8% |
| Togo | 52.26 | 61.62 | 9.36 | 17.9% |
| Tokelau | 66.13 | 75.23 | 9.09 | 13.8% |
| Tonga | 66.07 | 70.99 | 4.91 | 7.4% |
| Trinidad and Tobago | 67.65 | 72.97 | 5.32 | 7.9% |
| Tunisia | 65.42 | 73.77 | 8.35 | 12.8% |
| Turkey | 63.60 | 76.03 | 12.43 | 19.5% |
| Turkmenistan | 61.60 | 69.26 | 7.66 | 12.4% |
| Turks and Caicos Islands | 68.39 | 74.59 | 6.20 | 9.1% |
| Tuvalu | 61.33 | 64.55 | 3.22 | 5.2% |
| Uganda | 43.19 | 62.70 | 19.52 | 45.2% |
| Ukraine | 69.28 | 71.62 | 2.34 | 3.4% |
| United Arab Emirates | 69.66 | 78.71 | 9.05 | 13.0% |
| United Kingdom | 74.04 | 80.74 | 6.70 | 9.1% |
| United States | 74.45 | 77.20 | 2.75 | 3.7% |
| United States Virgin Islands | 69.17 | 74.72 | 5.55 | 8.0% |
| Upper-middle-income countries | 65.16 | 75.28 | 10.12 | 15.5% |
| Uruguay | 71.22 | 75.44 | 4.21 | 5.9% |
| Uzbekistan | 63.56 | 70.86 | 7.30 | 11.5% |
| Vanuatu | 62.54 | 70.45 | 7.91 | 12.7% |
| Venezuela | 69.72 | 70.55 | 0.83 | 1.2% |
| Vietnam | 67.11 | 73.62 | 6.51 | 9.7% |
| Wallis and Futuna | 60.92 | 78.44 | 17.52 | 28.8% |
| Western Sahara | 46.65 | 70.78 | 24.13 | 51.7% |
| World | 61.42 | 71.05 | 9.63 | 15.7% |
| Yemen | 52.41 | 63.75 | 11.35 | 21.7% |
| Zambia | 53.86 | 61.22 | 7.36 | 13.7% |
| Zimbabwe | 59.87 | 59.25 | -0.62 | -1.0% |
GDP Per Capita 1982 vs 2022

In terms of real GDP per capita (e.g. controlling for inflation), 17 countries experienced real GDP per capita declines during this period with Liberia, Syria, Venezuela, and the Central African Republic seeing sever 50%+ declines.
However, 86 countries experienced GDP growth of over 100% during this period; including the world’s two most populous countries India (395% growth) and China (804%) and 9 out of the top 10 by population (Brazil just missed out on 100%, by only growing 93% during the past 40 years).
In fact China had the largest relative increase of any country on earth, big or small during this time.
Qatar was the biggest winner in absolute terms with a GDP increase of $120,125 USD per person during the 40 years.
The increase in GDP per capita has been the real standout story of the last 40 years.
The number of people lifted out of extreme poverty in China alone is a massive success worthy of celebration.
But what’s even better is that while no other country has grown as quickly, the vast majority of people live in countries where living standards have notably improved over the past 40 years.
The Data:
| Country | GDP per capita 1982 | GDP per capita 2022 | Absolute Change | Relative Change |
|---|---|---|---|---|
| Afghanistan | $1,270 | $1,358 | $88 | 7% |
| Albania | $3,783 | $12,978 | $9,195 | 243% |
| Algeria | $5,145 | $13,506 | $8,361 | 163% |
| Angola | $1,374 | $6,119 | $4,745 | 345% |
| Argentina | $11,550 | $18,292 | $6,742 | 58% |
| Armenia | $9,809 | $13,838 | $4,029 | 41% |
| Australia | $22,972 | $52,049 | $29,077 | 127% |
| Austria | $22,254 | $43,793 | $21,539 | 97% |
| Azerbaijan | $7,831 | $17,683 | $9,852 | 126% |
| Bahrain | $7,036 | $38,652 | $31,616 | 449% |
| Bangladesh | $869 | $4,926 | $4,057 | 467% |
| Barbados | $11,424 | $11,546 | $122 | 1% |
| Belarus | $10,217 | $18,700 | $8,483 | 83% |
| Belgium | $23,071 | $41,872 | $18,801 | 81% |
| Benin | $1,862 | $2,477 | $615 | 33% |
| Bolivia | $3,816 | $6,481 | $2,665 | 70% |
| Bosnia and Herzegovina | $6,841 | $12,143 | $5,302 | 78% |
| Botswana | $2,640 | $16,352 | $13,712 | 519% |
| Brazil | $7,587 | $14,640 | $7,053 | 93% |
| Bulgaria | $10,154 | $20,592 | $10,438 | 103% |
| Burkina Faso | $1,183 | $1,705 | $522 | 44% |
| Burundi | $985 | $717 | $-268 | -27% |
| Cambodia | $1,358 | $3,944 | $2,586 | 190% |
| Cameroon | $2,257 | $2,812 | $555 | 25% |
| Canada | $25,151 | $45,530 | $20,379 | 81% |
| Cape Verde | $1,470 | $7,203 | $5,733 | 390% |
| Central African Republic | $1,208 | $596 | $-612 | -51% |
| Chad | $524 | $1,394 | $870 | 166% |
| Chile | $8,016 | $22,741 | $14,725 | 184% |
| China | $2,128 | $19,238 | $17,110 | 804% |
| Colombia | $6,698 | $14,469 | $7,771 | 116% |
| Comoros | $1,124 | $1,900 | $776 | 69% |
| Congo | $4,355 | $4,188 | $-167 | -4% |
| Costa Rica | $6,751 | $15,497 | $8,746 | 130% |
| Cote d'Ivoire | $3,131 | $4,012 | $881 | 28% |
| Croatia | $14,123 | $26,987 | $12,864 | 91% |
| Cuba | $4,487 | $7,649 | $3,162 | 70% |
| Cyprus | $10,131 | $31,523 | $21,392 | 211% |
| Czechia | $12,109 | $32,247 | $20,138 | 166% |
| Czechoslovakia | $12,824 | $30,641 | $17,817 | 139% |
| Democratic Republic of Congo | $920 | $844 | $-76 | -8% |
| Denmark | $24,807 | $50,690 | $25,883 | 104% |
| Djibouti | $3,043 | $3,623 | $580 | 19% |
| Dominica | $2,592 | $8,880 | $6,288 | 243% |
| Dominican Republic | $3,826 | $17,714 | $13,888 | 363% |
| Ecuador | $6,558 | $10,124 | $3,566 | 54% |
| Egypt | $3,543 | $13,205 | $9,662 | 273% |
| El Salvador | $3,339 | $9,219 | $5,880 | 176% |
| Equatorial Guinea | $2,533 | $22,707 | $20,174 | 796% |
| Estonia | $15,927 | $30,067 | $14,140 | 89% |
| Eswatini | $3,005 | $8,522 | $5,517 | 184% |
| Ethiopia | $980 | $2,289 | $1,309 | 134% |
| Finland | $21,495 | $40,701 | $19,206 | 89% |
| Former Sudan | $1,599 | $2,405 | $806 | 50% |
| France | $24,120 | $39,066 | $14,946 | 62% |
| Gabon | $8,099 | $15,721 | $7,622 | 94% |
| Gambia | $1,581 | $2,011 | $430 | 27% |
| Georgia | $11,611 | $14,360 | $2,749 | 24% |
| Germany | $22,380 | $46,648 | $24,268 | 108% |
| Ghana | $1,661 | $4,242 | $2,581 | 155% |
| Greece | $14,153 | $25,284 | $11,131 | 79% |
| Guatemala | $5,903 | $7,969 | $2,066 | 35% |
| Guinea | $858 | $1,809 | $951 | 111% |
| Guinea-Bissau | $1,195 | $1,625 | $430 | 36% |
| Haiti | $1,855 | $1,546 | $-309 | -17% |
| Honduras | $3,076 | $5,187 | $2,111 | 69% |
| Hong Kong | $18,527 | $48,289 | $29,762 | 161% |
| Hungary | $10,493 | $29,452 | $18,959 | 181% |
| Iceland | $25,477 | $42,146 | $16,669 | 65% |
| India | $1,570 | $7,766 | $6,196 | 395% |
| Indonesia | $2,941 | $12,802 | $9,861 | 335% |
| Iran | $6,535 | $18,473 | $11,938 | 183% |
| Iraq | $7,704 | $13,072 | $5,368 | 70% |
| Ireland | $14,061 | $60,257 | $46,196 | 329% |
| Israel | $18,155 | $36,649 | $18,494 | 102% |
| Italy | $21,123 | $36,224 | $15,101 | 71% |
| Jamaica | $5,019 | $7,482 | $2,463 | 49% |
| Japan | $22,440 | $38,269 | $15,829 | 71% |
| Jordan | $7,401 | $9,151 | $1,750 | 24% |
| Kazakhstan | $11,322 | $26,492 | $15,170 | 134% |
| Kenya | $1,680 | $3,404 | $1,724 | 103% |
| Kuwait | $13,845 | $71,534 | $57,689 | 417% |
| Kyrgyzstan | $5,726 | $5,305 | $-421 | -7% |
| Laos | $1,256 | $7,168 | $5,912 | 471% |
| Latvia | $14,190 | $27,220 | $13,030 | 92% |
| Lebanon | $2,823 | $10,341 | $7,518 | 266% |
| Lesotho | $1,576 | $2,313 | $737 | 47% |
| Liberia | $3,813 | $811 | $-3,002 | -79% |
| Libya | $6,661 | $12,755 | $6,094 | 91% |
| Lithuania | $13,654 | $30,863 | $17,209 | 126% |
| Luxembourg | $25,005 | $55,485 | $30,480 | 122% |
| Madagascar | $1,423 | $1,367 | $-56 | -4% |
| Malawi | $904 | $1,190 | $286 | 32% |
| Malaysia | $6,303 | $26,629 | $20,326 | 322% |
| Mali | $1,030 | $1,652 | $622 | 60% |
| Malta | $9,526 | $34,496 | $24,970 | 262% |
| Mauritania | $1,548 | $3,680 | $2,132 | 138% |
| Mauritius | $7,563 | $20,643 | $13,080 | 173% |
| Mexico | $10,240 | $16,235 | $5,995 | 59% |
| Moldova | $10,026 | $6,675 | $-3,351 | -33% |
| Mongolia | $1,814 | $13,443 | $11,629 | 641% |
| Montenegro | $7,790 | $20,942 | $13,152 | 169% |
| Morocco | $3,725 | $8,400 | $4,675 | 126% |
| Mozambique | $1,852 | $1,088 | $-764 | -41% |
| Myanmar | $1,417 | $5,177 | $3,760 | 265% |
| Namibia | $6,064 | $7,979 | $1,915 | 32% |
| Nepal | $1,135 | $3,014 | $1,879 | 166% |
| Netherlands | $22,780 | $49,670 | $26,890 | 118% |
| New Zealand | $20,715 | $38,250 | $17,535 | 85% |
| Nicaragua | $3,360 | $5,093 | $1,733 | 52% |
| Niger | $1,231 | $1,008 | $-223 | -18% |
| Nigeria | $1,784 | $5,070 | $3,286 | 184% |
| North Macedonia | $9,977 | $14,051 | $4,074 | 41% |
| Norway | $24,141 | $88,366 | $64,225 | 266% |
| Oman | $7,651 | $47,989 | $40,338 | 527% |
| Pakistan | $2,002 | $5,532 | $3,530 | 176% |
| Palestine | $5,088 | $4,775 | $-313 | -6% |
| Panama | $7,444 | $23,557 | $16,113 | 216% |
| Paraguay | $5,230 | $8,763 | $3,533 | 68% |
| Peru | $6,770 | $12,763 | $5,993 | 89% |
| Philippines | $3,859 | $8,371 | $4,512 | 117% |
| Poland | $8,429 | $32,468 | $24,039 | 285% |
| Portugal | $13,198 | $28,992 | $15,794 | 120% |
| Puerto Rico | $12,511 | $35,281 | $22,770 | 182% |
| Qatar | $29,046 | $149,171 | $120,125 | 414% |
| Romania | $6,490 | $26,198 | $19,707 | 304% |
| Russia | $12,267 | $25,437 | $13,170 | 107% |
| Rwanda | $1,680 | $2,198 | $518 | 31% |
| Saint Lucia | $3,102 | $10,452 | $7,350 | 237% |
| Sao Tome and Principe | $2,817 | $3,752 | $935 | 33% |
| Saudi Arabia | $20,535 | $53,517 | $32,982 | 161% |
| Senegal | $2,168 | $2,661 | $493 | 23% |
| Serbia | $10,949 | $17,098 | $6,149 | 56% |
| Seychelles | $5,786 | $31,055 | $25,269 | 437% |
| Sierra Leone | $1,610 | $1,690 | $80 | 5% |
| Singapore | $14,687 | $80,320 | $65,633 | 447% |
| Slovenia | $20,535 | $32,674 | $12,139 | 59% |
| South Africa | $6,891 | $11,416 | $4,525 | 66% |
| South Korea | $6,821 | $41,321 | $34,499 | 506% |
| Spain | $14,046 | $34,123 | $20,077 | 143% |
| Sri Lanka | $3,151 | $10,705 | $7,554 | 240% |
| Sweden | $24,002 | $47,126 | $23,124 | 96% |
| Switzerland | $27,661 | $63,323 | $35,662 | 129% |
| Syria | $10,817 | $2,495 | $-8,322 | -77% |
| Taiwan | $8,910 | $53,143 | $44,233 | 496% |
| Tajikistan | $5,498 | $5,508 | $10 | 0% |
| Tanzania | $905 | $3,057 | $2,152 | 238% |
| Thailand | $4,375 | $16,421 | $12,046 | 275% |
| Togo | $1,323 | $1,587 | $264 | 20% |
| Trinidad and Tobago | $18,771 | $25,773 | $7,002 | 37% |
| Tunisia | $4,713 | $10,914 | $6,201 | 132% |
| Turkey | $6,381 | $27,362 | $20,981 | 329% |
| Turkmenistan | $6,575 | $17,235 | $10,660 | 162% |
| USSR | $10,418 | $19,355 | $8,937 | 86% |
| Uganda | $972 | $2,122 | $1,150 | 118% |
| Ukraine | $8,934 | $7,749 | $-1,185 | -13% |
| United Arab Emirates | $36,635 | $77,204 | $40,569 | 111% |
| United Kingdom | $20,650 | $38,407 | $17,757 | 86% |
| United States | $29,210 | $58,487 | $29,277 | 100% |
| Uruguay | $9,578 | $20,182 | $10,604 | 111% |
| Uzbekistan | $7,594 | $12,559 | $4,965 | 65% |
| Venezuela | $15,423 | $5,267 | $-10,156 | -66% |
| Vietnam | $1,293 | $8,050 | $6,757 | 523% |
| Yemen | $3,724 | $1,959 | $-1,765 | -47% |
| Yugoslavia | $10,080 | $19,352 | $9,272 | 92% |
| Zambia | $1,398 | $3,342 | $1,944 | 139% |
| Zimbabwe | $2,240 | $1,704 | $-536 | -24% |
Child (Under 5) Mortality Rate 1982 vs 2022

All but one country (Dominica) saw their infant morality rate decline during the 40 year period. And most saw at least a 50% reduction.
And 7 countries Maldives, Saudi Arabia, Turkey, North Macedonia, South Korea, Mongolia and Estonia saw their infant mortality rates drop by more than 90%.
Niger was the worst performer in both 1982 and 2022. But the rate in 1982 was 32.46% which dropped to 11.73% in 2022. Now 11.73% is still far too high, but it’s massive improvement in 40 years.
The data:
| Country | Under-five mortality rate % 1982 | Under-five mortality rate % 2022 | Absloute Change | Relative Change |
|---|---|---|---|---|
| Afghanistan | 23.32 | 5.77 | -17.55 | -75.3% |
| Albania | 6.90 | 0.94 | -5.96 | -86.3% |
| Algeria | 12.04 | 2.18 | -9.86 | -81.9% |
| Angola | 23.43 | 6.69 | -16.74 | -71.5% |
| Antigua and Barbuda | 1.41 | 0.95 | -0.46 | -32.7% |
| Argentina | 3.66 | 0.94 | -2.71 | -74.2% |
| Armenia | 6.77 | 1.03 | -5.75 | -84.8% |
| Australia | 1.22 | 0.38 | -0.84 | -69.1% |
| Austria | 1.48 | 0.32 | -1.16 | -78.3% |
| Azerbaijan | 11.07 | 1.81 | -9.26 | -83.7% |
| Bahamas | 2.87 | 1.29 | -1.58 | -55.0% |
| Bahrain | 2.89 | 0.65 | -2.24 | -77.5% |
| Bangladesh | 19.52 | 2.88 | -16.64 | -85.3% |
| Barbados | 2.44 | 1.09 | -1.35 | -55.4% |
| Belarus | 1.94 | 0.26 | -1.68 | -86.7% |
| Belgium | 1.33 | 0.37 | -0.96 | -72.2% |
| Belize | 5.99 | 1.09 | -4.90 | -81.7% |
| Benin | 20.39 | 8.08 | -12.31 | -60.4% |
| Bhutan | 18.09 | 2.37 | -15.72 | -86.9% |
| Bolivia | 15.98 | 2.39 | -13.59 | -85.0% |
| Botswana | 6.48 | 3.87 | -2.60 | -40.2% |
| Brazil | 8.75 | 1.40 | -7.34 | -84.0% |
| British Virgin Islands | 3.26 | 1.31 | -1.96 | -59.9% |
| Brunei | 1.81 | 0.97 | -0.83 | -46.0% |
| Bulgaria | 2.22 | 0.61 | -1.61 | -72.6% |
| Burkina Faso | 22.75 | 7.88 | -14.87 | -65.4% |
| Burundi | 20.25 | 5.05 | -15.20 | -75.1% |
| Cambodia | 13.95 | 2.37 | -11.58 | -83.0% |
| Cameroon | 16.77 | 6.98 | -9.79 | -58.4% |
| Canada | 1.12 | 0.49 | -0.62 | -55.8% |
| Cape Verde | 7.84 | 1.23 | -6.61 | -84.3% |
| Central African Republic | 18.39 | 9.68 | -8.71 | -47.4% |
| Chad | 23.54 | 10.29 | -13.25 | -56.3% |
| Chile | 2.70 | 0.63 | -2.07 | -76.7% |
| China | 5.76 | 0.66 | -5.10 | -88.5% |
| Colombia | 5.18 | 1.24 | -3.94 | -76.1% |
| Comoros | 16.43 | 4.82 | -11.62 | -70.7% |
| Congo | 10.17 | 4.16 | -6.01 | -59.1% |
| Cook Islands | 2.73 | 0.69 | -2.03 | -74.5% |
| Costa Rica | 2.29 | 0.77 | -1.51 | -66.1% |
| Cote d'Ivoire | 16.13 | 6.94 | -9.20 | -57.0% |
| Croatia | 2.10 | 0.46 | -1.64 | -78.1% |
| Cuba | 2.00 | 0.80 | -1.20 | -60.2% |
| Cyprus | 1.78 | 0.35 | -1.43 | -80.3% |
| Czechia | 1.52 | 0.26 | -1.26 | -82.7% |
| Democratic Republic of Congo | 20.63 | 7.56 | -13.07 | -63.4% |
| Denmark | 0.96 | 0.35 | -0.61 | -63.4% |
| Djibouti | 14.47 | 5.19 | -9.28 | -64.1% |
| Dominica | 2.22 | 3.22 | 1.00 | 44.8% |
| Dominican Republic | 8.06 | 3.24 | -4.82 | -59.8% |
| Ecuador | 8.21 | 1.22 | -6.99 | -85.2% |
| Egypt | 14.89 | 1.81 | -13.08 | -87.9% |
| El Salvador | 9.46 | 1.19 | -8.27 | -87.4% |
| Equatorial Guinea | 20.11 | 7.34 | -12.77 | -63.5% |
| Eritrea | 18.83 | 3.66 | -15.17 | -80.6% |
| Estonia | 2.09 | 0.19 | -1.90 | -91.0% |
| Eswatini | 10.26 | 5.00 | -5.25 | -51.2% |
| Ethiopia | 23.53 | 4.62 | -18.90 | -80.4% |
| Fiji | 4.05 | 2.82 | -1.23 | -30.3% |
| Finland | 0.79 | 0.23 | -0.56 | -70.6% |
| France | 1.15 | 0.41 | -0.74 | -64.6% |
| Gabon | 11.21 | 3.88 | -7.33 | -65.4% |
| Gambia | 21.70 | 4.56 | -17.14 | -79.0% |
| Georgia | 5.48 | 0.93 | -4.55 | -83.0% |
| Germany | 1.32 | 0.36 | -0.97 | -73.0% |
| Ghana | 16.42 | 4.23 | -12.19 | -74.2% |
| Greece | 1.72 | 0.39 | -1.33 | -77.4% |
| Grenada | 3.34 | 1.60 | -1.73 | -52.0% |
| Guatemala | 13.55 | 2.21 | -11.35 | -83.7% |
| Guinea | 27.15 | 9.60 | -17.55 | -64.7% |
| Guinea-Bissau | 25.04 | 7.19 | -17.85 | -71.3% |
| Guyana | 6.92 | 2.66 | -4.27 | -61.6% |
| Haiti | 18.05 | 5.65 | -12.40 | -68.7% |
| Honduras | 8.62 | 1.60 | -7.02 | -81.4% |
| Hungary | 2.22 | 0.40 | -1.82 | -82.0% |
| Iceland | 0.87 | 0.26 | -0.60 | -69.8% |
| India | 15.91 | 2.91 | -13.00 | -81.7% |
| Indonesia | 11.33 | 2.13 | -9.20 | -81.2% |
| Iran | 9.30 | 1.20 | -8.10 | -87.1% |
| Iraq | 6.71 | 2.35 | -4.36 | -65.0% |
| Ireland | 1.24 | 0.31 | -0.92 | -74.7% |
| Israel | 1.66 | 0.34 | -1.32 | -79.5% |
| Italy | 1.43 | 0.26 | -1.17 | -81.7% |
| Jamaica | 3.53 | 1.88 | -1.65 | -46.8% |
| Japan | 0.88 | 0.23 | -0.65 | -74.2% |
| Jordan | 5.03 | 1.41 | -3.62 | -71.9% |
| Kazakhstan | 6.60 | 0.97 | -5.63 | -85.3% |
| Kenya | 10.24 | 4.11 | -6.13 | -59.9% |
| Kiribati | 11.52 | 5.64 | -5.88 | -51.0% |
| Kuwait | 2.99 | 0.86 | -2.13 | -71.2% |
| Kyrgyzstan | 9.26 | 1.73 | -7.54 | -81.4% |
| Laos | 19.38 | 4.04 | -15.34 | -79.2% |
| Latvia | 2.03 | 0.32 | -1.71 | -84.2% |
| Lebanon | 4.71 | 1.74 | -2.97 | -63.1% |
| Lesotho | 11.18 | 7.22 | -3.96 | -35.4% |
| Liberia | 23.87 | 7.32 | -16.55 | -69.3% |
| Libya | 6.38 | 1.03 | -5.34 | -83.8% |
| Lithuania | 1.92 | 0.35 | -1.57 | -81.6% |
| Luxembourg | 1.25 | 0.27 | -0.98 | -78.7% |
| Madagascar | 17.60 | 6.58 | -11.03 | -62.6% |
| Malawi | 24.52 | 4.01 | -20.51 | -83.6% |
| Malaysia | 2.64 | 0.78 | -1.86 | -70.3% |
| Maldives | 13.46 | 0.56 | -12.90 | -95.9% |
| Mali | 28.44 | 9.38 | -19.07 | -67.0% |
| Malta | 1.56 | 0.56 | -1.00 | -64.0% |
| Marshall Islands | 6.16 | 2.86 | -3.29 | -53.5% |
| Mauritania | 15.63 | 3.92 | -11.71 | -74.9% |
| Mauritius | 3.45 | 1.50 | -1.95 | -56.6% |
| Mexico | 6.54 | 1.28 | -5.26 | -80.4% |
| Micronesia (country) | 5.95 | 2.42 | -3.53 | -59.3% |
| Moldova | 4.65 | 1.42 | -3.24 | -69.6% |
| Mongolia | 15.09 | 1.34 | -13.75 | -91.1% |
| Montserrat | 3.00 | 0.66 | -2.34 | -77.9% |
| Morocco | 12.13 | 1.73 | -10.40 | -85.8% |
| Mozambique | 26.49 | 6.62 | -19.87 | -75.0% |
| Myanmar | 13.43 | 4.01 | -9.42 | -70.2% |
| Namibia | 9.77 | 3.79 | -5.98 | -61.2% |
| Nepal | 19.43 | 2.73 | -16.70 | -85.9% |
| Netherlands | 1.04 | 0.39 | -0.65 | -62.3% |
| New Zealand | 1.48 | 0.46 | -1.02 | -68.8% |
| Nicaragua | 9.58 | 1.52 | -8.06 | -84.1% |
| Niger | 32.46 | 11.73 | -20.73 | -63.8% |
| Nigeria | 20.79 | 10.72 | -10.07 | -48.5% |
| Niue | 2.61 | 2.48 | -0.13 | -4.8% |
| North Korea | 3.87 | 1.70 | -2.16 | -56.0% |
| North Macedonia | 5.50 | 0.46 | -5.03 | -91.6% |
| Norway | 0.99 | 0.22 | -0.77 | -78.1% |
| Oman | 9.09 | 1.05 | -8.04 | -88.4% |
| Pakistan | 16.05 | 6.10 | -9.96 | -62.0% |
| Palau | 4.28 | 2.23 | -2.04 | -47.8% |
| Palestine | 7.02 | 1.43 | -5.59 | -79.6% |
| Panama | 4.06 | 1.33 | -2.74 | -67.4% |
| Papua New Guinea | 10.02 | 4.14 | -5.88 | -58.7% |
| Paraguay | 6.11 | 1.74 | -4.37 | -71.5% |
| Peru | 11.98 | 1.51 | -10.47 | -87.4% |
| Philippines | 7.68 | 2.75 | -4.93 | -64.2% |
| Poland | 2.26 | 0.44 | -1.82 | -80.4% |
| Portugal | 2.42 | 0.32 | -2.11 | -87.0% |
| Qatar | 3.29 | 0.52 | -2.76 | -84.0% |
| Romania | 3.27 | 0.68 | -2.59 | -79.3% |
| Russia | 2.66 | 0.48 | -2.19 | -82.1% |
| Rwanda | 18.66 | 3.80 | -14.85 | -79.6% |
| Saint Kitts and Nevis | 4.50 | 1.54 | -2.96 | -65.7% |
| Saint Lucia | 2.81 | 1.73 | -1.08 | -38.4% |
| Saint Vincent and the Grenadines | 4.34 | 1.09 | -3.25 | -74.9% |
| Samoa | 3.99 | 1.61 | -2.38 | -59.7% |
| Sao Tome and Principe | 9.37 | 1.45 | -7.93 | -84.6% |
| Saudi Arabia | 8.11 | 0.64 | -7.47 | -92.1% |
| Senegal | 19.18 | 3.70 | -15.48 | -80.7% |
| Seychelles | 2.51 | 1.45 | -1.06 | -42.1% |
| Sierra Leone | 28.13 | 10.08 | -18.04 | -64.1% |
| Singapore | 1.32 | 0.22 | -1.10 | -83.7% |
| Slovakia | 2.08 | 0.59 | -1.50 | -71.8% |
| Slovenia | 1.69 | 0.23 | -1.46 | -86.3% |
| Solomon Islands | 4.83 | 1.83 | -3.00 | -62.2% |
| Somalia | 20.03 | 10.61 | -9.42 | -47.0% |
| South Africa | 8.60 | 3.45 | -5.15 | -59.8% |
| South Korea | 3.16 | 0.28 | -2.89 | -91.2% |
| South Sudan | 28.52 | 9.88 | -18.64 | -65.4% |
| Spain | 1.30 | 0.30 | -1.00 | -76.8% |
| Sri Lanka | 4.00 | 0.65 | -3.35 | -83.8% |
| Sudan | 14.48 | 5.16 | -9.33 | -64.4% |
| Suriname | 7.19 | 1.66 | -5.53 | -76.9% |
| Sweden | 0.80 | 0.25 | -0.55 | -68.9% |
| Switzerland | 0.97 | 0.40 | -0.56 | -58.4% |
| Syria | 7.03 | 2.14 | -4.89 | -69.5% |
| Tajikistan | 12.78 | 3.03 | -9.75 | -76.3% |
| Tanzania | 17.78 | 4.05 | -13.73 | -77.2% |
| Thailand | 5.56 | 0.81 | -4.75 | -85.4% |
| Togo | 17.08 | 6.04 | -11.04 | -64.6% |
| Tonga | 2.78 | 1.09 | -1.69 | -60.7% |
| Trinidad and Tobago | 3.69 | 1.54 | -2.15 | -58.2% |
| Tunisia | 8.42 | 1.15 | -7.27 | -86.4% |
| Turkey | 11.55 | 0.96 | -10.59 | -91.7% |
| Turkmenistan | 10.91 | 4.04 | -6.87 | -63.0% |
| Turks and Caicos Islands | 3.10 | 0.59 | -2.51 | -80.9% |
| Tuvalu | 6.05 | 2.04 | -4.01 | -66.3% |
| Uganda | 21.31 | 4.05 | -17.26 | -81.0% |
| Ukraine | 2.49 | 0.85 | -1.64 | -65.8% |
| United Arab Emirates | 2.78 | 0.53 | -2.25 | -80.9% |
| United Kingdom | 1.27 | 0.41 | -0.86 | -67.8% |
| United States | 1.39 | 0.63 | -0.76 | -54.9% |
| Uruguay | 3.31 | 0.66 | -2.64 | -80.0% |
| Uzbekistan | 10.17 | 1.33 | -8.84 | -86.9% |
| Vanuatu | 5.93 | 1.82 | -4.11 | -69.3% |
| Venezuela | 4.08 | 2.42 | -1.66 | -40.6% |
| Vietnam | 6.64 | 2.03 | -4.61 | -69.4% |
| Yemen | 18.38 | 4.13 | -14.25 | -77.5% |
| Zambia | 15.86 | 5.56 | -10.31 | -65.0% |
| Zimbabwe | 10.09 | 4.77 | -5.32 | -52.7% |
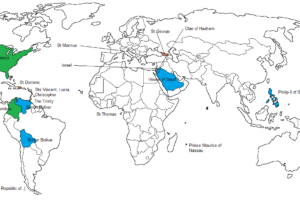
Literacy Rate 1982 vs 2022

Now, unfortunately Our World In Data seems to be missing several countries (especially many European ones), but the maps above do give us a good sense how literacy rate is going.
Here’s how a few of the biggest countries did:
- China: 65.5% in 1982 to 97.2% in 2022
- India: 40.8% in 1981 to 76.3% in 2022
- Indonesia: 67.3% in 1980 to 96% in 2022
- Pakistan: 25.7% in 1981 to 58% in 2022
- Nigeria: 55.5% in 1991 to 62% in 2022
- Bangladesh: 29.2% in 1981 to 75% in 2022
So improvements in all of the world’s largest developing countries.
Extreme Poverty Rate 1982 vs 2023

Extreme poverty is defined as living below the International Poverty Line of $2.15 per day. This data is adjusted for inflation and for
differences in the cost of living between countries.
Again the data for this is a little difficult to use. But here’s what happened din the world’s largest countries:
- China: 91.8% in 1981 to 0%! in 2021
- India: 56.7% in 1983 to 12.9% in 2021
- Indonesia: 74.3% in 1984 to 1.8% in 2023
- Pakistan: 67.3% in 1987 to 4.9% in 2018
- Nigeria: 47.8% in 1985 to 30.9% in 2018
- Bangladesh: 37.3% in 1983 to 5% in 2022
Again big drops across the board, especially China which went from over 90% to basically no one in a generation!
Human Rights 1982 vs 2023

Based on the expert estimates and index by V-Dem. It captures the extent to which people are free from government torture, political killings, and forced labor; they have property rights; and enjoy the freedoms of movement, religion, expression, and association. The variable ranges from 0 to 1 (most rights).
This one is not a universal improvement. 35 countries saw human right get worse while 145 saw improvements. Unfortunately, both China and India are seen as having worse human rights records today than in 1982.
The most notable improvements were the former Soviet Republics and Eastern Block States and the end of apartheid in South Africa.
The data:
| Country | Civil liberties index 1982 | Civil liberties index 2023 | Change In Index |
|---|---|---|---|
| Afghanistan | 0.080 | 0.053 | -0.03 |
| Africa | 0.349 | 0.592 | 0.24 |
| Albania | 0.017 | 0.881 | 0.86 |
| Algeria | 0.377 | 0.428 | 0.05 |
| Angola | 0.084 | 0.616 | 0.53 |
| Argentina | 0.248 | 0.897 | 0.65 |
| Armenia | 0.151 | 0.838 | 0.69 |
| Asia | 0.346 | 0.495 | 0.15 |
| Australia | 0.950 | 0.917 | -0.03 |
| Austria | 0.944 | 0.928 | -0.02 |
| Azerbaijan | 0.151 | 0.356 | 0.21 |
| Bahrain | 0.322 | 0.282 | -0.04 |
| Bangladesh | 0.530 | 0.423 | -0.11 |
| Barbados | 0.904 | 0.922 | 0.02 |
| Belarus | 0.151 | 0.213 | 0.06 |
| Belgium | 0.954 | 0.957 | 0.00 |
| Benin | 0.273 | 0.830 | 0.56 |
| Bhutan | 0.505 | 0.721 | 0.22 |
| Bolivia | 0.493 | 0.795 | 0.30 |
| Bosnia and Herzegovina | 0.447 | 0.813 | 0.37 |
| Botswana | 0.870 | 0.830 | -0.04 |
| Brazil | 0.384 | 0.841 | 0.46 |
| Bulgaria | 0.190 | 0.896 | 0.71 |
| Burkina Faso | 0.458 | 0.671 | 0.21 |
| Burundi | 0.283 | 0.251 | -0.03 |
| Cambodia | 0.070 | 0.287 | 0.22 |
| Cameroon | 0.389 | 0.565 | 0.18 |
| Canada | 0.931 | 0.907 | -0.02 |
| Cape Verde | 0.694 | 0.923 | 0.23 |
| Central African Republic | 0.410 | 0.423 | 0.01 |
| Chad | 0.185 | 0.297 | 0.11 |
| Chile | 0.150 | 0.929 | 0.78 |
| China | 0.257 | 0.172 | -0.09 |
| Colombia | 0.422 | 0.798 | 0.38 |
| Comoros | 0.318 | 0.491 | 0.17 |
| Congo | 0.132 | 0.284 | 0.15 |
| Costa Rica | 0.919 | 0.934 | 0.02 |
| Cote d'Ivoire | 0.494 | 0.735 | 0.24 |
| Croatia | 0.447 | 0.900 | 0.45 |
| Cuba | 0.224 | 0.295 | 0.07 |
| Cyprus | 0.807 | 0.895 | 0.09 |
| Czechia | 0.241 | 0.953 | 0.71 |
| Democratic Republic of Congo | 0.125 | 0.412 | 0.29 |
| Denmark | 0.969 | 0.960 | -0.01 |
| Djibouti | 0.349 | 0.413 | 0.06 |
| Dominican Republic | 0.813 | 0.890 | 0.08 |
| East Timor | 0.051 | 0.857 | 0.81 |
| Ecuador | 0.809 | 0.828 | 0.02 |
| Egypt | 0.334 | 0.249 | -0.09 |
| El Salvador | 0.107 | 0.511 | 0.40 |
| Equatorial Guinea | 0.230 | 0.252 | 0.02 |
| Eritrea | 0.050 | 0.056 | 0.01 |
| Estonia | 0.151 | 0.962 | 0.81 |
| Eswatini | 0.311 | 0.177 | -0.13 |
| Ethiopia | 0.058 | 0.378 | 0.32 |
| Europe | 0.714 | 0.869 | 0.15 |
| Fiji | 0.822 | 0.758 | -0.06 |
| Finland | 0.951 | 0.957 | 0.01 |
| France | 0.952 | 0.917 | -0.03 |
| Gabon | 0.419 | 0.794 | 0.38 |
| Gambia | 0.753 | 0.882 | 0.13 |
| Georgia | 0.151 | 0.869 | 0.72 |
| Ghana | 0.377 | 0.904 | 0.53 |
| Greece | 0.934 | 0.881 | -0.05 |
| Guatemala | 0.052 | 0.702 | 0.65 |
| Guinea | 0.145 | 0.324 | 0.18 |
| Guinea-Bissau | 0.233 | 0.740 | 0.51 |
| Guyana | 0.566 | 0.855 | 0.29 |
| Haiti | 0.124 | 0.629 | 0.51 |
| Honduras | 0.430 | 0.819 | 0.39 |
| Hong Kong | 0.881 | 0.616 | -0.27 |
| Hungary | 0.337 | 0.822 | 0.49 |
| Iceland | 0.950 | 0.953 | 0.00 |
| India | 0.695 | 0.556 | -0.14 |
| Indonesia | 0.236 | 0.735 | 0.50 |
| Iran | 0.114 | 0.221 | 0.11 |
| Iraq | 0.113 | 0.492 | 0.38 |
| Ireland | 0.927 | 0.958 | 0.03 |
| Israel | 0.814 | 0.814 | 0.00 |
| Italy | 0.928 | 0.920 | -0.01 |
| Jamaica | 0.841 | 0.876 | 0.04 |
| Japan | 0.941 | 0.931 | -0.01 |
| Jordan | 0.532 | 0.671 | 0.14 |
| Kazakhstan | 0.151 | 0.534 | 0.38 |
| Kenya | 0.248 | 0.776 | 0.53 |
| Kuwait | 0.564 | 0.587 | 0.02 |
| Kyrgyzstan | 0.151 | 0.559 | 0.41 |
| Laos | 0.060 | 0.151 | 0.09 |
| Latvia | 0.151 | 0.924 | 0.77 |
| Lebanon | 0.563 | 0.679 | 0.12 |
| Lesotho | 0.377 | 0.779 | 0.40 |
| Liberia | 0.245 | 0.853 | 0.61 |
| Libya | 0.108 | 0.322 | 0.21 |
| Lithuania | 0.151 | 0.912 | 0.76 |
| Luxembourg | 0.948 | 0.947 | 0.00 |
| Madagascar | 0.414 | 0.740 | 0.33 |
| Malawi | 0.092 | 0.782 | 0.69 |
| Malaysia | 0.568 | 0.753 | 0.19 |
| Maldives | 0.371 | 0.737 | 0.37 |
| Mali | 0.398 | 0.716 | 0.32 |
| Malta | 0.875 | 0.907 | 0.03 |
| Mauritania | 0.283 | 0.616 | 0.33 |
| Mauritius | 0.873 | 0.725 | -0.15 |
| Mexico | 0.582 | 0.677 | 0.10 |
| Moldova | 0.151 | 0.901 | 0.75 |
| Mongolia | 0.159 | 0.818 | 0.66 |
| Morocco | 0.343 | 0.629 | 0.29 |
| Mozambique | 0.103 | 0.596 | 0.49 |
| Myanmar | 0.105 | 0.113 | 0.01 |
| Namibia | 0.217 | 0.855 | 0.64 |
| Nepal | 0.249 | 0.775 | 0.53 |
| Netherlands | 0.950 | 0.921 | -0.03 |
| New Zealand | 0.958 | 0.962 | 0.00 |
| Nicaragua | 0.445 | 0.130 | -0.32 |
| Niger | 0.298 | 0.785 | 0.49 |
| Nigeria | 0.655 | 0.652 | 0.00 |
| North America | 0.567 | 0.732 | 0.17 |
| North Korea | 0.015 | 0.018 | 0.00 |
| North Macedonia | 0.447 | 0.807 | 0.36 |
| Norway | 0.961 | 0.933 | -0.03 |
| Oceania | 0.872 | 0.861 | -0.01 |
| Oman | 0.378 | 0.448 | 0.07 |
| Pakistan | 0.223 | 0.437 | 0.21 |
| Palestine/West Bank | 0.189 | 0.546 | 0.36 |
| Panama | 0.324 | 0.883 | 0.56 |
| Papua New Guinea | 0.824 | 0.802 | -0.02 |
| Paraguay | 0.174 | 0.792 | 0.62 |
| Peru | 0.649 | 0.848 | 0.20 |
| Philippines | 0.210 | 0.556 | 0.35 |
| Poland | 0.302 | 0.835 | 0.53 |
| Portugal | 0.965 | 0.923 | -0.04 |
| Qatar | 0.341 | 0.361 | 0.02 |
| Romania | 0.164 | 0.878 | 0.71 |
| Russia | 0.151 | 0.296 | 0.15 |
| Rwanda | 0.292 | 0.190 | -0.10 |
| Sao Tome and Principe | 0.561 | 0.902 | 0.34 |
| Saudi Arabia | 0.164 | 0.165 | 0.00 |
| Senegal | 0.742 | 0.829 | 0.09 |
| Serbia | 0.447 | 0.787 | 0.34 |
| Seychelles | 0.579 | 0.888 | 0.31 |
| Sierra Leone | 0.305 | 0.811 | 0.51 |
| Singapore | 0.691 | 0.719 | 0.03 |
| Slovakia | 0.241 | 0.916 | 0.68 |
| Slovenia | 0.447 | 0.903 | 0.46 |
| Solomon Islands | 0.817 | 0.850 | 0.03 |
| Somalia | 0.066 | 0.442 | 0.38 |
| South Africa | 0.123 | 0.832 | 0.71 |
| South America | 0.468 | 0.813 | 0.35 |
| South Korea | 0.447 | 0.884 | 0.44 |
| South Sudan | 0.248 | 0.207 | -0.04 |
| Spain | 0.877 | 0.946 | 0.07 |
| Sri Lanka | 0.639 | 0.726 | 0.09 |
| Sudan | 0.248 | 0.238 | -0.01 |
| Suriname | 0.527 | 0.895 | 0.37 |
| Sweden | 0.973 | 0.961 | -0.01 |
| Switzerland | 0.933 | 0.955 | 0.02 |
| Syria | 0.095 | 0.133 | 0.04 |
| Taiwan | 0.403 | 0.936 | 0.53 |
| Tajikistan | 0.151 | 0.183 | 0.03 |
| Tanzania | 0.607 | 0.816 | 0.21 |
| Thailand | 0.567 | 0.438 | -0.13 |
| Togo | 0.305 | 0.630 | 0.33 |
| Trinidad and Tobago | 0.872 | 0.884 | 0.01 |
| Tunisia | 0.466 | 0.725 | 0.26 |
| Turkey | 0.248 | 0.382 | 0.13 |
| Turkmenistan | 0.151 | 0.108 | -0.04 |
| Uganda | 0.272 | 0.420 | 0.15 |
| Ukraine | 0.151 | 0.625 | 0.47 |
| United Arab Emirates | 0.326 | 0.348 | 0.02 |
| United Kingdom | 0.841 | 0.895 | 0.05 |
| United States | 0.940 | 0.928 | -0.01 |
| Uruguay | 0.321 | 0.936 | 0.62 |
| Uzbekistan | 0.151 | 0.374 | 0.22 |
| Vanuatu | 0.860 | 0.876 | 0.02 |
| Venezuela | 0.873 | 0.346 | -0.53 |
| Vietnam | 0.246 | 0.373 | 0.13 |
| World | 0.466 | 0.665 | 0.20 |
| Zambia | 0.370 | 0.823 | 0.45 |
| Zanzibar | 0.449 | 0.657 | 0.21 |
| Zimbabwe | 0.464 | 0.394 | -0.07 |
CO2 Emissions Per Capita 1982 vs 2022
Carbon dioxide (CO₂) emissions from fossil fuels and industry. Land-use change is not included. Measured in Tons of CO2

Again this one is not a universal improvement. However, one notable exception is Europe which has reduced emissions per capita by 35% since 1982 and grown their economy.
Similarly the US has reduced it’s emissions per capita by 23% during the same period.
This suggests, that economic growth and CO2 growth are now no longer linked and there’s every reason to believe global CO2 emissions per capita could start falling in the near future (as of now they are just 13.8% higher than they were in 1982, despite China’s massive economic growth).
The Data:
| Country | Annual CO2 emissions (per capita) in 1982 | Annual CO2 emissions (per capita) in 2022 | Absolute Change | Relative Change |
|---|---|---|---|---|
| Afghanistan | 0.208 | 0.295 | 0.088 | 42.3% |
| Africa | 1.122 | 0.994 | -0.127 | -11.4% |
| Albania | 2.403 | 1.743 | -0.660 | -27.5% |
| Algeria | 1.959 | 3.927 | 1.969 | 100.5% |
| Angola | 0.518 | 0.452 | -0.067 | -12.8% |
| Antigua and Barbuda | 4.493 | 6.422 | 1.929 | 42.9% |
| Argentina | 3.573 | 4.238 | 0.664 | 18.6% |
| Armenia | 2.414 | 2.305 | -0.110 | -4.5% |
| Aruba | 9.876 | 8.133 | -1.742 | -17.6% |
| Asia | 1.648 | 4.611 | 2.964 | 179.9% |
| Asia (excl. China and India) | 2.587 | 4.017 | 1.431 | 55.3% |
| Australia | 14.372 | 14.985 | 0.613 | 4.3% |
| Austria | 7.075 | 6.878 | -0.197 | -2.8% |
| Azerbaijan | 7.022 | 3.675 | -3.348 | -47.7% |
| Bahamas | 9.727 | 5.171 | -4.556 | -46.8% |
| Bahrain | 25.140 | 25.672 | 0.532 | 2.1% |
| Bangladesh | 0.097 | 0.596 | 0.500 | 517.6% |
| Barbados | 2.522 | 4.377 | 1.855 | 73.5% |
| Belarus | 9.774 | 6.167 | -3.607 | -36.9% |
| Belgium | 11.880 | 7.688 | -4.192 | -35.3% |
| Belize | 1.130 | 1.789 | 0.660 | 58.4% |
| Benin | 0.109 | 0.631 | 0.522 | 478.5% |
| Bermuda | 7.279 | 6.937 | -0.342 | -4.7% |
| Bhutan | 0.142 | 1.349 | 1.207 | 851.7% |
| Bolivia | 0.724 | 1.758 | 1.034 | 142.8% |
| Bonaire Sint Eustatius and Saba | 10.638 | 4.083 | -6.555 | -61.6% |
| Bosnia and Herzegovina | 3.868 | 6.103 | 2.236 | 57.8% |
| Botswana | 1.074 | 2.839 | 1.764 | 164.2% |
| Brazil | 1.339 | 2.245 | 0.906 | 67.7% |
| British Virgin Islands | 3.076 | 5.004 | 1.928 | 62.7% |
| Brunei | 13.281 | 23.950 | 10.669 | 80.3% |
| Bulgaria | 10.016 | 6.804 | -3.211 | -32.1% |
| Burkina Faso | 0.079 | 0.263 | 0.184 | 234.7% |
| Burundi | 0.034 | 0.062 | 0.028 | 80.9% |
| Cambodia | 0.051 | 1.190 | 1.139 | 2237.1% |
| Cameroon | 0.698 | 0.343 | -0.355 | -50.9% |
| Canada | 16.511 | 14.249 | -2.262 | -13.7% |
| Cape Verde | 0.112 | 0.959 | 0.847 | 754.0% |
| Central African Republic | 0.058 | 0.041 | -0.017 | -30.0% |
| Chad | 0.044 | 0.134 | 0.089 | 201.2% |
| Chile | 1.734 | 4.304 | 2.570 | 148.2% |
| China | 1.585 | 7.993 | 6.408 | 404.2% |
| Colombia | 1.667 | 1.922 | 0.255 | 15.3% |
| Comoros | 0.137 | 0.493 | 0.356 | 259.4% |
| Congo | 0.703 | 1.245 | 0.542 | 77.2% |
| Cook Islands | 2.944 | 3.995 | 1.051 | 35.7% |
| Costa Rica | 0.812 | 1.523 | 0.711 | 87.6% |
| Cote d'Ivoire | 0.621 | 0.417 | -0.204 | -32.9% |
| Croatia | 3.769 | 4.349 | 0.579 | 15.4% |
| Cuba | 3.484 | 1.866 | -1.619 | -46.5% |
| Curacao | 59.746 | 9.189 | -50.557 | -84.6% |
| Cyprus | 4.535 | 5.617 | 1.082 | 23.9% |
| Czechia | 17.569 | 9.336 | -8.233 | -46.9% |
| Democratic Republic of Congo | 0.108 | 0.036 | -0.072 | -66.3% |
| Denmark | 10.459 | 4.940 | -5.519 | -52.8% |
| Djibouti | 0.980 | 0.404 | -0.576 | -58.8% |
| Dominica | 0.555 | 2.106 | 1.551 | 279.6% |
| Dominican Republic | 1.048 | 2.105 | 1.057 | 100.9% |
| Ecuador | 2.244 | 2.312 | 0.068 | 3.0% |
| Egypt | 1.224 | 2.333 | 1.109 | 90.6% |
| El Salvador | 0.381 | 1.217 | 0.837 | 219.6% |
| Equatorial Guinea | 0.232 | 3.031 | 2.799 | 1205.9% |
| Estonia | 23.602 | 7.776 | -15.825 | -67.1% |
| Eswatini | 0.687 | 1.053 | 0.365 | 53.2% |
| Ethiopia | 0.040 | 0.155 | 0.115 | 290.3% |
| Europe | 10.588 | 6.858 | -3.730 | -35.2% |
| Europe (excl. EU-27) | 12.495 | 7.887 | -4.608 | -36.9% |
| Europe (excl. EU-28) | 13.165 | 8.818 | -4.347 | -33.0% |
| European Union (27) | 9.229 | 6.174 | -3.055 | -33.1% |
| European Union (28) | 9.288 | 5.984 | -3.304 | -35.6% |
| Faroe Islands | 10.364 | 14.085 | 3.721 | 35.9% |
| Fiji | 1.234 | 1.155 | -0.079 | -6.4% |
| Finland | 8.904 | 6.527 | -2.377 | -26.7% |
| France | 8.107 | 4.604 | -3.503 | -43.2% |
| French Polynesia | 1.933 | 2.851 | 0.918 | 47.5% |
| Gabon | 8.287 | 2.388 | -5.899 | -71.2% |
| Gambia | 0.210 | 0.285 | 0.075 | 35.7% |
| Georgia | 2.739 | 2.963 | 0.223 | 8.1% |
| Germany | 13.088 | 7.984 | -5.104 | -39.0% |
| Ghana | 0.235 | 0.622 | 0.387 | 164.9% |
| Greece | 5.406 | 5.745 | 0.340 | 6.3% |
| Greenland | 10.058 | 10.474 | 0.416 | 4.1% |
| Grenada | 0.645 | 2.713 | 2.068 | 320.6% |
| Guatemala | 0.492 | 1.076 | 0.584 | 118.7% |
| Guinea | 0.190 | 0.357 | 0.168 | 88.2% |
| Guinea-Bissau | 0.166 | 0.155 | -0.011 | -6.8% |
| Guyana | 1.800 | 4.374 | 2.574 | 143.0% |
| Haiti | 0.139 | 0.211 | 0.072 | 51.9% |
| High-income countries | 11.306 | 10.133 | -1.174 | -10.4% |
| Honduras | 0.436 | 1.070 | 0.634 | 145.5% |
| Hong Kong | 3.798 | 4.082 | 0.284 | 7.5% |
| Hungary | 8.127 | 4.450 | -3.677 | -45.2% |
| Iceland | 6.811 | 9.500 | 2.689 | 39.5% |
| India | 0.446 | 1.997 | 1.550 | 347.5% |
| Indonesia | 0.680 | 2.646 | 1.965 | 289.0% |
| Iran | 3.242 | 7.799 | 4.558 | 140.6% |
| Iraq | 2.099 | 4.025 | 1.925 | 91.7% |
| Ireland | 7.408 | 7.721 | 0.313 | 4.2% |
| Israel | 6.128 | 6.209 | 0.081 | 1.3% |
| Italy | 6.484 | 5.727 | -0.757 | -11.7% |
| Jamaica | 2.825 | 2.295 | -0.531 | -18.8% |
| Japan | 7.535 | 8.502 | 0.967 | 12.8% |
| Jordan | 2.600 | 2.030 | -0.569 | -21.9% |
| Kazakhstan | 15.711 | 13.980 | -1.731 | -11.0% |
| Kenya | 0.269 | 0.460 | 0.191 | 70.9% |
| Kiribati | 0.407 | 0.518 | 0.111 | 27.3% |
| Kuwait | 12.759 | 25.578 | 12.819 | 100.5% |
| Kyrgyzstan | 5.196 | 1.425 | -3.771 | -72.6% |
| Laos | 0.046 | 3.080 | 3.035 | 6652.4% |
| Latvia | 8.905 | 3.562 | -5.344 | -60.0% |
| Lebanon | 1.863 | 4.354 | 2.491 | 133.7% |
| Liberia | 0.292 | 0.165 | -0.126 | -43.3% |
| Libya | 9.360 | 9.242 | -0.118 | -1.3% |
| Liechtenstein | 4.037 | 3.810 | -0.227 | -5.6% |
| Lithuania | 10.191 | 4.606 | -5.584 | -54.8% |
| Low-income countries | 0.716 | 0.280 | -0.436 | -60.9% |
| Lower-middle-income countries | 1.072 | 1.778 | 0.706 | 65.9% |
| Luxembourg | 24.448 | 11.618 | -12.830 | -52.5% |
| Macao | 1.884 | 1.513 | -0.371 | -19.7% |
| Madagascar | 0.107 | 0.149 | 0.042 | 39.0% |
| Malawi | 0.087 | 0.103 | 0.015 | 17.4% |
| Malaysia | 2.201 | 8.577 | 6.375 | 289.6% |
| Maldives | 0.273 | 3.248 | 2.975 | 1090.0% |
| Mali | 0.047 | 0.312 | 0.264 | 556.7% |
| Malta | 3.862 | 3.104 | -0.758 | -19.6% |
| Mauritania | 0.552 | 0.957 | 0.405 | 73.3% |
| Mauritius | 0.510 | 3.270 | 2.760 | 541.1% |
| Mexico | 4.301 | 4.015 | -0.286 | -6.6% |
| Moldova | 8.714 | 1.657 | -7.057 | -81.0% |
| Mongolia | 3.767 | 11.151 | 7.384 | 196.0% |
| Montenegro | 2.734 | 3.656 | 0.921 | 33.7% |
| Montserrat | 1.618 | 4.845 | 3.227 | 199.4% |
| Morocco | 0.815 | 1.826 | 1.012 | 124.1% |
| Mozambique | 0.212 | 0.243 | 0.031 | 14.5% |
| Myanmar | 0.161 | 0.645 | 0.484 | 301.4% |
| Nauru | 16.191 | 4.170 | -12.021 | -74.2% |
| Nepal | 0.027 | 0.507 | 0.480 | 1775.1% |
| Netherlands | 9.337 | 7.137 | -2.200 | -23.6% |
| New Caledonia | 8.302 | 17.641 | 9.339 | 112.5% |
| New Zealand | 5.735 | 6.212 | 0.477 | 8.3% |
| Nicaragua | 0.604 | 0.799 | 0.194 | 32.2% |
| Niger | 0.113 | 0.117 | 0.004 | 3.2% |
| Nigeria | 0.845 | 0.589 | -0.256 | -30.3% |
| Niue | 1.072 | 3.873 | 2.801 | 261.4% |
| North America | 14.051 | 10.535 | -3.517 | -25.0% |
| North America (excl. USA) | 5.563 | 4.741 | -0.822 | -14.8% |
| North Korea | 6.318 | 1.951 | -4.366 | -69.1% |
| North Macedonia | 4.632 | 3.625 | -1.007 | -21.7% |
| Norway | 7.512 | 7.509 | -0.003 | 0.0% |
| Oceania | 10.281 | 9.852 | -0.429 | -4.2% |
| Oman | 5.034 | 15.730 | 10.696 | 212.5% |
| Pakistan | 0.423 | 0.849 | 0.425 | 100.5% |
| Palau | 12.416 | 12.124 | -0.293 | -2.4% |
| Panama | 1.599 | 2.699 | 1.100 | 68.8% |
| Papua New Guinea | 0.601 | 0.771 | 0.170 | 28.3% |
| Paraguay | 0.419 | 1.330 | 0.911 | 217.4% |
| Peru | 1.284 | 1.789 | 0.505 | 39.3% |
| Philippines | 0.684 | 1.301 | 0.618 | 90.3% |
| Poland | 11.633 | 8.107 | -3.526 | -30.3% |
| Portugal | 2.928 | 4.051 | 1.123 | 38.3% |
| Qatar | 39.456 | 37.601 | -1.855 | -4.7% |
| Romania | 8.727 | 3.740 | -4.987 | -57.1% |
| Russia | 15.216 | 11.417 | -3.799 | -25.0% |
| Rwanda | 0.108 | 0.112 | 0.005 | 4.4% |
| Saint Helena | 0.560 | 3.299 | 2.738 | 488.8% |
| Saint Kitts and Nevis | 1.540 | 4.708 | 3.168 | 205.6% |
| Saint Lucia | 0.900 | 2.615 | 1.715 | 190.6% |
| Saint Pierre and Miquelon | 6.603 | 10.293 | 3.690 | 55.9% |
| Saint Vincent and the Grenadines | 0.370 | 2.296 | 1.927 | 521.0% |
| Samoa | 0.395 | 1.122 | 0.727 | 183.9% |
| Sao Tome and Principe | 0.472 | 0.582 | 0.110 | 23.3% |
| Saudi Arabia | 14.096 | 18.197 | 4.101 | 29.1% |
| Senegal | 0.505 | 0.674 | 0.168 | 33.3% |
| Serbia | 6.114 | 6.025 | -0.089 | -1.5% |
| Seychelles | 1.268 | 6.150 | 4.881 | 384.9% |
| Sierra Leone | 0.158 | 0.131 | -0.026 | -16.8% |
| Singapore | 11.320 | 8.912 | -2.408 | -21.3% |
| Sint Maarten (Dutch part) | 71.949 | 14.352 | -57.597 | -80.1% |
| Slovakia | 11.469 | 6.052 | -5.417 | -47.2% |
| Slovenia | 7.015 | 5.998 | -1.017 | -14.5% |
| Solomon Islands | 0.483 | 0.412 | -0.071 | -14.7% |
| Somalia | 0.121 | 0.037 | -0.084 | -69.5% |
| South Africa | 9.040 | 6.746 | -2.294 | -25.4% |
| South America | 1.943 | 2.487 | 0.543 | 28.0% |
| South Korea | 3.573 | 11.599 | 8.026 | 224.6% |
| South Sudan | 0.072 | 0.168 | 0.096 | 132.0% |
| Spain | 5.492 | 5.164 | -0.328 | -6.0% |
| Sri Lanka | 0.289 | 0.794 | 0.504 | 174.3% |
| Sudan | 0.193 | 0.470 | 0.277 | 143.3% |
| Suriname | 4.958 | 5.803 | 0.845 | 17.0% |
| Sweden | 7.464 | 3.607 | -3.857 | -51.7% |
| Switzerland | 5.725 | 4.048 | -1.677 | -29.3% |
| Syria | 2.562 | 1.249 | -1.313 | -51.2% |
| Taiwan | 4.033 | 11.631 | 7.598 | 188.4% |
| Tajikistan | 2.667 | 1.006 | -1.660 | -62.3% |
| Tanzania | 0.105 | 0.238 | 0.133 | 126.8% |
| Thailand | 0.782 | 3.776 | 2.994 | 382.8% |
| Togo | 0.271 | 0.291 | 0.021 | 7.6% |
| Tonga | 0.454 | 1.769 | 1.315 | 290.0% |
| Trinidad and Tobago | 15.906 | 22.424 | 6.518 | 41.0% |
| Tunisia | 1.378 | 2.879 | 1.501 | 108.9% |
| Turkey | 1.876 | 5.105 | 3.229 | 172.1% |
| Turkmenistan | 9.698 | 11.034 | 1.336 | 13.8% |
| Uganda | 0.039 | 0.127 | 0.088 | 224.8% |
| Ukraine | 13.386 | 3.558 | -9.829 | -73.4% |
| United Arab Emirates | 31.470 | 25.833 | -5.637 | -17.9% |
| United Kingdom | 9.712 | 4.720 | -4.992 | -51.4% |
| United States | 19.506 | 14.950 | -4.556 | -23.4% |
| Upper-middle-income countries | 3.081 | 6.227 | 3.146 | 102.1% |
| Uruguay | 1.629 | 2.306 | 0.677 | 41.5% |
| Uzbekistan | 5.370 | 3.483 | -1.887 | -35.1% |
| Vanuatu | 0.414 | 0.636 | 0.222 | 53.5% |
| Venezuela | 5.799 | 2.717 | -3.082 | -53.2% |
| Vietnam | 0.330 | 3.500 | 3.170 | 961.4% |
| World | 4.094 | 4.658 | 0.564 | 13.8% |
| Yemen | 0.601 | 0.337 | -0.264 | -43.9% |
| Zambia | 0.576 | 0.446 | -0.131 | -22.7% |
| Zimbabwe | 1.125 | 0.543 | -0.582 | -51.8% |
What do you think? Is the world really worse or in many ways is it getting better?

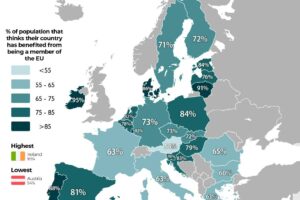
![How Willing Are [X Country] Citizens In Helping Other European Countries In A Crisis?](https://brilliantmaps.com/wp-content/uploads/help-in-crisis-europe-300x200.png)


Leave a Reply