The maps below all come this CIA album on Flicker. They describe the maps in the following ways:
The Cartography Section of General William Donovan’s Office of Strategic Services (OSS) produced some 8,000 hand-drawn maps and 64 plaster topographic 3-D models in support of the war effort. Many of their products played crucial roles in the planning and execution of major military operations in the European, North African, and Asian Theaters.
And here are the 22 maps:
1942 German Dialects Map
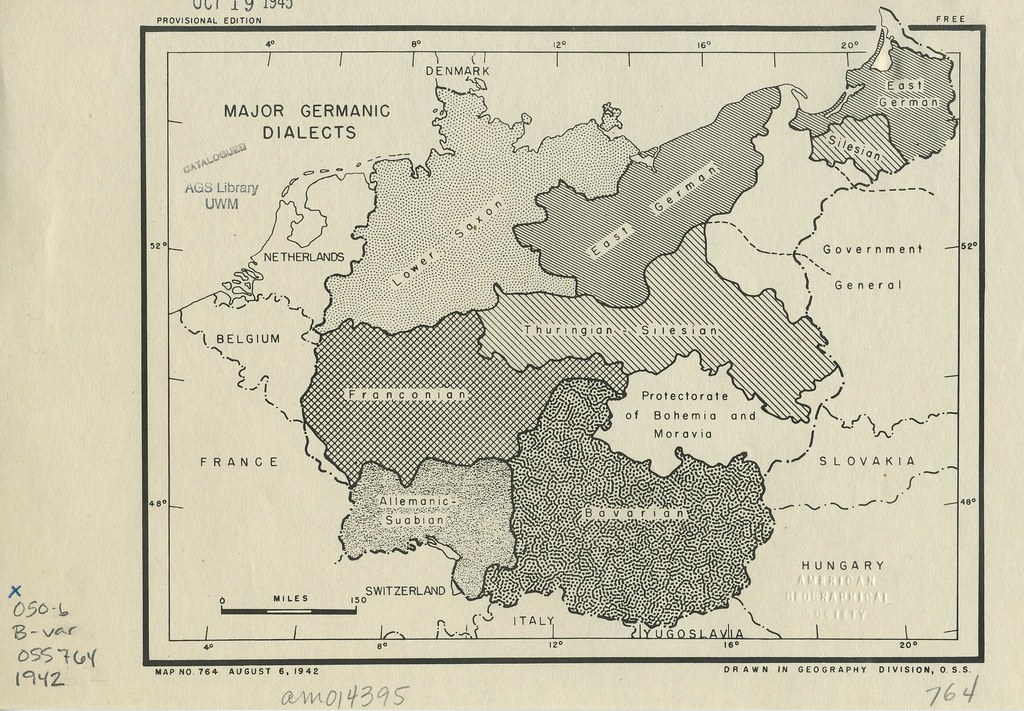
This 1942 Office of Strategic Services map titled “Major Germanic Dialects” shows the main regional dialect groups spoken across Germany and neighboring German-speaking areas during World War II.
The OSS created maps like this to help American intelligence officers understand the cultural and linguistic geography of German-speaking Europe, since dialects often reflected regional identity, local loyalties, and historical political divisions.
The map divides Germany into major dialect regions such as:
- Low Saxon in the north
- East German and Thuringian-Silesian in the east
- Franconian in central Germany
- Alemannic-Swabian in the southwest
- Bavarian in the south
These dialect groups developed over centuries because Germany was historically fragmented into many kingdoms, duchies, and principalities rather than being a unified nation-state.
Mountain ranges, rivers, and political borders helped preserve local speech patterns, and many dialects could differ so much that speakers from distant regions sometimes struggled to understand one another.
After the war, German dialect geography changed dramatically.
Germany lost large eastern territories such as Silesia and East Prussia, and millions of ethnic Germans fled or were expelled westward.
As a result, dialects like East German and Silesian nearly disappeared from their historic homelands. Population mixing in postwar West Germany also weakened many local dialects.
The spread of radio, television, public education, and standardized “High German” (Hochdeutsch) after 1945 further reduced dialect differences.
Younger Germans increasingly spoke standardized German in schools and workplaces, while dialects became more associated with family life, local identity, or older generations.
Even so, strong regional dialect traditions still survive today, especially in Bavaria, Swabia, Austria, and parts of Switzerland. Modern Germany is therefore more linguistically unified than in 1942, but dialect remains an important part of regional culture and identity.
Also see: German Language Areas of Europe 1910 vs 2010
1942 Pacific Ocean Map
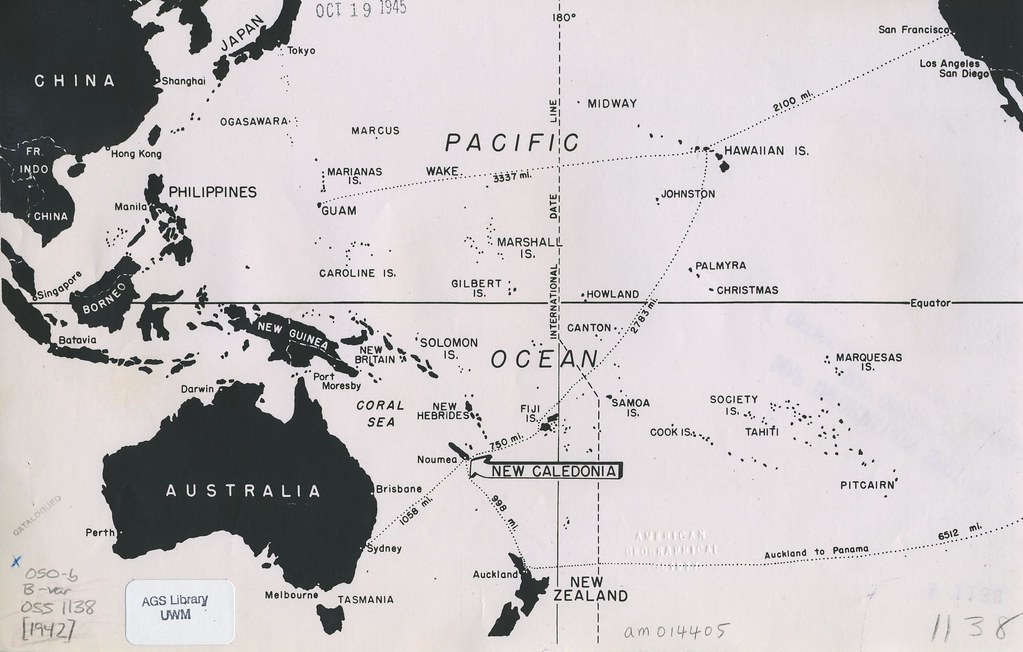
In 1942, New Caledonia became strategically vital to the United States because it served as a major Allied military base during the Pacific campaign of World War II.
American forces used the island to protect supply routes between the United States and Australia and to launch operations against Japanese advances in the South Pacific.
Its large nickel reserves and secure location also made it an important resource and logistics center for the Allied war effort.
Also see: Map Of New Caledonia Created By The CIA
1942 Russian Front Map
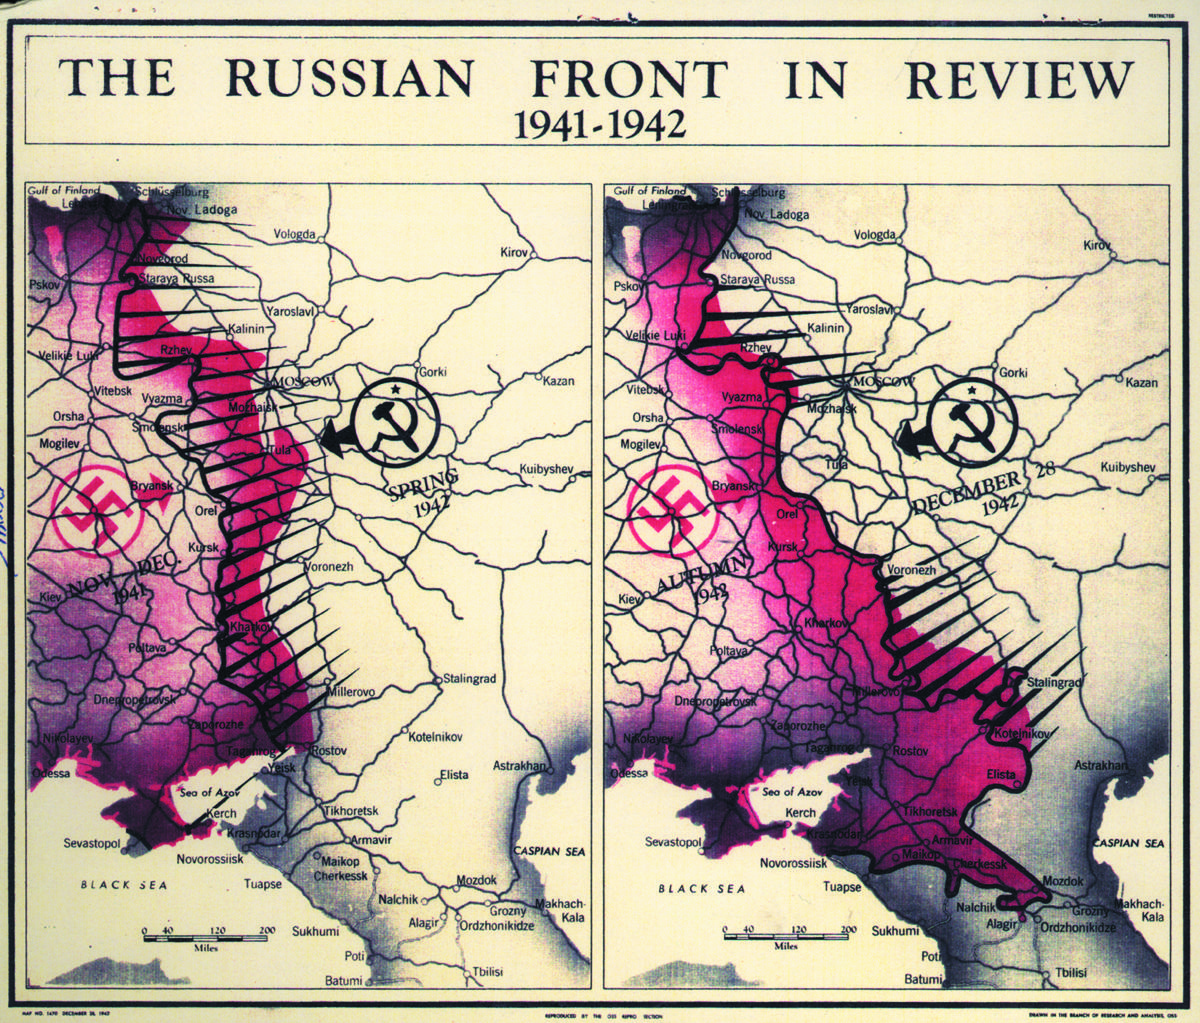
The Germans lost the Battle of Stalingrad on February 2, 1943, when the last German forces of the Sixth Army surrendered to the Soviet Union.
The battle had begun in August 1942 and became one of the deadliest and most important turning points of World War II. After Stalingrad, Germany lost the initiative on the Eastern Front, and Soviet forces began pushing westward toward Germany.
Also see: Watch A Map Of The Battle Of Stalingrad In 60 Seconds
1943 Leningrad Front Map
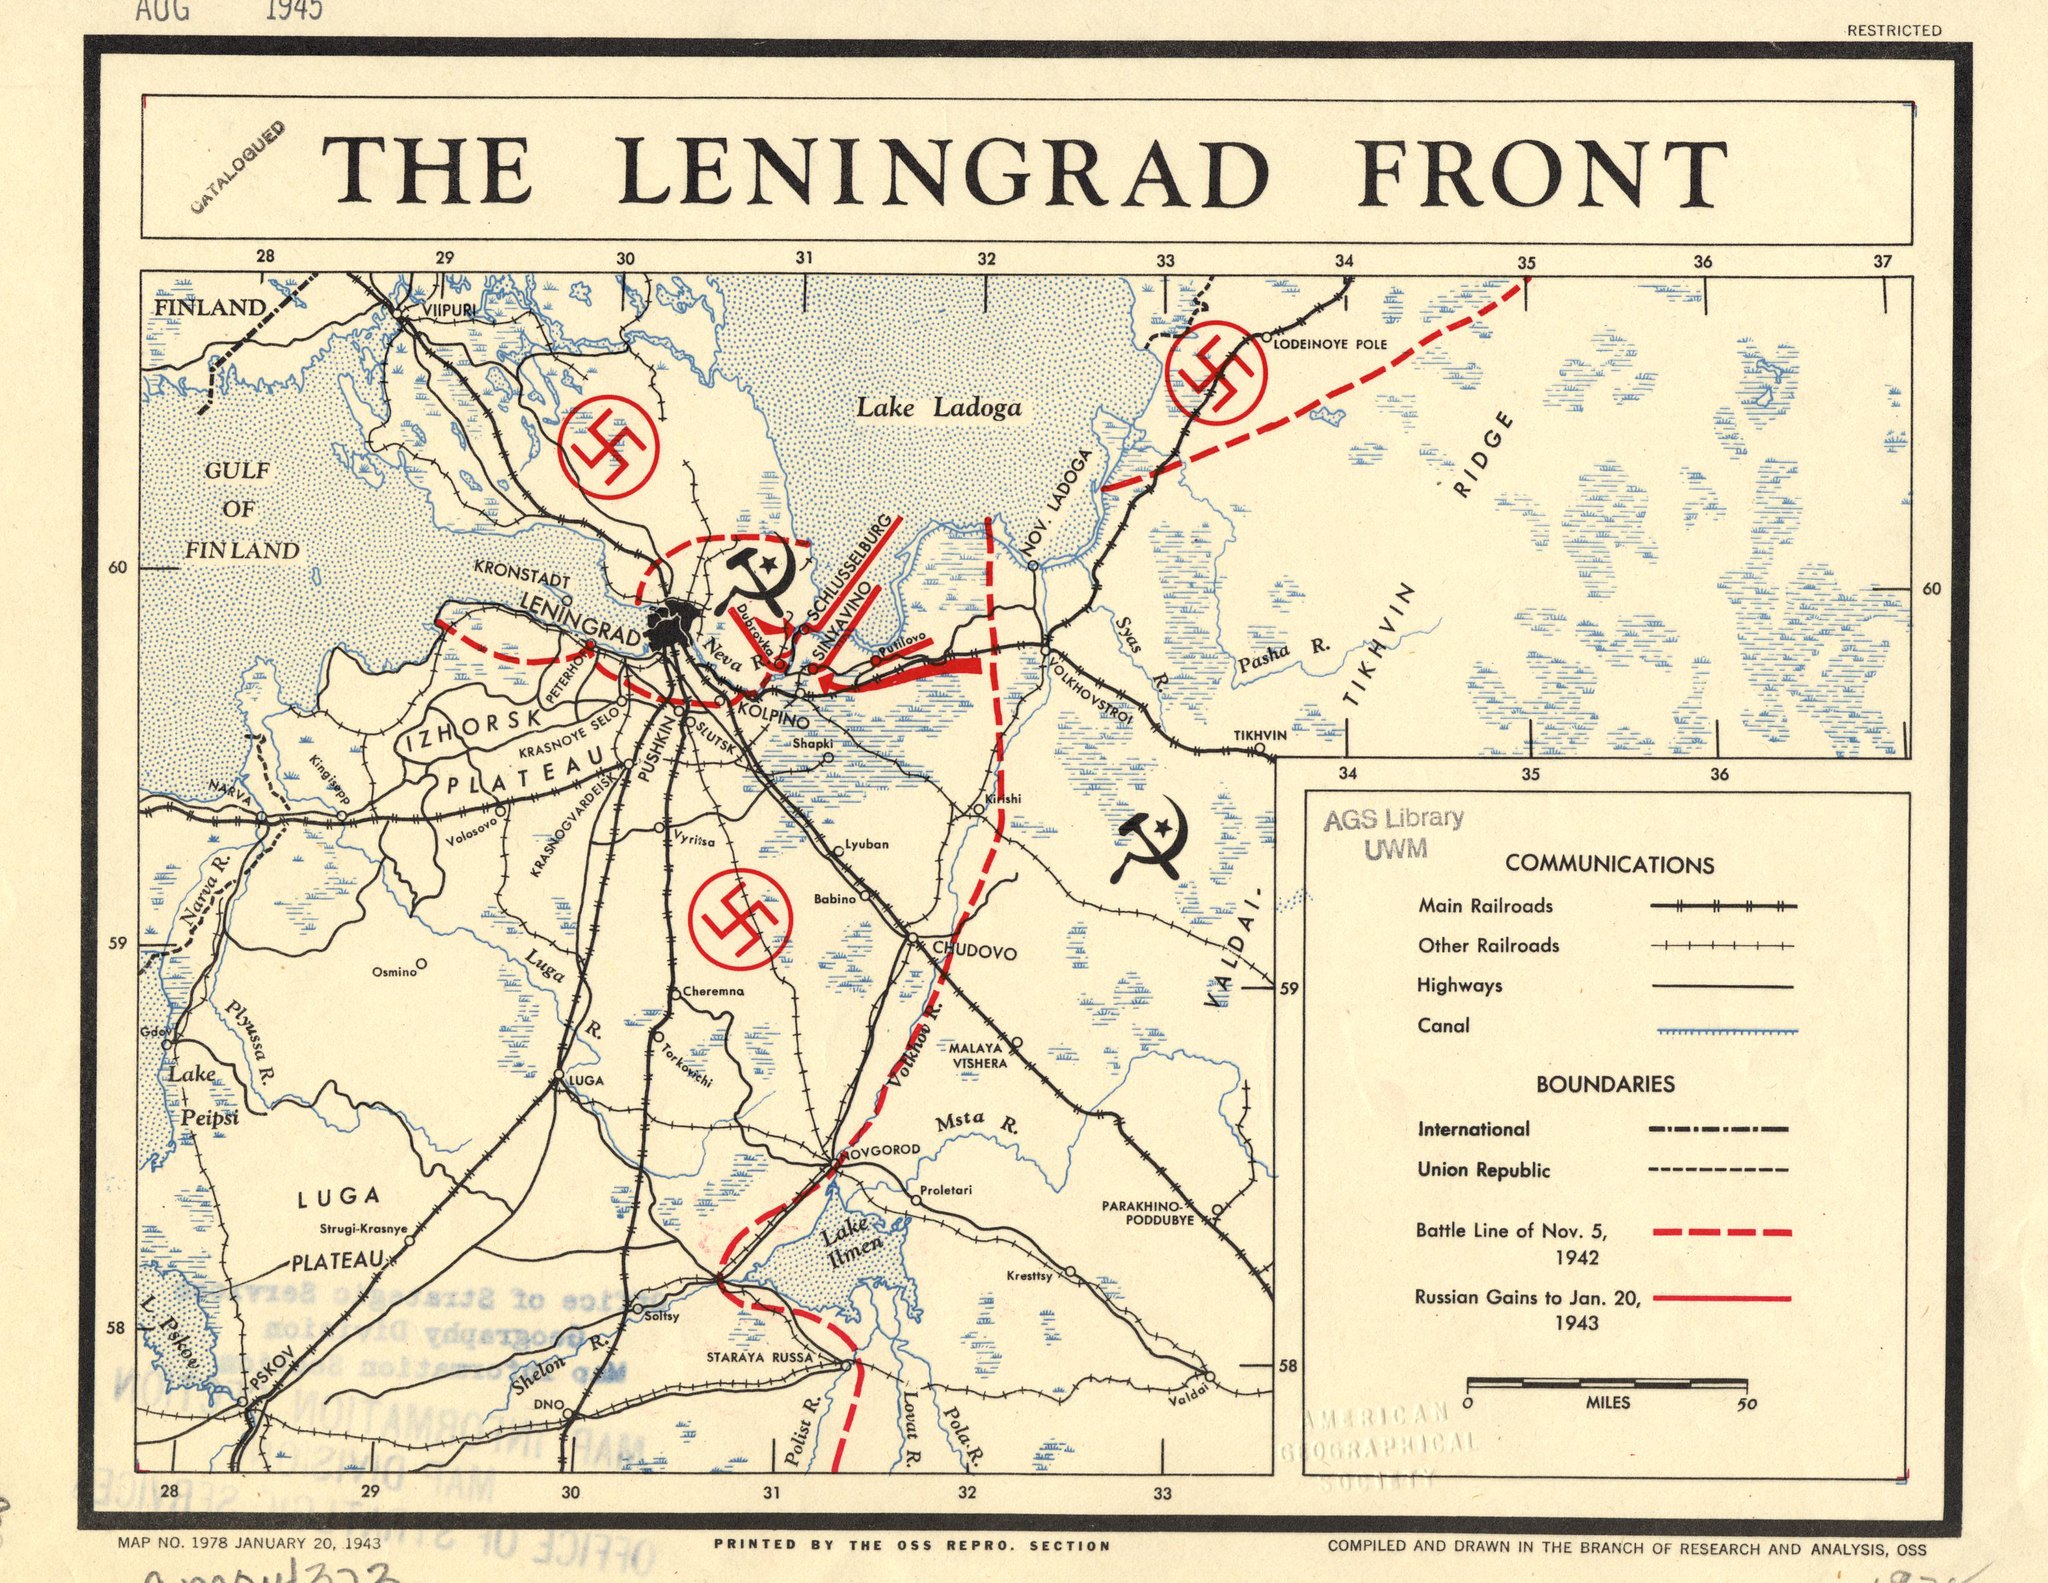
The Siege of Leningrad lasted from September 1941 to January 1944, when German and Finnish forces surrounded the Soviet city of Leningrad (now Saint Petersburg).
The siege caused terrible suffering, as food shortages, freezing temperatures, and constant bombing led to the deaths of more than a million civilians.
Despite these hardships, the Soviet Union kept the city from falling, using supply routes across frozen Lake Ladoga, and eventually broke the siege in 1944, marking another major turning point in World War II.
Also see: Watch WW2 In Europe With Army Sizes In Just 60 Seconds
1943 Po Valley Terrain Map
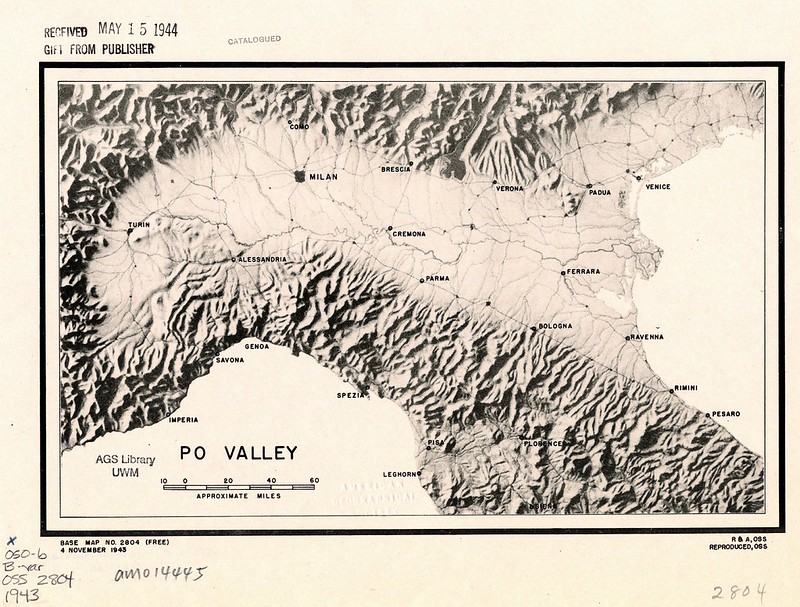
Also see: Area Transferred To France From Italy In The Paris Peace Treaty Of 1947
1943 Tunisia Map
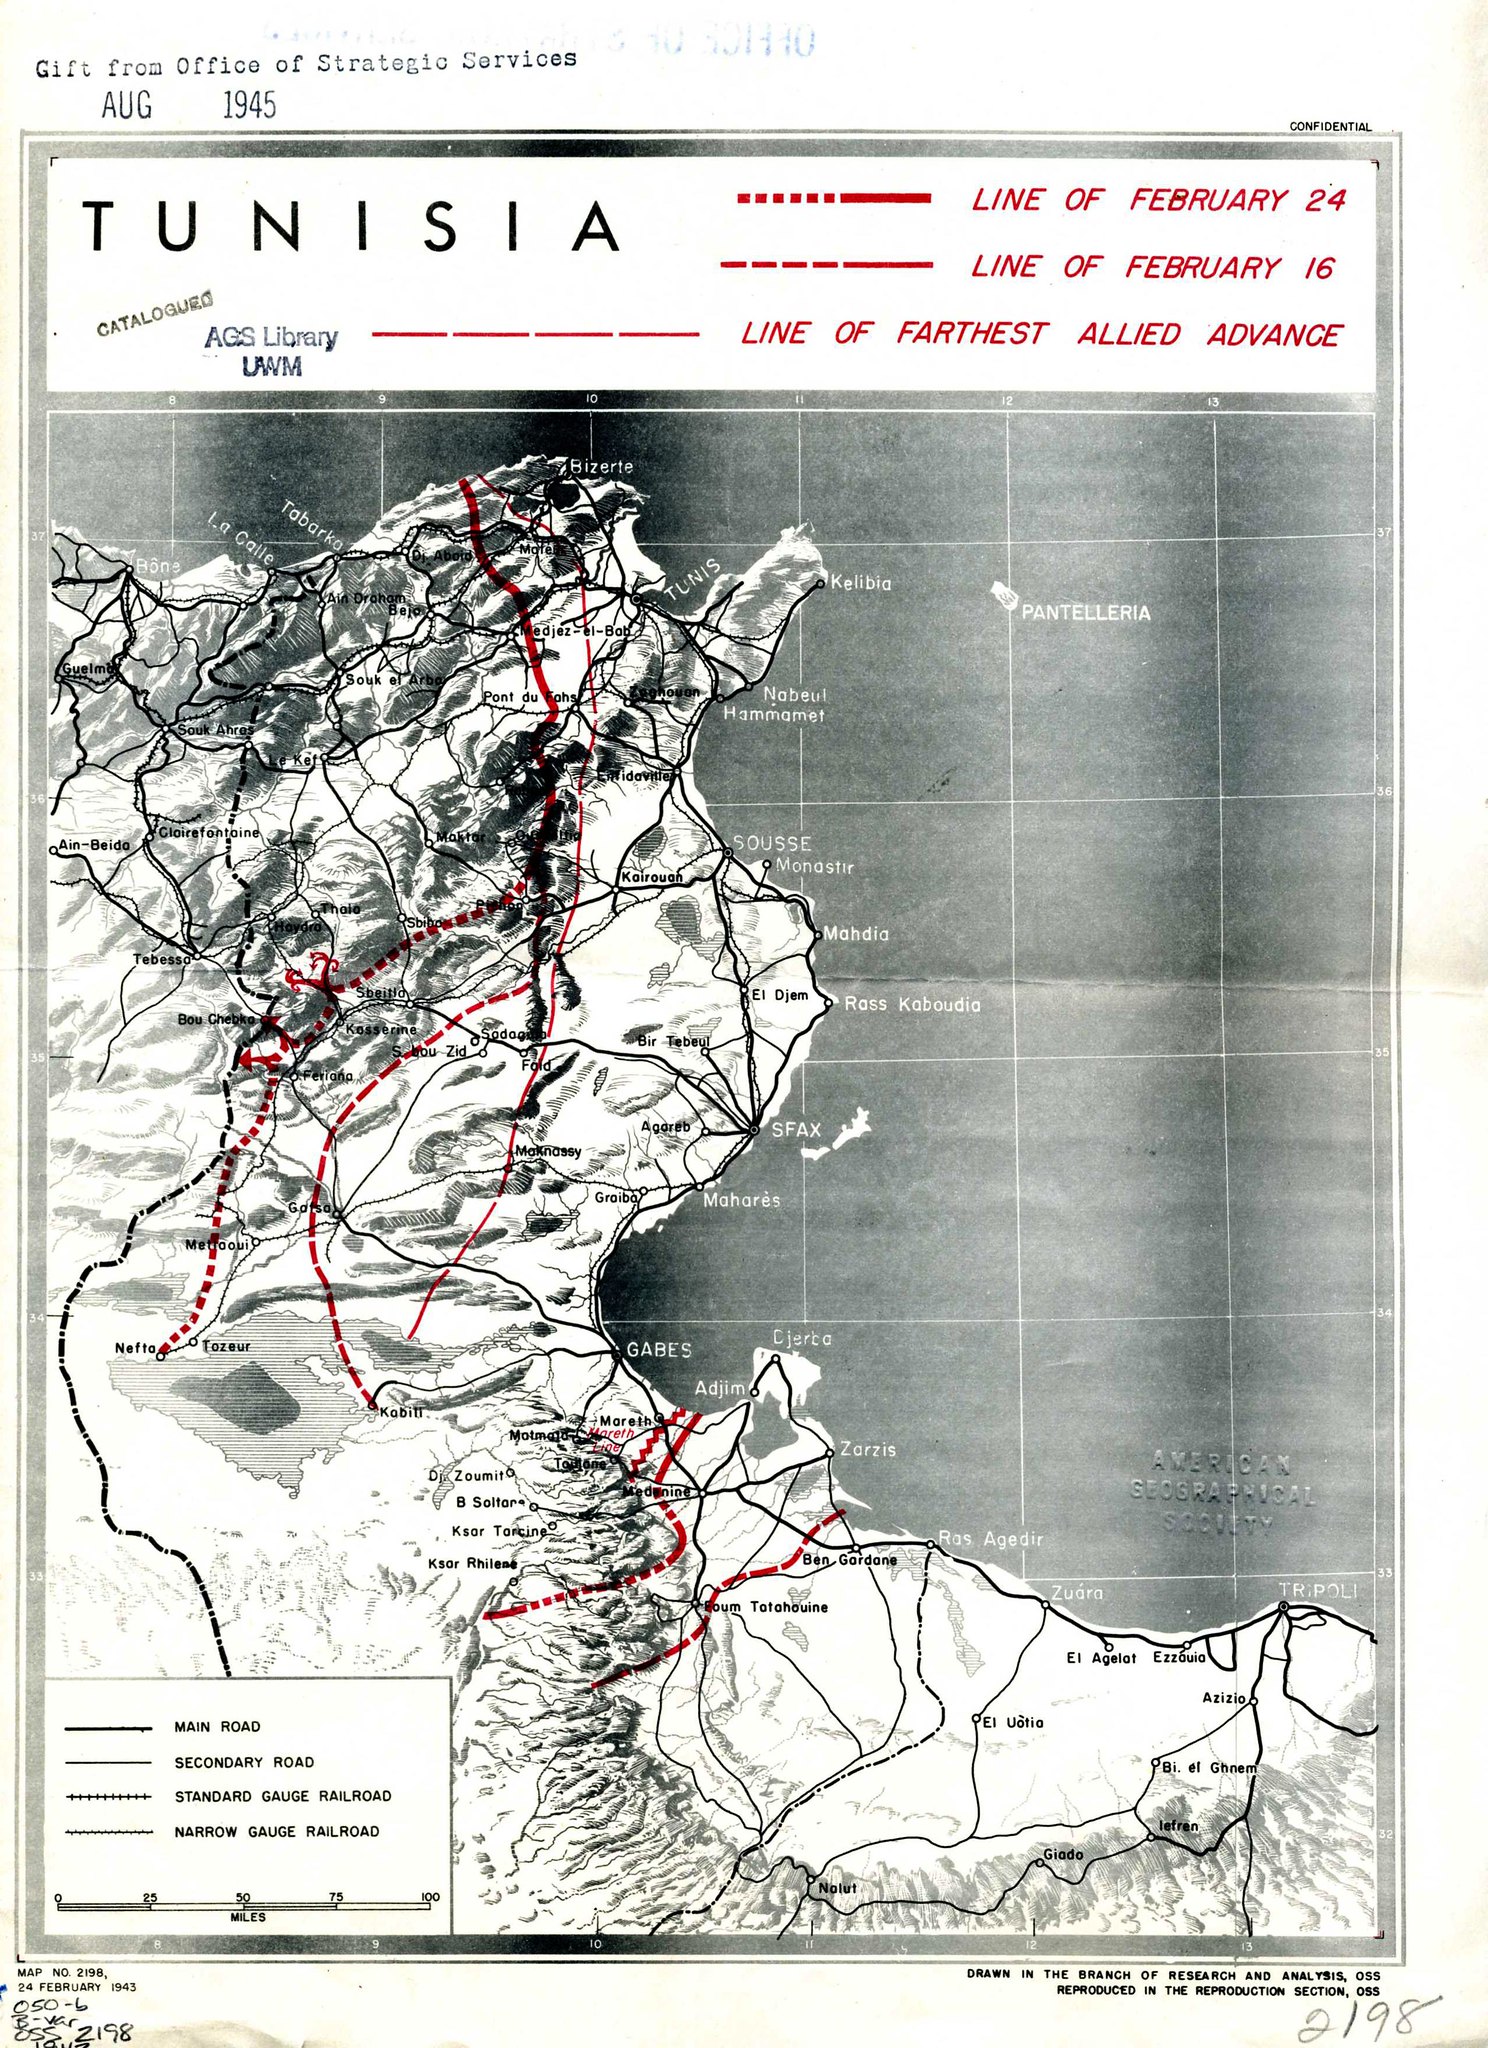
The Tunisia Campaign took place from November 1942 to May 1943 in North Africa between Allied forces and German-Italian armies.
After the Allied landings in Morocco and Algeria during Operation Torch, the Allies pushed east toward Tunisia while Axis forces fought to keep control of the region.
The campaign ended with the surrender of more than 250,000 Axis troops in May 1943, giving the Allies control of North Africa and opening the way for the invasion of Sicily and Italy during World War II.
1944 China Map
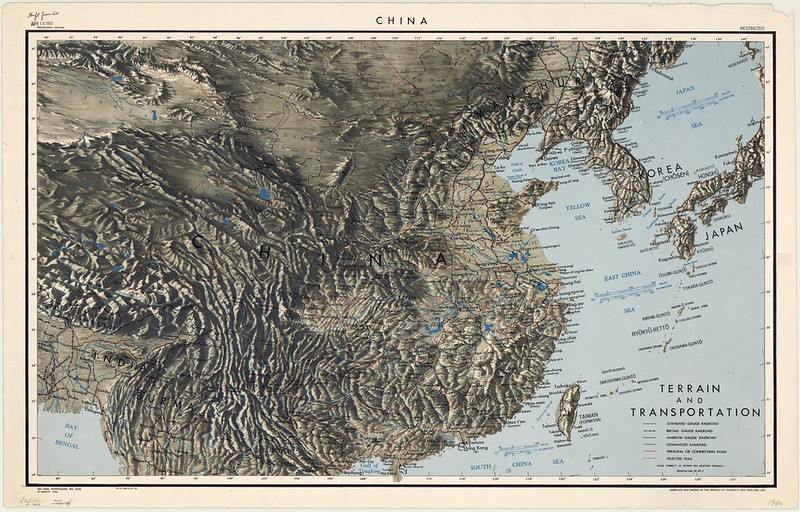
In 1944, China was heavily involved in Second Sino-Japanese War, which was part of World War II.
Japanese forces launched Operation Ichi-Go, the largest offensive of the war in China, capturing territory and important railways while trying to destroy American air bases.
Although China suffered enormous losses and hardship, Chinese forces continued resisting Japan with support from the United States and other Allies, helping tie down large numbers of Japanese troops.
1944 German Concentration Camps Map
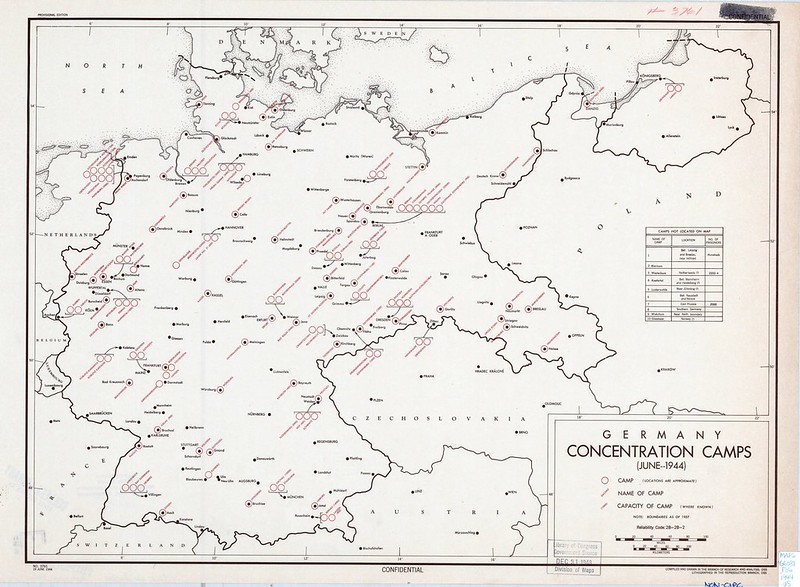
By 1944, the Allies knew that The Holocaust and the German concentration camp system involved mass murder, forced labor, starvation, and brutal treatment of prisoners.
Reports from escaped prisoners, resistance groups, intercepted German communications, and governments-in-exile had provided evidence of atrocities, and in 1942 the Allies had already publicly condemned the Nazi policy of extermination.
In 1944, detailed information about camps such as Auschwitz concentration camp became more widely known after the escape of Rudolf Vrba and Alfred Wetzler, whose report described gas chambers and the systematic killing of Jews.
Allied leaders understood that millions of people, especially Jews, were being murdered, although many ordinary citizens did not yet grasp the full scale of the genocide until camps were liberated in 1945 during World War II.
Also see: The Locations Of Nazi Germany’s Concentration & Death Camps and Jewish Population of Europe in 1933 and 2015
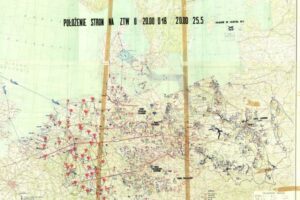
1944 Germany Population Density Map
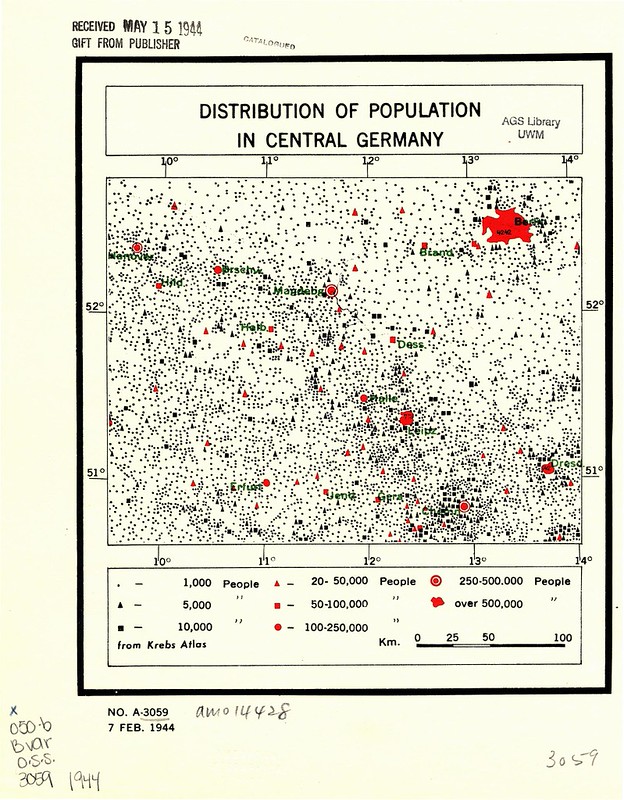
This map shows the population distribution of central Germany in early 1944.
The symbols represent different settlement sizes:
Tiny black dots = about 1,000 people
Black triangles = about 5,000 people
Black squares = about 10,000 people
Red triangles/squares/circles = progressively larger cities
Large red shaded areas = cities over 500,000 people
Major cities labeled include Berlin, Leipzig, Dresden, Magdeburg, and Chemnitz. T
he map emphasizes how densely populated parts of central Germany were, especially around Berlin and the industrial Saxony region.
In 1944, maps like this were important because Allied planners needed to understand:
- where industrial workers and transportation hubs were concentrated,
- which cities were key military or economic targets,
- how bombing campaigns might affect civilian populations,
- and where future invasion or occupation forces might encounter dense urban resistance.
The “Krebs Atlas” note at the bottom means the population data probably came from a German geographical atlas compiled before or during the war.
Also see: Population Along The Danube River
1944 Okinawa Enemy Dispositions Map
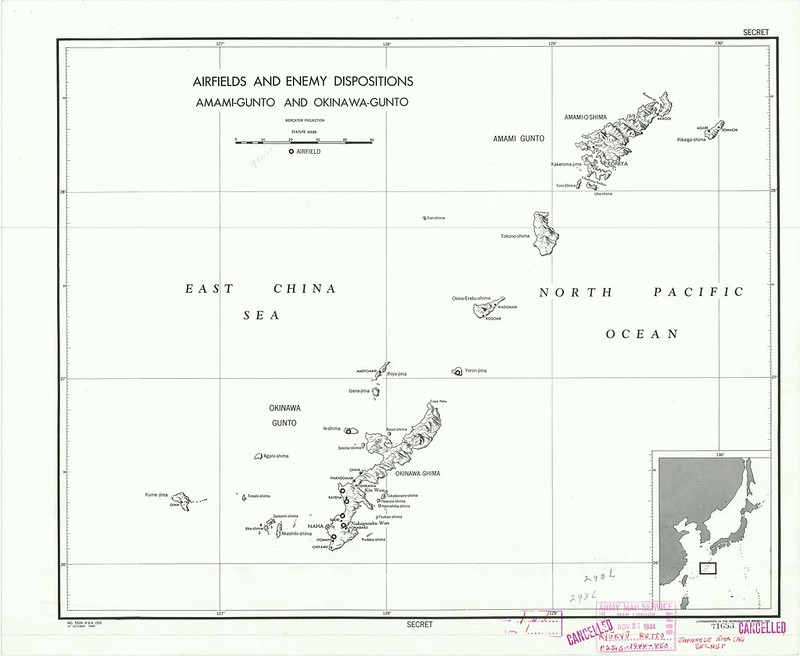
The Battle of Okinawa was one of the 11 bloodiest of World War 2.
1945 Approaches to Japan Map
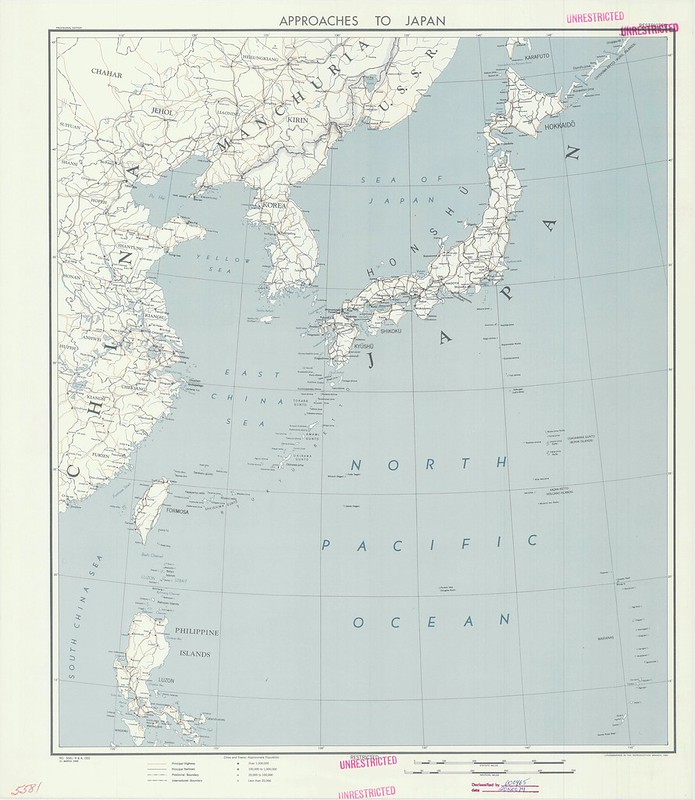
Before the atomic bomb was ready in 1945, the United States planned to defeat Japan through a combination of massive conventional bombing, naval blockade, and invasion.
American B-29 bombers carried out devastating firebombing raids on Japanese cities, while the U.S. Navy cut off supplies of food, fuel, and raw materials to weaken Japan’s ability to continue fighting.
The Allies were also preparing Operation Downfall, a large-scale invasion of the Japanese home islands that was expected to cause extremely high casualties on both sides during World War II.
1945 Berlin Zones of Occupation Map
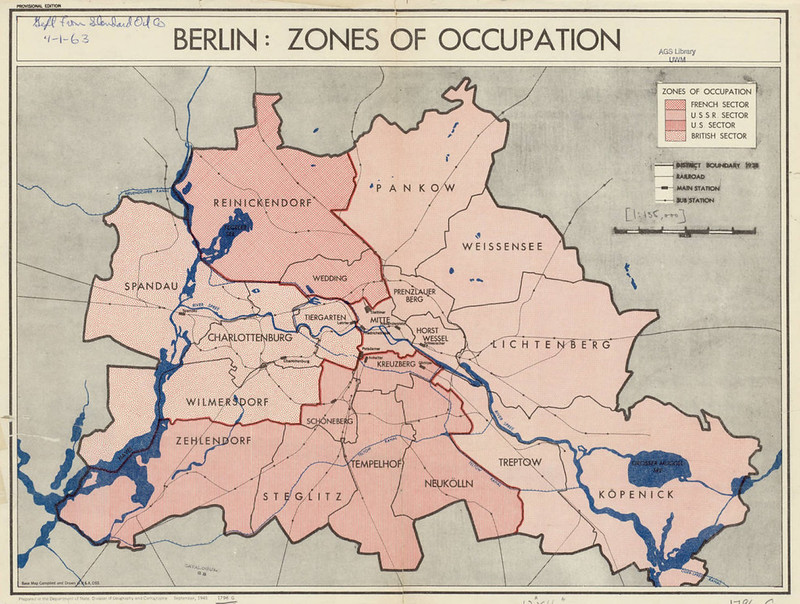
After World War II, Berlin was divided into four occupation zones controlled by the United States, Britain, France, and the Soviet Union.
Although Berlin was located deep inside the Soviet occupation zone of Germany, the western part of the city was controlled by the Western Allies, while East Berlin was controlled by the Soviet Union.
This division eventually led to the creation of West Berlin and East Berlin during the Cold War.
In 1961, the Soviet-backed East German government built the Berlin Wall to stop people from fleeing from East Berlin to West Berlin.
The wall remained until 1989, when it fell shortly before Germany was reunified in 1990.
Also see: My all time favourite map 1988 East German Map of West Berlin
1945 Indochina Roads Map
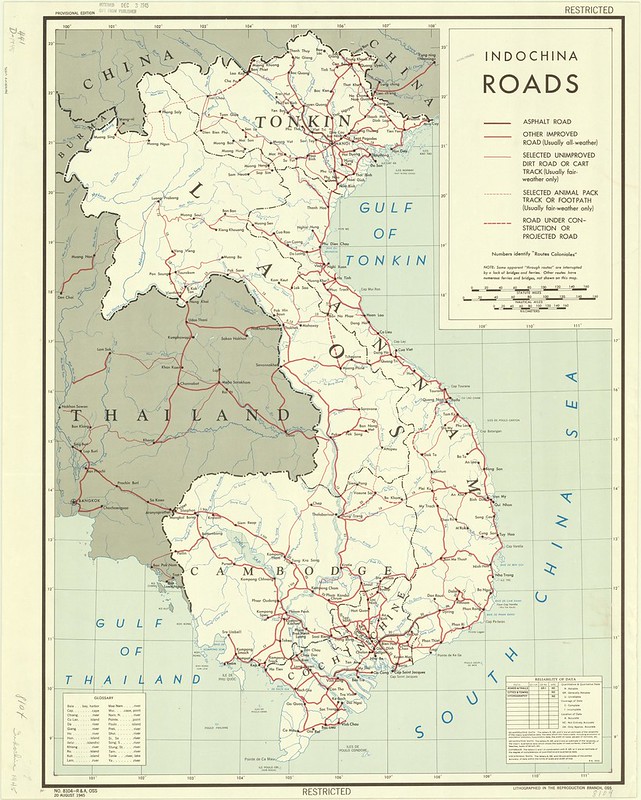
In 1945, French Indochina was in turmoil as World War II was ending. Japan had occupied the region during the war but allowed French colonial officials to remain until March 1945, when the Japanese overthrew French control and took direct power.
After Japan surrendered in August 1945, Vietnamese nationalist forces led by Ho Chi Minh and the Viet Minh seized the opportunity to launch the August Revolution.
Ho Chi Minh declared the independence of Vietnam on September 2, 1945, but France later attempted to reestablish colonial rule, leading to the First Indochina War.
Also see: Watch The Entire Vietnam War Using Google Earth
1945 Japan Food Sufficiency Map
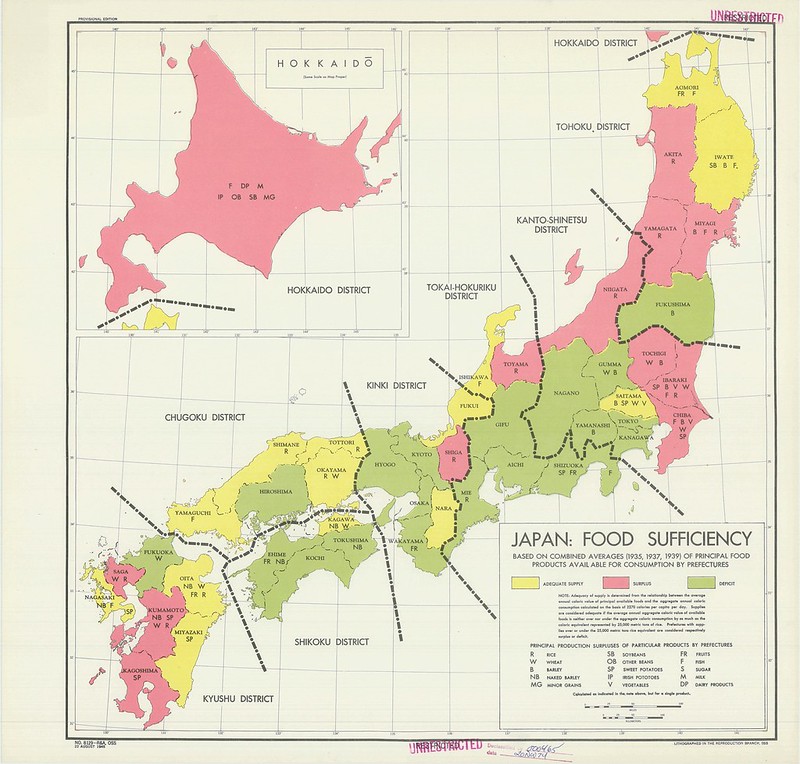
This map was produced in August 1945, just as World War II was ending.
The map analyzes how self-sufficient different prefectures of Japan were in producing food for their populations.
It was likely created for American planners preparing for the occupation of Japan after the surrender.
The colors counterintuitively show food supply conditions by prefecture:
Green = food deficit areas
Yellow = adequate supply
Pink/red = Surplus food production
The map reveals that heavily urbanized and industrial regions such as Tokyo, Osaka, and Kyoto had food shortages, while more rural farming areas produced surpluses.
This reflected a major wartime problem: Japan’s cities depended heavily on imported food and shipments from rural regions, but Allied naval blockades and bombing had disrupted transportation and trade.
The letters inside each prefecture identify major agricultural products:
R = rice
W = wheat
SB = soybeans
SP = sweet potatoes
F = fruits
and others such as barley, fish, vegetables, and dairy products.
Maps like this were extremely important to occupation planners because American authorities expected famine and social unrest after Japan’s surrender.
Understanding which regions could feed themselves, and which would require emergency imports, helped guide relief shipments, transportation planning, and occupation policy during the first months after the war.
1945 Korea & Manchuria Map
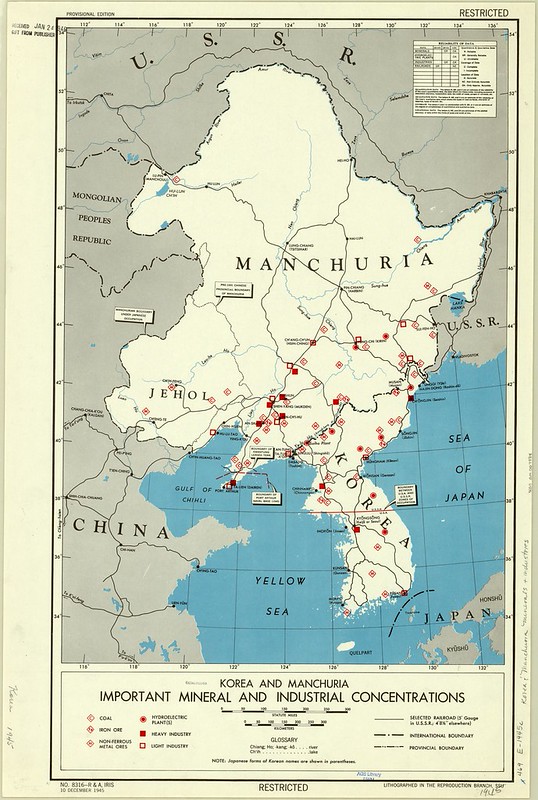
In 1945, Korea and Manchuria were major centers of conflict during the final months of World War II.
Korea had been under Japanese rule since 1910, while Manchuria was controlled by Japan through the puppet state of Manchukuo.
In August 1945, the Soviet Union invaded Manchuria in a massive offensive against Japanese forces, quickly defeating the Japanese Kwantung Army and helping force Japan toward surrender.
After Japan’s defeat, Korea was divided at the 38th parallel, with Soviet forces occupying the north and American forces occupying the south.
This temporary division eventually led to the creation of North and South Korea and rising Cold War tensions. In Manchuria, Soviet occupation and the collapse of Japanese control helped strengthen Chinese Communist forces, contributing to the later victory of the Communists in the Chinese Civil War.
1945 Korea Administrative Divisions
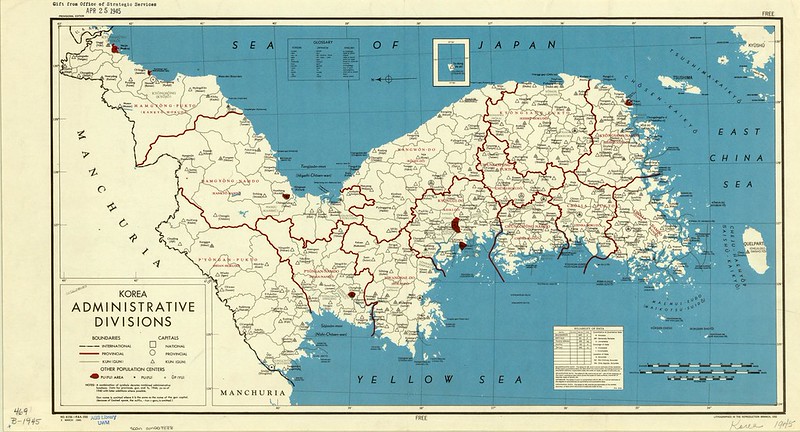
Before the Soviet occupation in 1945, Korea was not divided into North and South Korea.
Instead, the entire Korean Peninsula had been under Japanese colonial rule since 1910 as part of the Japanese occupation of Korea. Korea was governed as a single colony controlled from Tokyo, although it was divided internally into provinces for administration.
The division of Korea began only at the end of World War II in August 1945.
As Japan surrendered, the United States and the Soviet Union agreed to temporarily divide Korea along the 38th parallel: Soviet forces accepted the Japanese surrender in the north, while American forces did so in the south.
What was intended as a temporary military arrangement later hardened into the permanent division between North Korea and South Korea during the Cold War.
1945 Pacific Japanese Control Map
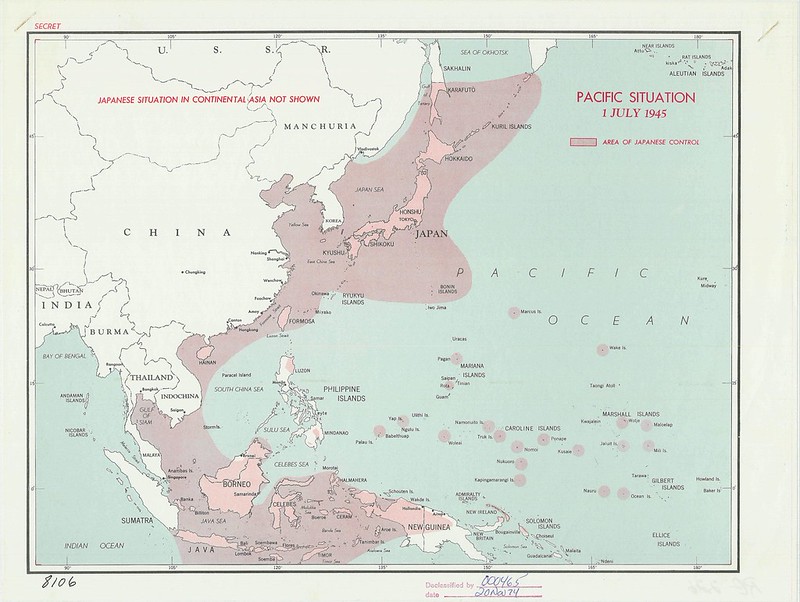
This map, titled “Pacific Situation – 1 July 1945,” shows the shrinking area still controlled by Japan near the end of World War II.
The shaded pink regions mark Japanese-controlled territory, stretching from Japan itself through Korea, Formosa (Taiwan), parts of China and Southeast Asia, and scattered Pacific islands.
By July 1945, Allied forces had already recaptured many major Pacific territories, leaving Japan increasingly isolated.
The map highlights how American advances through the Philippines, Mariana Islands, and Okinawa had cut Japanese supply lines and brought U.S. forces close to the Japanese home islands.
It reflects the strategic situation just weeks before the atomic bombings and Japan’s surrender in August 1945.
Also see: Territories Still Under Japanese Control At The Time Of Their Surrender On 15 August 1945
1945 Taegu Map
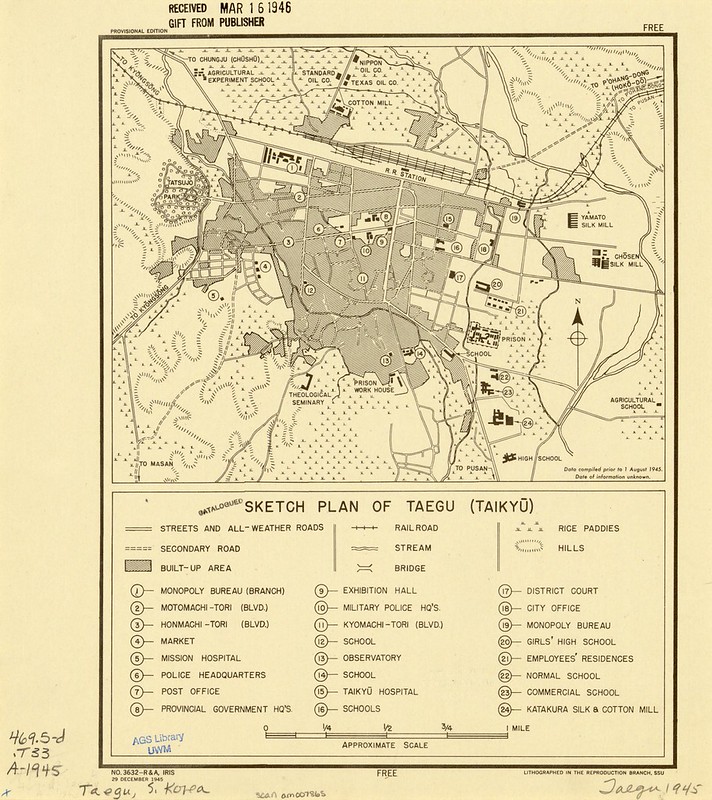
Taegu is now know as Daegu and is the third biggest city in South Korea behind Seoul and Busan.
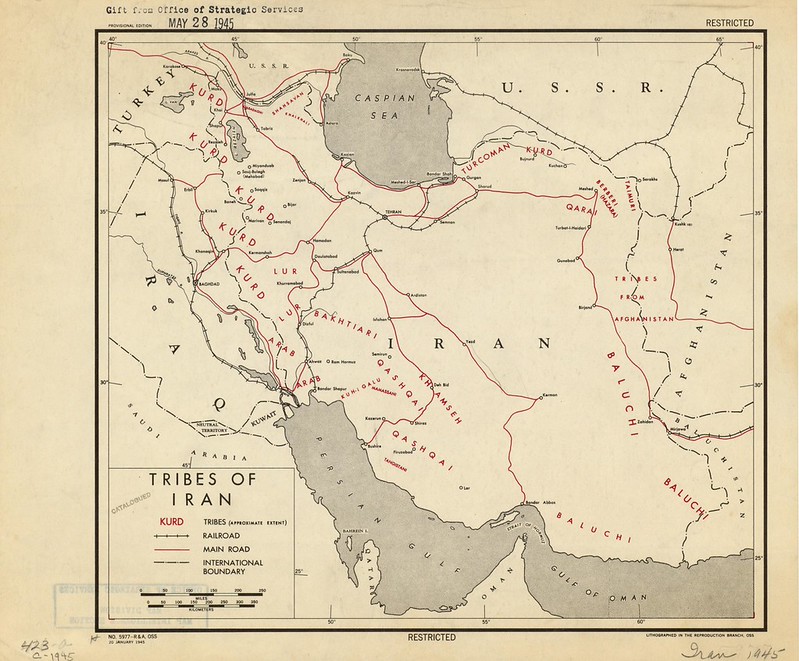
1945 Tribes of Iran Map
Also see: The Entire History of Iran: Every Year
1945 Venzia Giulia Italy Map
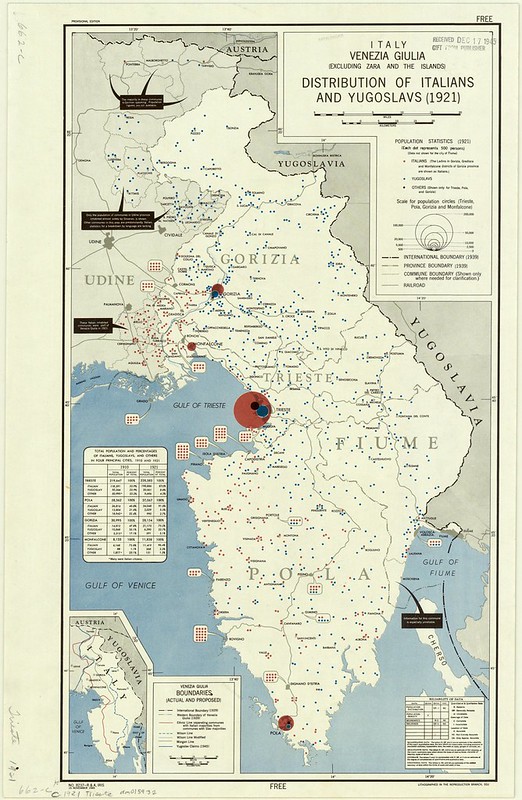
This 1945 map shows the ethnic and political tensions in the disputed border region of Venezia Giulia after World War II. The area included important cities such as Trieste, Gorizia, Pola, and Fiume (now Rijeka), and both Italy and Yugoslavia claimed the territory after the war.
The map uses red and blue dots to show the distribution of Italians and Yugoslav peoples (mainly Slovenes and Croats) based on 1921 census data.
Large circles indicate major population centers, especially around Trieste and Pola, where Italians formed large urban majorities, while many rural inland areas had mostly Slavic populations.
The inset at the bottom left compares proposed postwar boundaries, including Italian and Yugoslav territorial claims.
This map was likely created for Allied diplomats and occupation officials during the 1945 peace negotiations.
The ethnic mixture of the region made it extremely difficult to draw borders acceptable to both sides, and the dispute became one of the first major tensions of the early Cold War.
Eventually, Trieste became a temporary Free Territory before most of the region was divided between Italy and Yugoslavia in the 1950s.
Also see: Results of The 1946 Italian Referendum On The Monarchy vs Republic
1946 Korea Zones Map
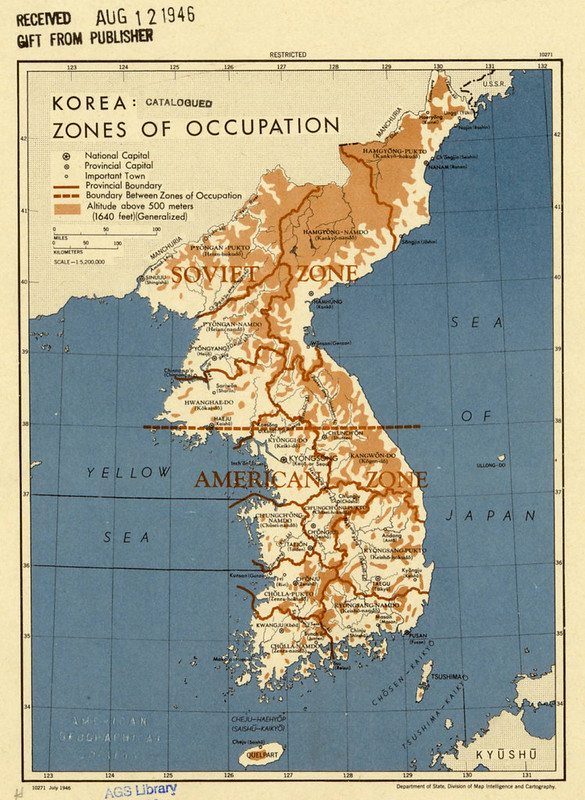
This 1946 map, titled “Korea: Zones of Occupation,” shows the division of Korea after the end of World War II.
The dashed horizontal line across the peninsula marks the 38th parallel, which separated the Soviet occupation zone in the north from the American occupation zone in the south after Japan’s surrender in 1945.
The northern area, labeled “Soviet Zone,” was occupied by Soviet forces moving south from Manchuria, while the southern “American Zone” was occupied by U.S. troops arriving from the Pacific. Important cities such as Pyongyang and Seoul are shown, along with provincial boundaries and mountainous terrain.
At the time this map was made, the division was officially considered temporary, but growing tensions between the United States and the Soviet Union soon turned Korea into a major Cold War frontier.
By 1948, two separate governments had formed — North Korea in the Soviet-backed north and South Korea in the American-backed south — eventually leading to the Korean War.
Also see: Map of The Korean War In 60 Seconds
President Roosevelt Looking At An OSS Globe
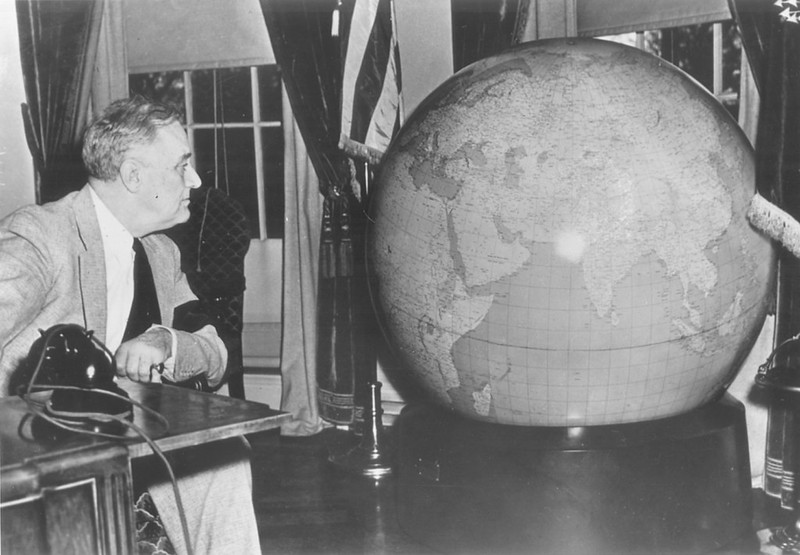
This photograph shows Franklin D. Roosevelt studying a very large globe during World War II from the OSS (Office of Strategic Services). The OSS was America’s wartime intelligence service and the forerunner of the CIA.
The huge globe symbolized the global scale of the war and the increasingly international role of the United States under Roosevelt’s leadership. During the war, Roosevelt regularly worked with military planners, intelligence officers, and map specialists who used globes and large-scale maps to discuss strategy, shipping routes, bombing campaigns, and Allied operations across Europe, Africa, and the Pacific.
The globe itself was probably more than decoration.
Large globes were valuable planning tools because they showed the true geographic relationships between continents and oceans better than flat maps. This mattered especially in wartime planning for long-distance air routes, naval logistics, and global strategy.
The image also reflects Roosevelt’s leadership style: he often used visual aids like maps and globes during meetings to explain complex military and diplomatic situations.
Also see: 1944 US Presidential Election Map
More Declassified CIA Maps
- 14 Declassified CIA Cartography Maps From The 1950s
- 16 Declassified CIA Cartography Maps From The 1960s
- 19 Declassified CIA Cartography Maps From The 1970s
- 12 Declassified CIA Cartography Maps From The 1980s
- 16 Declassified CIA Cartography Maps From The 1990s
- 16 Declassified CIA Cartography Maps From The 2000s
- 15 Declassified CIA Cartography Maps From The 2010s


Leave a Reply