The maps below all come this CIA album on Flicker. They describe the maps in the following ways:
CIA Cartography Center has been making vital contributions to our Nation’s security, providing policymakers with crucial insights that simply cannot be conveyed through words alone.
1961 Indochina Map With President Kennedy
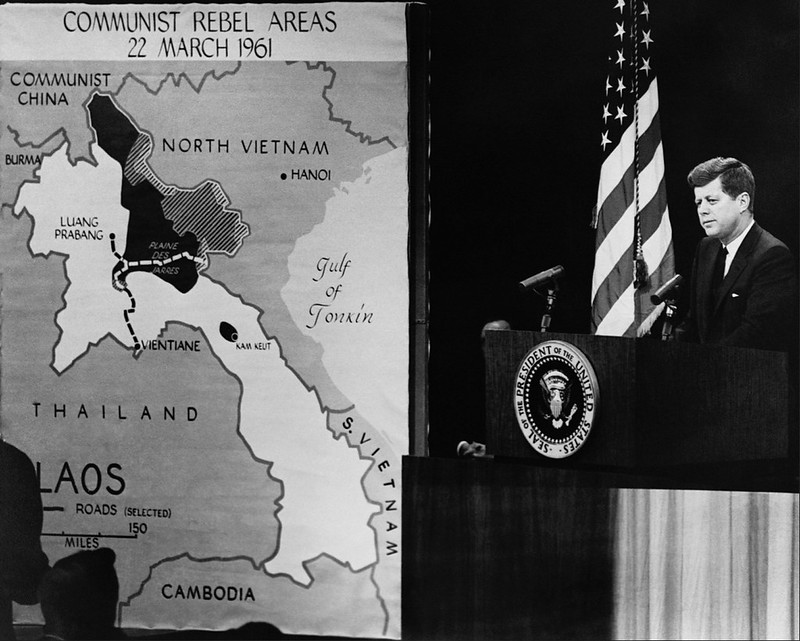
This photograph shows John F. Kennedy speaking in 1961 beside a large briefing map titled “Communist Rebel Areas – 22 March 1961.”
The map focuses on Laos during the early stages of the Laotian crisis, a major Cold War conflict in Southeast Asia.
The shaded regions mark areas controlled or influenced by communist insurgents, especially the Pathet Lao, who were supported by North Vietnam and indirectly by the Soviet Union and People’s Republic of China.
The map was part of Kennedy’s effort to explain why Laos mattered strategically to the United States.
American leaders feared that if Laos fell under communist control, neighboring countries such as South Vietnam, Cambodia, and Thailand might also become vulnerable, an idea later known as the “domino theory.”
The dark and striped areas on the map show rebel-controlled territory spreading across northern and eastern Laos, including the strategically important Plain of Jars region.
This image captures a key moment early in Kennedy’s presidency when Southeast Asia was becoming a central focus of American Cold War policy.
Although Laos itself often received less attention than Vietnam, the conflict there deeply influenced U.S. decision-making. The instability in Laos helped convince Kennedy’s administration that communist influence in the region was expanding, contributing to the gradual escalation of American involvement in Vietnam War.
The map also reflects how visual aids were used in Cold War politics.
Large briefing maps like this helped presidents communicate complex geopolitical conflicts to the public, Congress, and allies by simplifying military and political situations into easily understood territorial patterns of “communist expansion.”
Also see: The Geographical Centre of Vietnam is in Laos & The Geographical Centre of Laos is in Thailand
1961 British Honduras Boundary Map
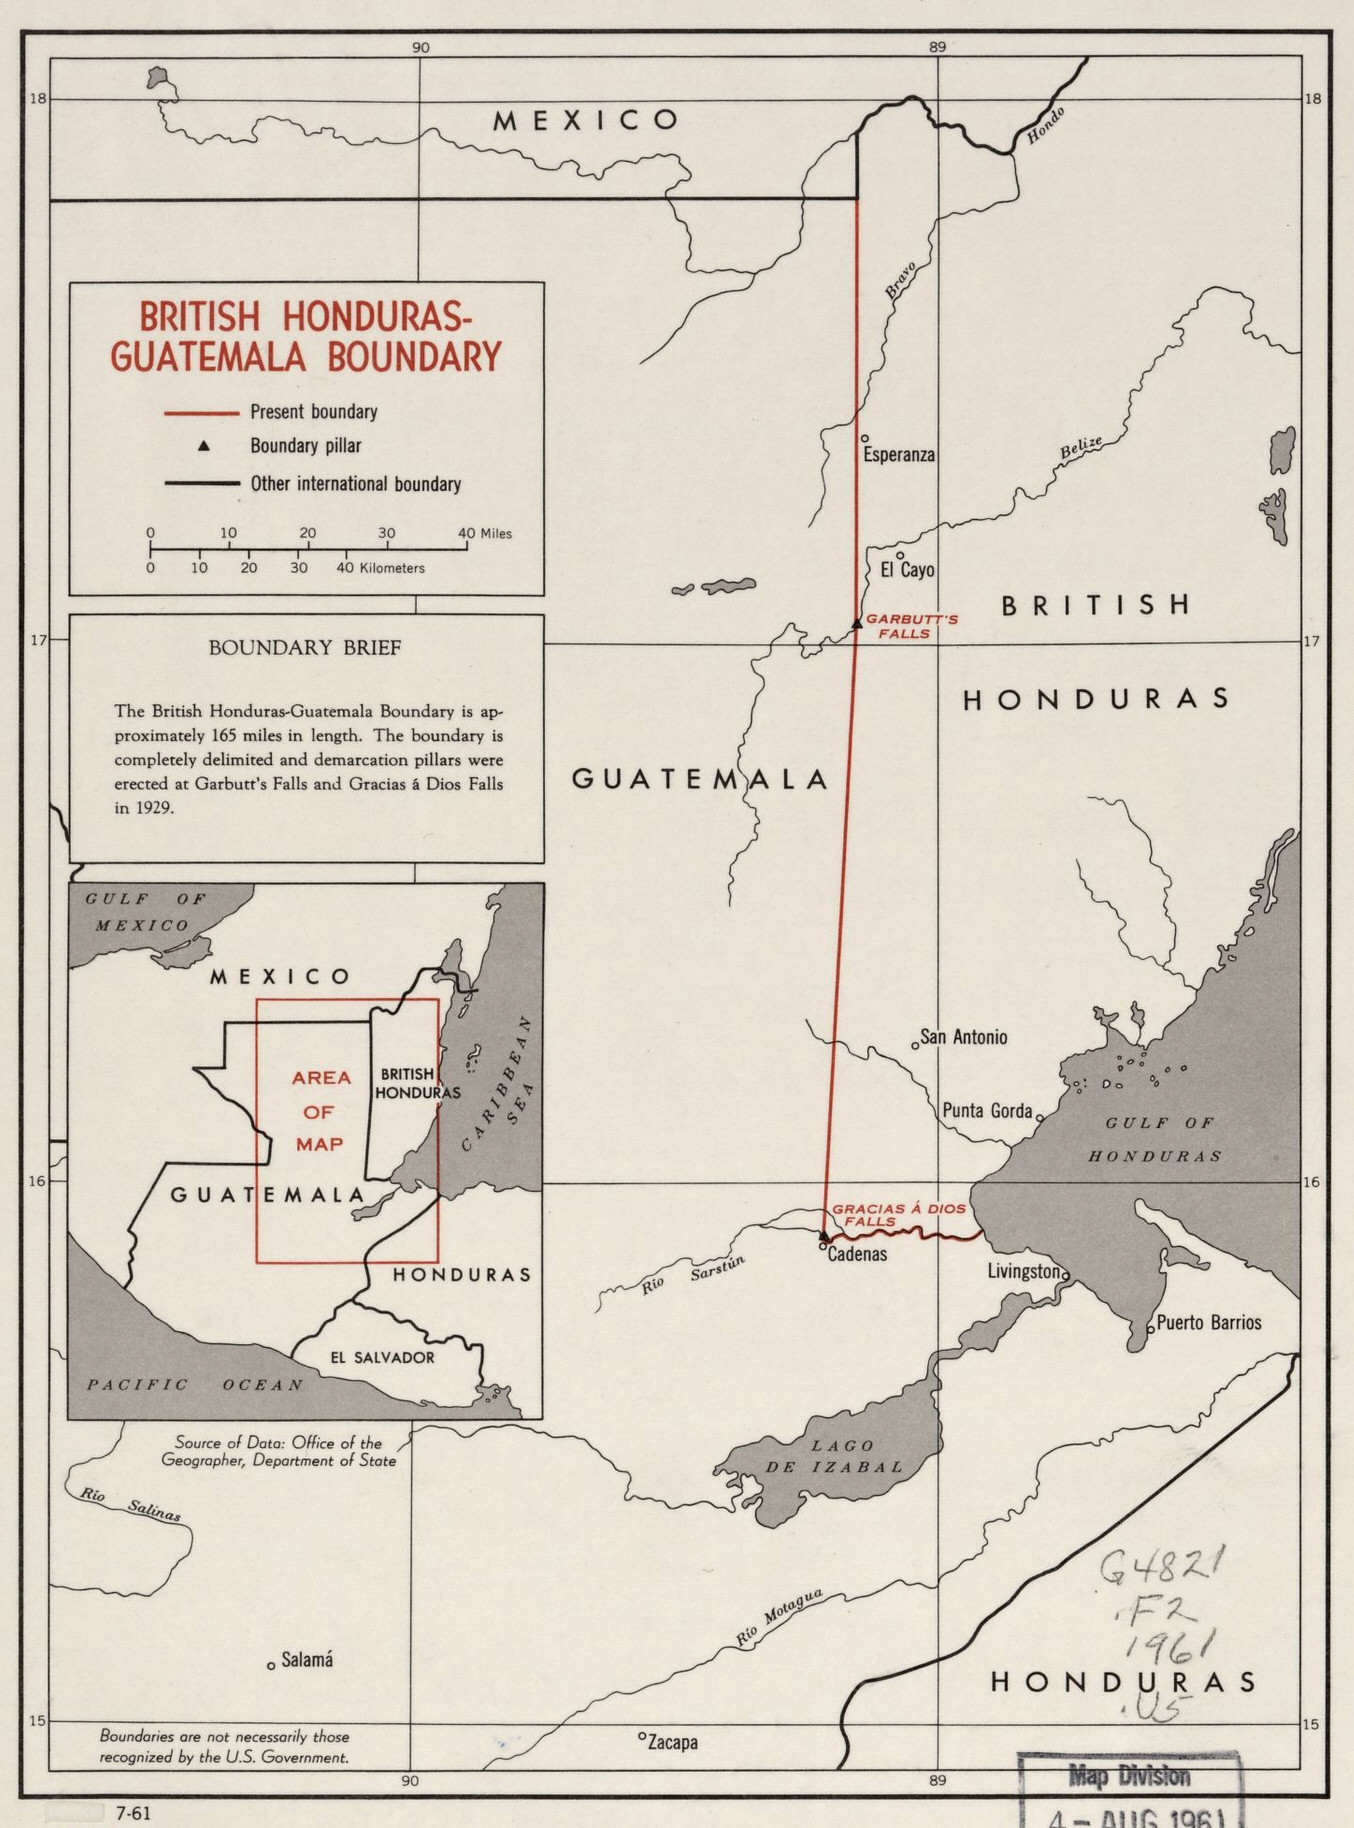
This 1961 CIA map titled “British Honduras-Guatemala Boundary” focuses on the disputed border between Guatemala and Belize, which at the time was still the British colony of
British Honduras. The map was produced during a period of growing tension over territorial claims in Central America during the Cold War.
The red line marks the officially recognized colonial boundary established between British Honduras and Guatemala.
The map notes that the border had been formally demarcated with boundary pillars in 1929, including markers at Garbutt’s Falls and Gracias á Dios Falls. Despite this, Guatemala continued to dispute the legitimacy of the border and claimed much or all of British Honduras as Guatemalan territory.
The roots of the dispute went back to the 19th century.
Britain and Guatemala signed agreements defining the border, but Guatemala later argued that Britain had failed to fulfill certain treaty obligations, especially promises related to infrastructure and transportation links.
Because of this, Guatemalan governments periodically asserted claims over the colony.
By 1961, the issue had strategic importance for the United States and the CIA because instability in Central America was increasingly viewed through the lens of anti-communism after the Cuban Revolution.
Border disputes, nationalist movements, and colonial questions were closely monitored out of concern that regional unrest could create openings for Soviet or Cuban influence.
The map also captures a transitional moment before decolonization.
British Honduras would later become the independent state of Belize in 1981, though Guatemala did not fully recognize Belizean independence for many years afterward.
The territorial dispute remained unresolved for decades and is still subject to international legal discussions today.
Also see: The Map Of Belize Created By The CIA
1962 Cuba Missiles Map
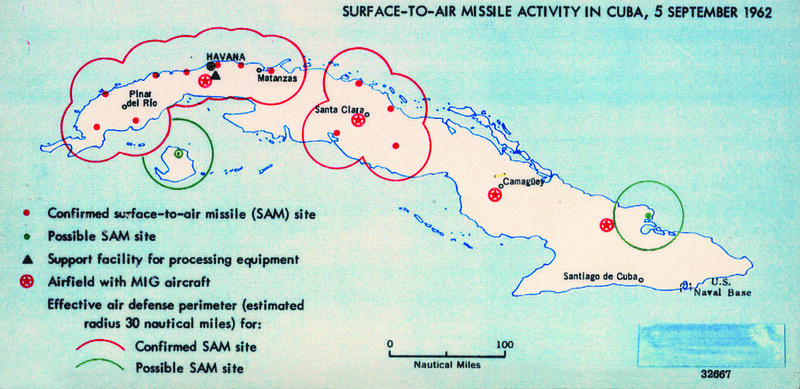
This map, titled “Surface-to-Air Missile Activity in Cuba, 5 September 1962,” is an early intelligence map from the Cuban Missile Crisis.
It shows the locations of Soviet-built surface-to-air missile (SAM) sites being established across Cuba before the discovery of Soviet nuclear missiles later that autumn.
The red symbols mark confirmed SAM sites, while green symbols indicate possible missile sites.
The circles around them show estimated air-defense coverage areas.
Major Cuban cities such as Havana, Santa Clara, and Santiago de Cuba are protected by overlapping missile defenses, and the map also identifies military airfields with MiG fighter aircraft.
The concentration of SAM defenses around western Cuba especially alarmed American intelligence analysts because it suggested the Soviet Union was protecting something strategically important.
At first, the Soviet Union claimed these missile systems were purely defensive.
However, U.S. reconnaissance flights soon discovered Soviet medium-range nuclear missiles hidden on the island. The SAM network shown here was intended partly to prevent American surveillance aircraft from observing the missile buildup.
This map captures the crisis in its early stages, before the world realized how close it was coming to nuclear war.
By October 1962, President John F. Kennedy announced a naval quarantine of Cuba after U.S. spy planes confirmed the presence of nuclear missile launch sites.
The crisis became one of the most dangerous moments of the Cold War because the Soviet missiles in Cuba could strike much of the continental United States within minutes.
Also see: Map Of Cuba Created By The CIA
1963 China Communist Areas Map
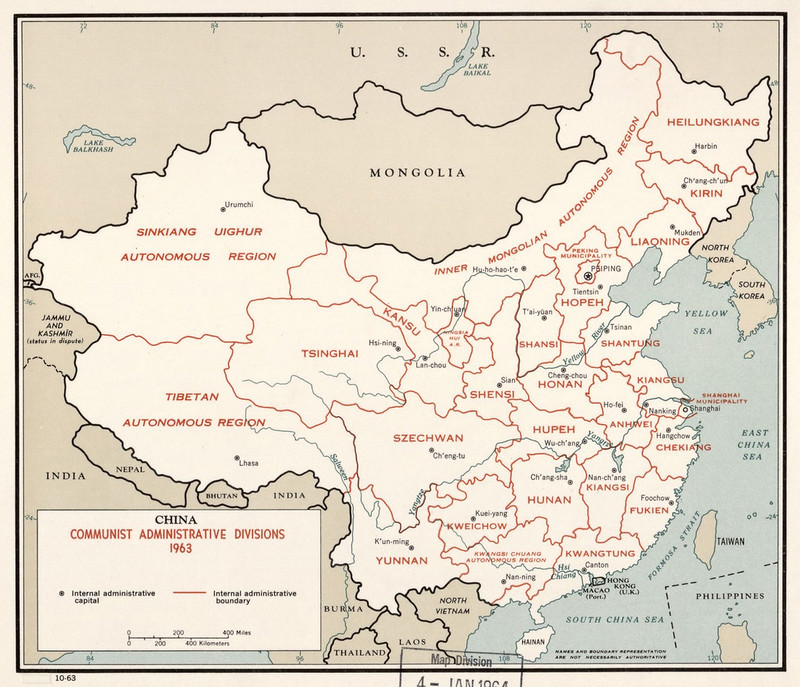
This 1963 CIA map titled “China: Communist Administrative Divisions” shows how the United States intelligence community organized and understood the internal provincial structure of People’s Republic of China during the early Cold War.
the United States in 1963 still officially recognized the Republic of China (ROC) on Taiwan as the legal government of all China, not the communist government in Beijing.
That political position shaped both the language and purpose of maps like this.
The CIA and other U.S. agencies often referred to mainland China as “Communist China” rather than simply “China” in order to distinguish it from the ROC government on Taiwan.
Even though Washington did not diplomatically recognize the PRC, American intelligence still needed detailed maps of the mainland for military, political, and strategic analysis.
The map shows:
- provincial boundaries,
- autonomous regions,
- provincial capitals,
- and major administrative areas under communist control in 1963.
Several regions highlighted on the map had special political significance:
- Sinkiang Uighur Autonomous Region (modern Xinjiang)
- Tibetan Autonomous Region
- Inner Mongolian Autonomous Region
These “autonomous regions” reflected the PRC’s attempt to administer large non-Han ethnic frontier areas while maintaining strong central control from Beijing (spelled “Piping/Peking” on some older U.S. maps).
The map also captures China shortly after major upheavals:
- the Great Leap Forward,
- the catastrophic famine of the early 1960s,
- and the worsening split between China and the Soviet Union.
For the CIA, administrative maps like this were important because provincial organization affected:
- military districts,
- economic planning,
- transportation systems,
- ethnic control,
- and political stability.
The map also reflects older Western spellings still common in U.S. government usage at the time, such as:
- “Szechwan” for Sichuan,
- “Kwangtung” for Guangdong,
- “Fukien” for Fujian,
- and “Sinkiang” for Xinjiang.
The diplomatic situation shown indirectly by this map lasted until the 1970s. The United States did not formally recognize the PRC government until 1979, when diplomatic recognition shifted from Taipei to Beijing under President Jimmy Carter.
Also see: China GDP Per Capita By Decade From 1950 To 2020
1963 China-India Border Map
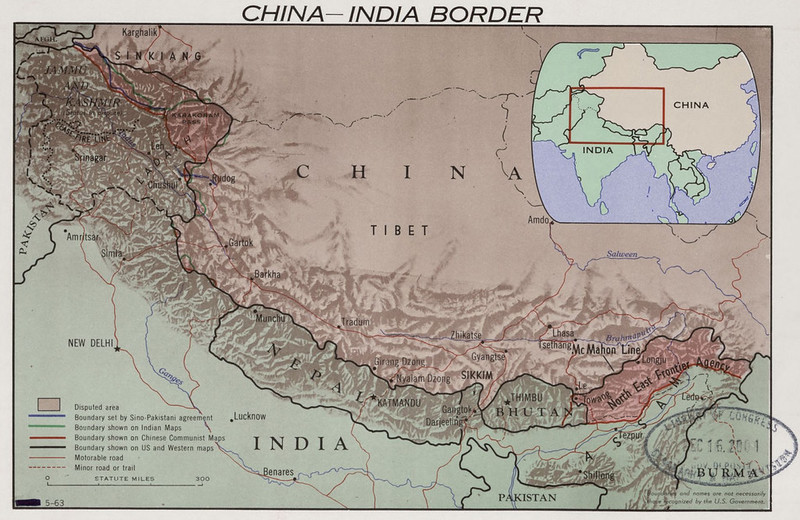
This 1963 map reflects the tense aftermath of the Sino-Indian War between India and People’s Republic of China.
The shaded areas mark disputed frontier regions along the Himalayas where both countries claimed territory but disagreed over the exact boundary.
The map highlights two major disputed regions:
- Aksai Chin in the western Himalayas near Kashmir
- the North East Frontier Agency (NEFA) in the east, which is now the Indian state of Arunachal Pradesh
Different colored boundary lines show how the border appeared on Indian maps, Chinese maps, and older British imperial maps.
This reflects one of the central problems behind the conflict: the border had never been clearly agreed upon after the end of British rule in India. China rejected some colonial-era boundary agreements, especially the McMahon Line in the eastern Himalayas.
The war itself erupted in 1962 after years of rising tensions, border patrol clashes, and road construction by China through Aksai Chin linking Tibet and Xinjiang.
Chinese forces advanced rapidly in both sectors before declaring a unilateral ceasefire and withdrawing from some captured territory. The conflict shocked India and transformed Asian Cold War politics.
This CIA-produced map reflects American strategic concerns during the Cold War.
After the war, the United States became more supportive of India as a counterweight to communist China, even though India officially remained non-aligned.
The map was useful for intelligence analysis because the mountainous border region was extremely difficult to survey and had enormous military importance for control of Himalayan passes, transportation routes, and Tibetan access points.
Also see: Interactive Map of All The World’s Land Border Crossings
1963 Cuba Soviet Forces Map
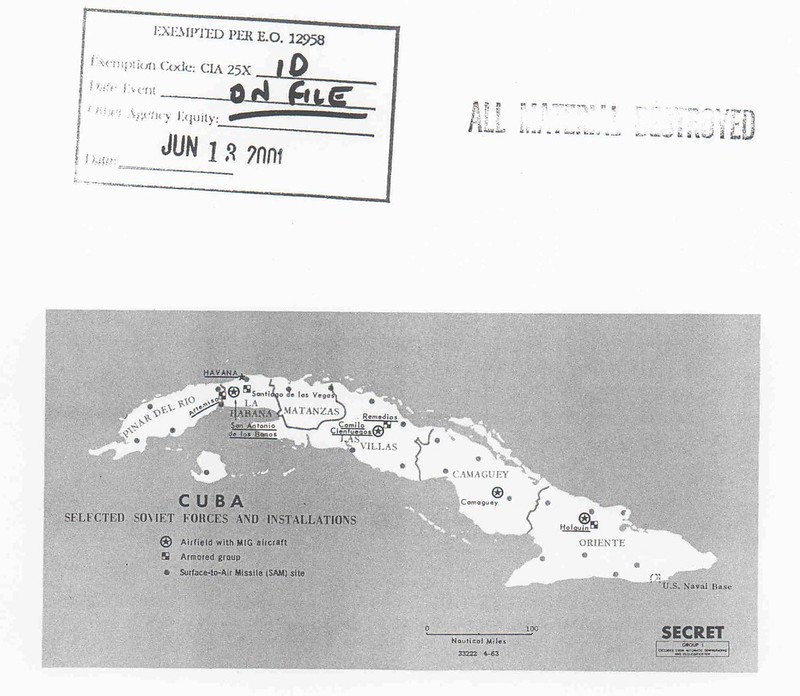
This 1963 map titled “Cuba: Selected Soviet Forces and Installations” shows key Soviet military positions in Cuba shortly after the Cuban Missile Crisis.
Although the crisis officially ended in late 1962 after the Soviet Union agreed to remove its nuclear missiles, the map demonstrates that significant Soviet military infrastructure still remained on the island in 1963.
The symbols identify several types of Soviet-supported military facilities:
- airfields with MiG fighter aircraft,
- armored group positions,
- and surface-to-air missile (SAM) sites.
Many of these installations are concentrated around Havana and western Cuba, the same region where Soviet missile deployments had been discovered during the crisis. The SAM sites were especially important because they formed an air-defense network designed to protect Cuba from possible American air attacks or invasion attempts.
The map reflects the continuing military relationship between Fidel Castro’s government and the Soviet Union after the missile crisis. Even though offensive nuclear missiles were withdrawn, Cuba remained heavily armed and closely aligned with Moscow during the Cold War.
For the CIA and U.S. military planners, maps like this were extremely important because Washington feared that Cuba could continue serving as a Soviet military outpost only 90 miles from the United States.
American reconnaissance flights, naval surveillance, and intelligence operations therefore continued long after the immediate missile crisis had ended.
1963 South Asia Map
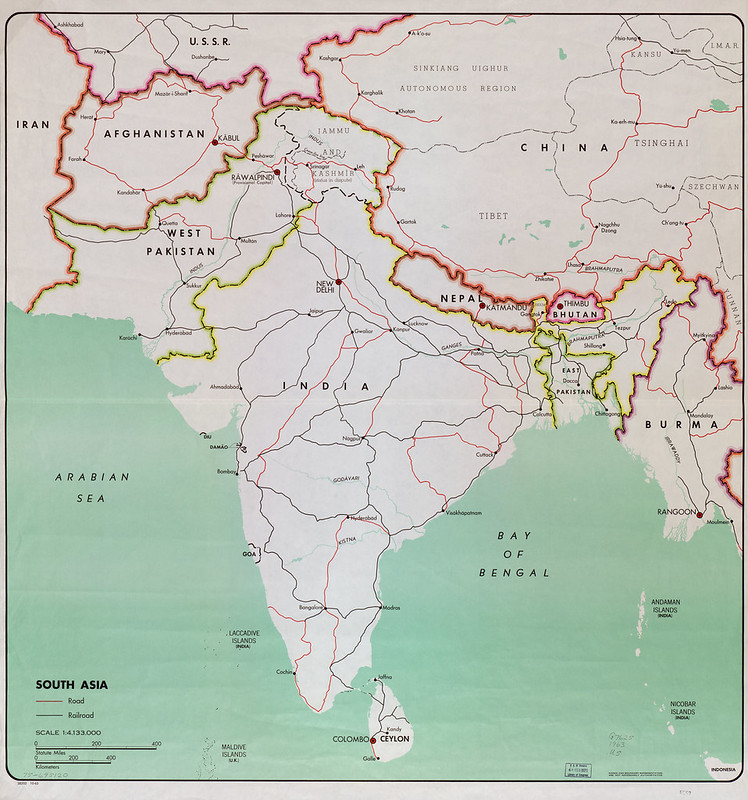
This 1963 map of South Asia shows the political boundaries, major roads, and railroads of the region during a tense period of the Cold War.
It includes countries such as India, Pakistan, Afghanistan, Nepal, Bhutan, Burma, and Ceylon.
Several features on the map are historically important because they differ from today:
- West Pakistan and East Pakistan are both shown. East Pakistan later became Bangladesh after the 1971 Bangladesh Liberation War.
- Burma had not yet changed its official English name to Myanmar.
- Ceylon would not officially become Sri Lanka until 1972.
- The map still labels Sinkiang Uighur Autonomous Region and older spellings such as “Tsinghai” and “Szechwan,” reflecting older Western transliterations used by U.S. agencies in the early 1960s.
- Kashmir is marked as disputed territory between India and Pakistan, a major issue that remains unresolved today.
The highlighted borders along the Himalayas reflect the growing strategic importance of the region after the Sino-Indian War.
The United States closely monitored transportation routes, mountain frontiers, and rail links because South Asia had become an important geopolitical crossroads between communist China, the Soviet Union, and Western-aligned countries.
The transportation networks shown on the map were strategically important.
Railroads and roads connected ports, capitals, and border regions, helping move military forces, trade, and supplies across the subcontinent. In the Cold War context, infrastructure maps like this helped the CIA and U.S. policymakers evaluate regional stability, military mobility, and the influence of rival powers throughout Asia.
Also see: 6 Different Regions of Asia Map
1965 Sikkim Map
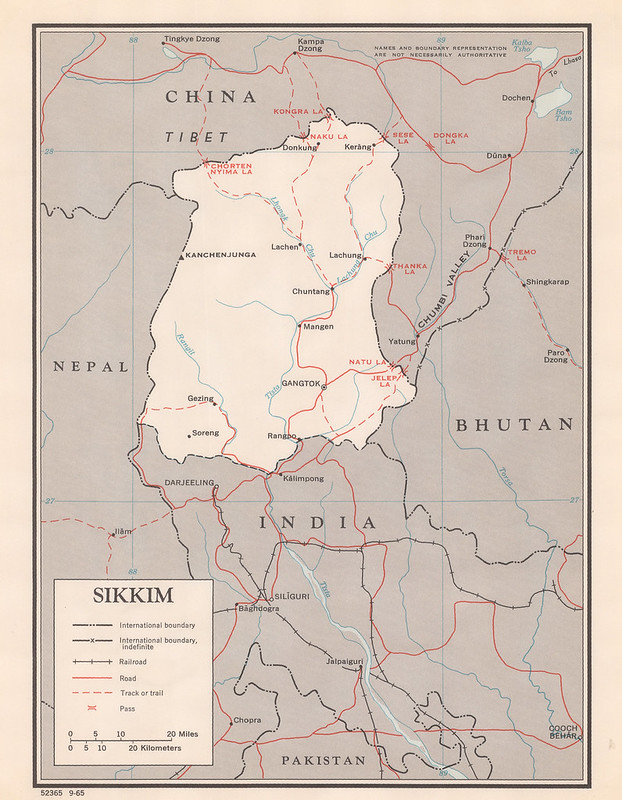
This 1965 map of Sikkim shows a strategically sensitive Himalayan region during the height of the Cold War and only a few years after the Sino-Indian War.
At the time, Sikkim was not yet a full state of India.
Instead, it was an Indian protectorate ruled by the Chogyal monarchy under strong Indian influence.
Sikkim would not formally become an Indian state until 1975.
The map emphasizes mountain passes, roads, tracks, and disputed frontiers between Sikkim, China (through Tibet), Nepal, and Bhutan. Several important Himalayan passes are marked, especially:
- Nathu La
- Jelep La
- Cho La
These passes were extremely important because they connected India with Tibet and could be used for trade, troop movements, or military operations.
After the 1962 war, India became highly concerned about Chinese military activity along the Himalayan frontier, and Sikkim became one of the most heavily militarized border regions in Asia.
The map also shows the narrow “Siliguri Corridor” area south of Sikkim near Darjeeling and Jalpaiguri.
This corridor, sometimes called the “Chicken’s Neck”, is strategically vital because it connects mainland India to its northeastern states. Any threat in Sikkim or nearby Bhutan could potentially endanger this narrow connection.
This map therefore reflects much more than local geography.
For U.S. intelligence analysts in 1965, Sikkim was part of the broader strategic competition involving China, India, Tibet, and the Soviet-American rivalry in Asia.
The detailed attention to roads, passes, and frontier boundaries suggests concern about possible future border clashes between India and China in the Himalayas.
Also see: The 17 Oddest Shaped Countries In The World & How They Came To Be
1966 Bogota Map
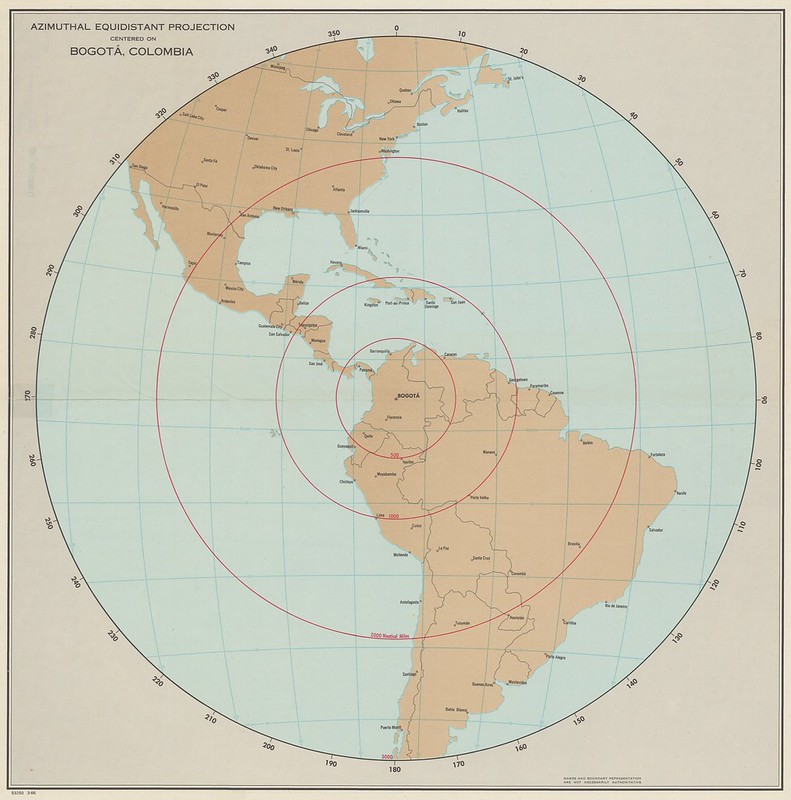
This 1966 map centered on Bogotá is less a political map and more a strategic geographic projection.
It uses an azimuthal equidistant projection, meaning that distances measured outward from Bogotá are accurate in every direction.
The red circles mark equal-distance rings: 500, 1000, 2000, and 3000 nautical miles, radiating from the Colombian capital.
The map reflects Cold War-era strategic thinking about Latin America and regional connectivity. By centering the hemisphere on Bogotá, U.S. analysts could quickly evaluate:
- air travel and military flight distances,
- communications coverage,
- trade and shipping routes,
- regional political influence,
- and how quickly forces or supplies could move across the Americas.
In the 1960s, Colombia was viewed by the United States as one of the key anti-communist states in northern South America, especially after the Cuban Revolution and during fears of leftist insurgencies spreading through Latin America.
Bogotá was becoming an important diplomatic and military hub tied to U.S. hemispheric strategy.
The projection also visually emphasizes Colombia’s geographic position:
- close to the Caribbean,
- connected to Central America,
- relatively near the southern United States,
- and centrally located between the Atlantic and Pacific sides of Latin America.
You can also see how the map minimizes the traditional “north-up world map” perspective.
Instead of placing Washington or Europe at the center, it puts northern South America at the strategic core. That was useful for planning aviation routes, radar coverage, intelligence operations, and regional defense coordination during the Cold War.
Also see: Direct Flights To & From Bogota El Dorado International Airport (BOG): Price & Destinations Map
1967 Aden Map
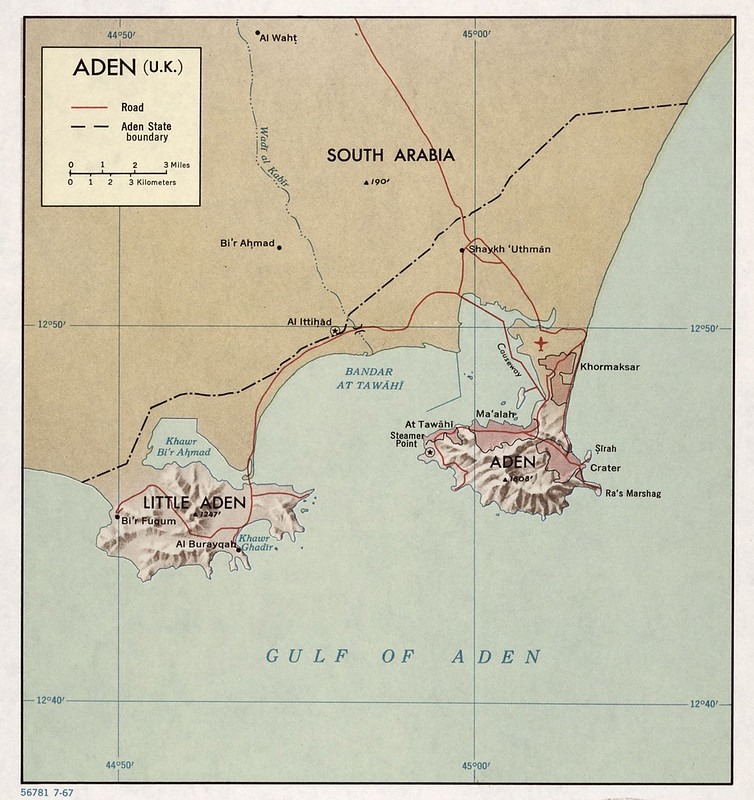
This 1967 map of Aden captures a place at the center of Britain’s collapsing empire east of Suez.
At the time, Aden was still formally under British control as part of the Federation of South Arabia, only months before Britain withdrew in November 1967 and the territory became the independent state of South Yemen.
A few important things stand out:
- Aden itself (the volcanic peninsula on the right) was one of the world’s most important refueling and shipping ports because it sat near the entrance to the Red Sea and the route to the Suez Canal.
- Little Aden (left side) contained major oil refinery facilities built by the British. The causeway and harbor linked the refinery zone with the port city.
- The map still labels the surrounding territory as “South Arabia”, reflecting Britain’s political project to organize local protectorates into a pro-British federation.
- The dashed line marks the Aden State boundary, separating the colony and protectorate areas.
The timing is extremely significant. By 1967:
- Britain was fighting a growing insurgency known as the Aden Emergency.
- Nationalist groups like the National Liberation Front (NLF) and FLOSY were attacking British forces.
- The recent closure of the Suez Crisis route and Britain’s declining global power made holding Aden increasingly difficult.
Only months after this map was produced, Britain withdrew, and Aden became the capital of the new Marxist-aligned state officially called the People’s Republic of South Yemen, later the People’s Democratic Republic of Yemen. During the Cold War, South Yemen became one of the Soviet Union’s closest allies in the Arab world.
The geography on the map also explains Aden’s importance:
- the natural harbor at Bandar at Tawahi,
- the volcanic defensive terrain around Crater district,
- and its position astride the shipping lanes between Europe and Asia.
Today, Aden is part of unified Yemen, though the city still has major strategic and political importance amid Yemen’s ongoing conflicts.
Also see: Map Of Yemen Created By The CIA
1967 Central Thailand Map
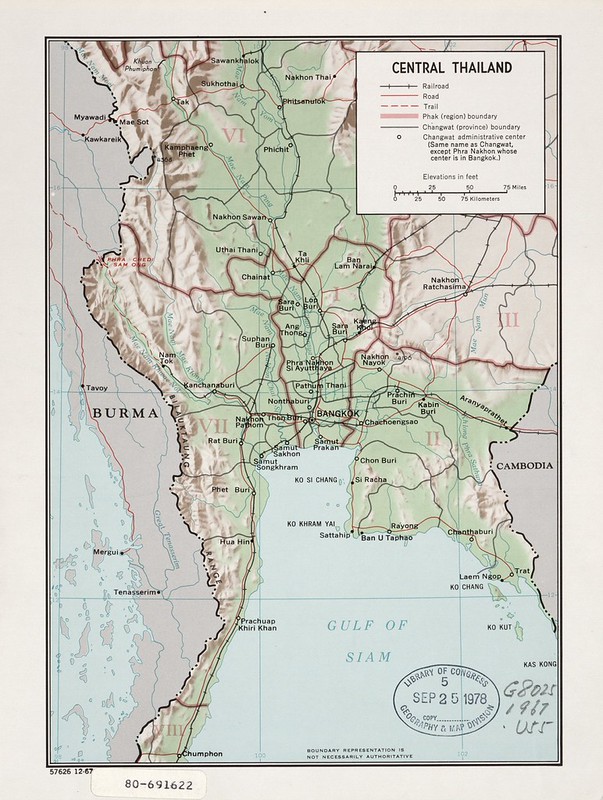
This 1967 map of central Thailand is a Cold War-era strategic and transportation map focused on the country’s political and logistical core around Bangkok.
It shows roads, railroads, provincial boundaries, terrain, and connections to neighboring states like Burma (now Myanmar) and Cambodia.
A few major things stand out:
- Bangkok dominates the map as Thailand’s political, economic, and transportation center. Nearly all major rail and road lines radiate outward from the capital.
- The map highlights the fertile central plains of Thailand, especially around the Chao Phraya River basin. This was the country’s agricultural heartland and main population center.
- The western edge near Burma is mountainous and harder to control, while the eastern side toward Cambodia is flatter and strategically connected to Indochina.
The timing is especially important because Thailand was a major U.S. ally during the Vietnam War. The United States used Thailand as:
- a base for air operations over Vietnam and Laos,
- a logistics hub,
- and a regional anti-communist partner.
Several U.S. airbases existed in Thailand during this period, although not all are marked on this particular map.
Roads and railways shown here were strategically important for moving troops, supplies, and trade throughout mainland Southeast Asia.
The map also still uses older geographic names:
- Burma instead of Myanmar,
- and the Gulf of Siam instead of the more modern “Gulf of Thailand.”
Also see: Map Of Thailand Created By The CIA
1968 Burma Climate Regions Map
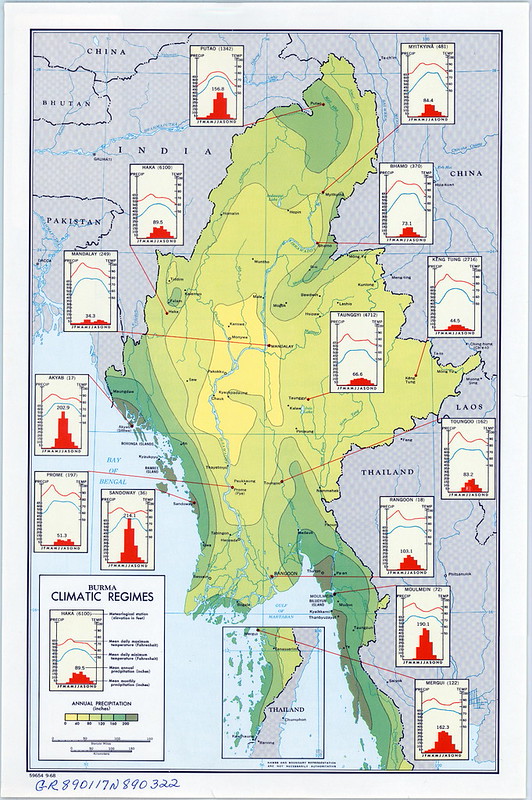
This 1968 climate map of Burma (now Myanmar) is a detailed environmental and geographic study showing how rainfall, temperature, elevation, and monsoon patterns vary across the country.
It was likely designed for strategic, agricultural, transportation, and military planning during the Cold War era.
The map divides Burma into different climatic regions using color shading based mainly on annual precipitation:
- light yellow areas are relatively dry,
- darker green areas receive very heavy rainfall,
- and the coastal and mountain zones are among the wettest places in Asia.
A few major geographic patterns stand out:
- The central Irrawaddy valley, around cities like Mandalay, is comparatively dry. This “Dry Zone” receives far less rainfall because surrounding mountain ranges block monsoon moisture.
- The Bay of Bengal coast and the long southern Tenasserim peninsula receive enormous monsoon rainfall, often over 160–200 inches annually.
- Northern mountain areas near China and the Himalayas are cooler and wetter due to altitude.
The small climate graphs around the map are especially useful. Each shows:
- monthly precipitation (red bars),
- average temperatures,
- and elevation for specific cities such as:
- Rangoon,
- Mandalay,
- Myitkyina,
- and Moulmein.
These charts illustrate the strong monsoon cycle:
- heavy rains from roughly May to October,
- followed by a dry season in winter.
The timing is important politically as well. Burma under General Ne Win had become isolated under the “Burmese Way to Socialism,” while the country faced:
- communist insurgencies,
- ethnic rebellions,
- and difficult transportation problems caused by terrain and climate.
For intelligence agencies, climate maps like this were highly practical because weather shaped:
- road construction,
- military mobility,
- crop production,
- river transport,
- and insurgent activity.
The map also preserves older colonial-era names:
- “Burma” instead of Myanmar,
- “Rangoon” instead of Yangon,
- and “Moulmein” instead of Mawlamyine.
Also see: Map Of Myanmar (Burma) The CIA No Longer Wants You To See
1968 Cambodia Rice Growing Areas & Population Map
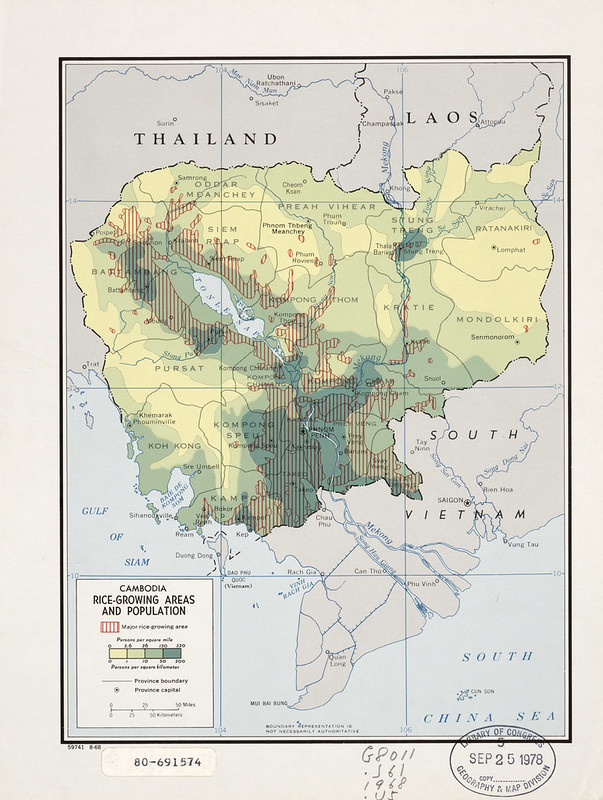
This 1968 map of Cambodia combines two extremely important factors: population density and rice production.
Together, they reveal the economic and political geography of Cambodia just before the country descended into civil war and later the Cambodian genocide.
The red striped zones show the country’s major rice-growing regions, concentrated mainly:
- around the Tonlé Sap basin,
- along the Mekong River,
- and across the fertile southern plains near Phnom Penh.
The green shading shows population density:
- darker green = more densely populated,
- lighter areas = sparsely populated frontier or forest regions.
A few major patterns stand out:
- Cambodia’s population in 1968 was heavily concentrated in the fertile agricultural lowlands.
- The northern and eastern frontier provinces near Laos and Vietnam were much less populated and more forested.
- The rice heartland overlaps closely with the country’s main settlements and transportation routes.
This map is especially important historically because 1968 was a turning point:
- the Vietnam War was spilling into Cambodia,
- North Vietnamese and Viet Cong forces were operating in eastern Cambodia,
- and the Cambodian countryside was becoming politically unstable.
For intelligence analysts, a map like this had strategic value because rice was the foundation of:
- food supply,
- state revenue,
- transportation patterns,
- and rural political control.
Whoever controlled these rice-producing regions controlled much of Cambodia’s economy and population.
The map also captures Cambodia before the massive upheavals of the 1970s:
- the overthrow of Prince Norodom Sihanouk in 1970,
- the U.S. bombing campaigns,
- the Cambodian Civil War,
- and eventually Khmer Rouge rule.
Several names also reflect the era:
- “South Viet Nam” instead of unified Vietnam,
- “Gulf of Siam” rather than Gulf of Thailand,
- and older provincial spellings inherited from French colonial mapping traditions.
In many ways, this is not just an agricultural map, it is a snapshot of Cambodia’s vulnerable political geography on the eve of catastrophe.
Also see: Map Of Cambodia Created By The CIA
1969 East Germany Map
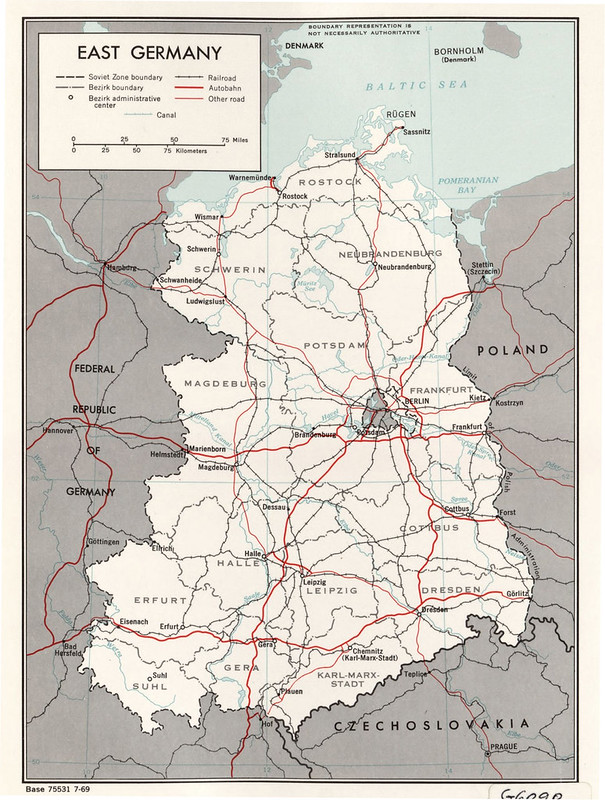
This 1969 map of East Germany, officially the German Democratic Republic (GDR), is a classic Cold War political and transportation map showing the communist half of divided Germany only eight years after the construction of the Berlin Wall.
Several important Cold War realities appear clearly on the map:
- East Germany is surrounded by communist allies:
- Poland,
- Czechoslovakia,
- and the Soviet sphere to the east.
- To the west lies the West Germany, labeled here as the “Federal Republic of Germany.”
The map emphasizes infrastructure:
- railroads,
- autobahns,
- canals,
- and administrative districts (“Bezirke”).
That focus mattered because East Germany was one of the Soviet bloc’s most industrialized and strategically important states. The transportation network connected:
- Soviet military logistics,
- heavy industry,
- ports on the Baltic Sea,
- and the transit corridors to Berlin.
Berlin is the key feature politically. You can see:
- East Berlin inside East Germany,
- but geographically isolated from West Germany.
- The city sits near the center of the map because Berlin remained the symbolic frontline of the Cold War.
The map also reflects post-war territorial changes:
- Germany’s eastern territories beyond the Oder–Neisse line are gone and now part of Poland.
- The city labeled “Stettin (Szczecin)” is shown inside Poland, reflecting the border settlement imposed after World War II.
Another fascinating detail is the city name:
- “Karl-Marx-Stadt” instead of Chemnitz.
East Germany renamed many places to reflect socialist ideology. After German reunification in 1990, the city reverted to the historic name Chemnitz.
By 1969, East Germany was:
- heavily industrialized,
- tightly controlled by the Socialist Unity Party (SED),
- monitored by the Stasi secret police,
- and economically integrated into the Soviet-led Comecon system.
Yet despite the rigid border controls and the Berlin Wall, East Germany remained economically and culturally tied to the broader German world.
That tension, between division and shared identity, defined much of Cold War Germany until reunification in 1990.
The map overall captures East Germany at the height of the Cold War:
- a militarized frontier state,
- a transportation hub of the Soviet bloc,
- and one of the most politically sensitive places on Earth.
Also see: Which Parts Of Europe Are Richer & Poorer Than East Germany In 3 Maps
1960s East/West Berlin Map
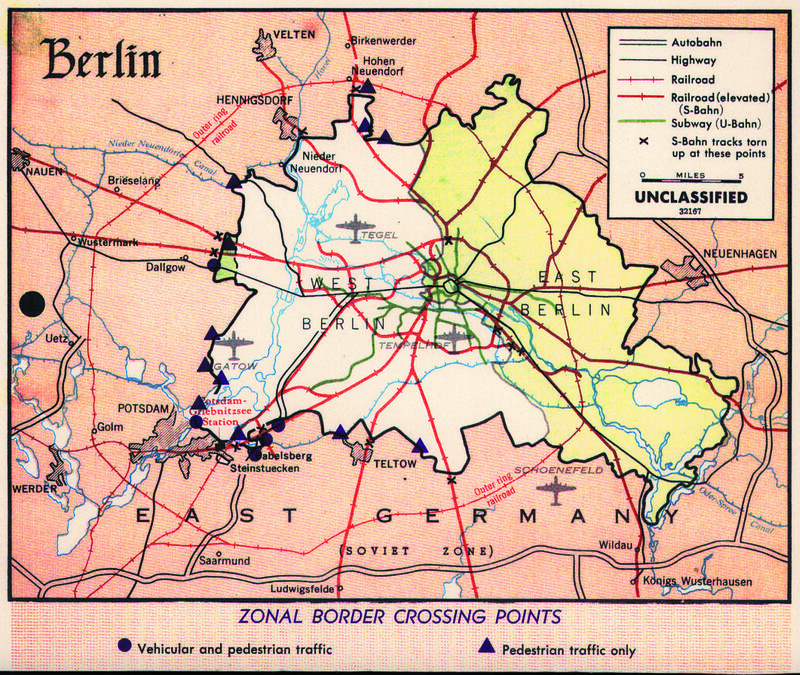
This 1960s map of Berlin shows the division between West Berlin and East Berlin/East Germany during the Cold War after the construction of the Berlin Wall.
The map focuses mainly on:
- the political border between East and West Berlin,
- railroads, highways, autobahns, and subway lines,
- crossing points between the two sides,
- and transportation routes that were cut or restricted by the Wall.
Key features include:
- black circles = vehicle and pedestrian crossing points,
- triangles = pedestrian-only crossings,
- green lines = U-Bahn (subway),
- red rail lines = railroads and S-Bahn lines,
- X marks = rail lines severed by the division.
It also shows:
- West Berlin isolated inside East Germany (“Soviet Zone”),
- airports like Tempelhof, Tegel, Gatow and Schönefeld,
- and the dense transport network that made Berlin strategically vital during the Cold War.
The map is essentially a transportation-and-border control map of divided Berlin at the height of Cold War tensions.
Also see: Something’s Not Quite Right With This East German Public Transit Map
More Declassified CIA Maps
- 22 Declassified CIA Cartography Maps From The 1940s
- 14 Declassified CIA Cartography Maps From The 1950s
- 19 Declassified CIA Cartography Maps From The 1970s
- 12 Declassified CIA Cartography Maps From The 1980s
- 16 Declassified CIA Cartography Maps From The 1990s
- 16 Declassified CIA Cartography Maps From The 2000s
- 15 Declassified CIA Cartography Maps From The 2010s


Leave a Reply