
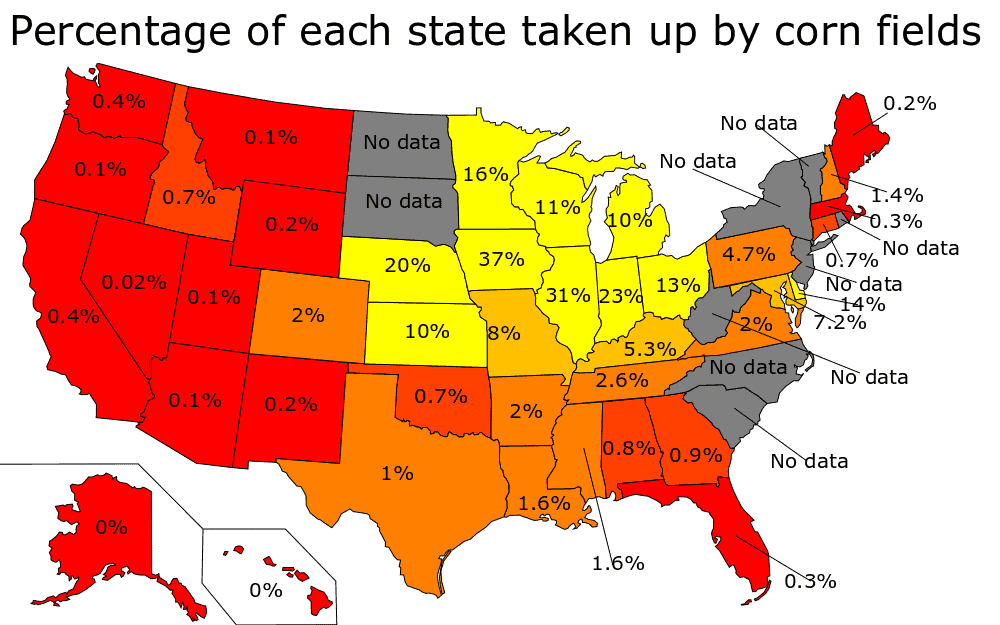
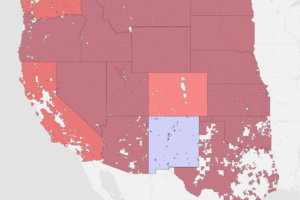
The data comes from the USDA’s Prospective Plantings report. The map above uses preliminary 2023 data.
Here’s the final data:
| State | Area planted (1,000 acres) | Percentage of State |
|---|---|---|
| Iowa | 13,100 | 36.64% |
| Illinois | 11,200 | 31.52% |
| Indiana | 5,450 | 23.77% |
| Nebraska | 9,950 | 20.24% |
| Minnesota | 8,600 | 16.88% |
| Delaware | 175 | 14.03% |
| Ohio | 3,600 | 13.77% |
| South Dakota | 6,300 | 12.98% |
| Wisconsin | 4,000 | 11.54% |
| Kansas | 5,750 | 10.99% |
| North Dakota | 4,050 | 9.17% |
| Missouri | 3,850 | 8.75% |
| Maryland | 480 | 7.73% |
| Michigan | 2,400 | 6.63% |
| Kentucky | 1,600 | 6.33% |
| United States (Contiguous US) | 94,641 | 5.00% |
| Pennsylvania | 1,040 | 3.63% |
| Tennessee | 940 | 3.56% |
| New York | 1,040 | 3.45% |
| North Carolina | 950 | 3.05% |
| Mississippi | 790 | 2.63% |
| Arkansas | 850 | 2.55% |
| Louisiana | 700 | 2.53% |
| Colorado | 1,330 | 2.01% |
| Virginia | 495 | 1.96% |
| South Carolina | 365 | 1.90% |
| New Jersey | 74 | 1.57% |
| Vermont | 89 | 1.51% |
| Texas | 2,500 | 1.50% |
| Georgia | 485 | 1.32% |
| Alabama | 330 | 1.02% |
| Oklahoma | 390 | 0.89% |
| Connecticut | 24 | 0.77% |
| Idaho | 360 | 0.68% |
| California | 400 | 0.40% |
| Washington | 160 | 0.38% |
| Rhode Island | 2 | 0.30% |
| West Virginia | 44 | 0.29% |
| Massachusetts | 14 | 0.28% |
| Florida | 90 | 0.26% |
| New Hampshire | 13 | 0.23% |
| New Mexico | 125 | 0.16% |
| Oregon | 95 | 0.15% |
| Montana | 135 | 0.14% |
| Arizona | 105 | 0.14% |
| Utah | 75 | 0.14% |
| Maine | 28 | 0.14% |
| Wyoming | 85 | 0.14% |
| Nevada | 13 | 0.02% |
Iowa has both the largest area planted and the largest area of the state occupied by corn fields. Whereas Rhode Island has the fewest corn fields, and Nevada has the least relative share of the state devoted to growing corn.
and here’s another version of the map from reddit user Duncana_m published in 2019.
Also see other crops:
Which state surprised you the most?


Leave a Reply