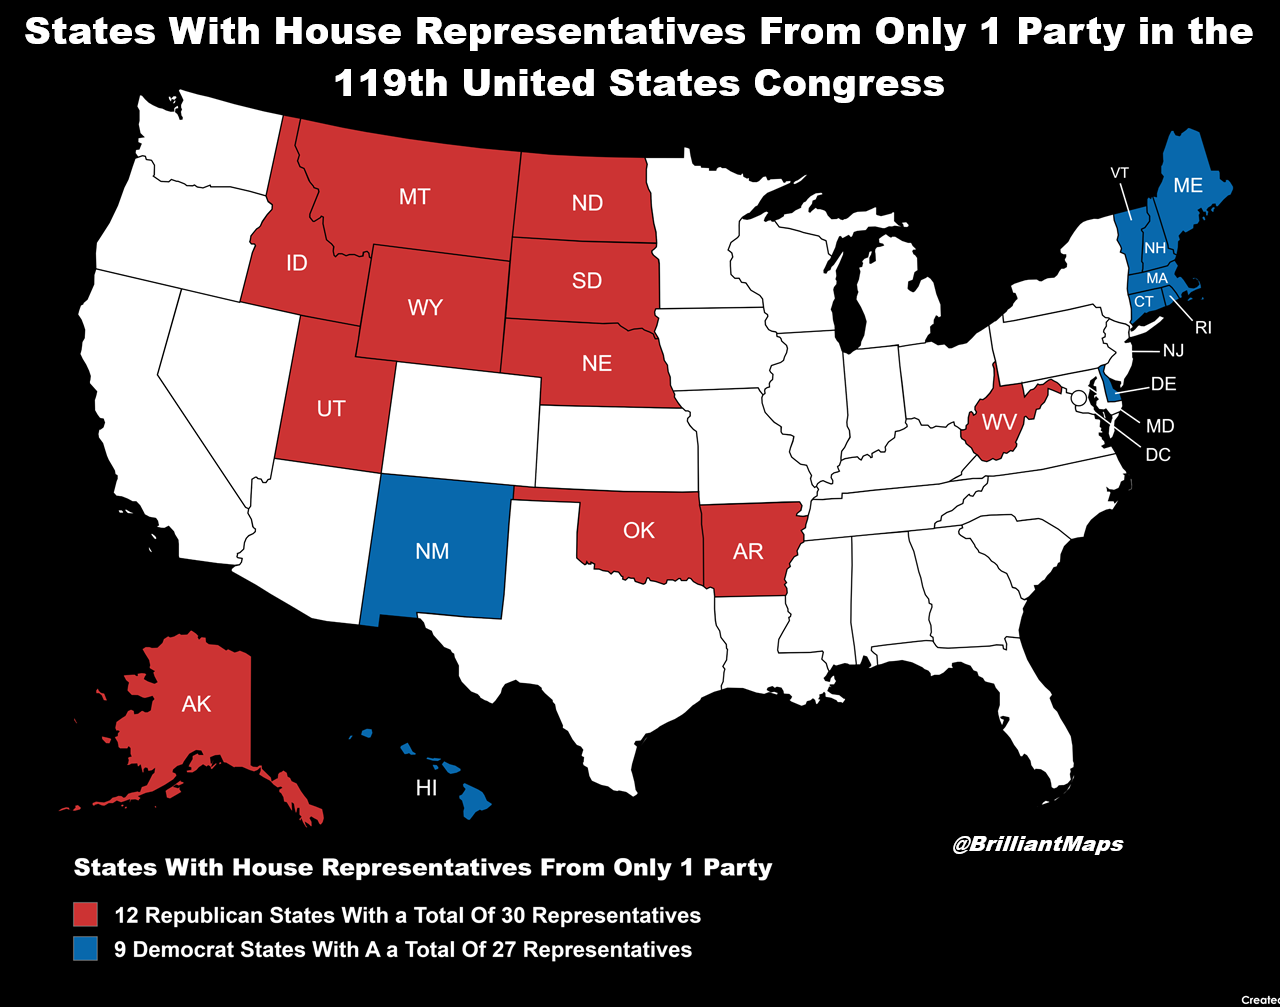
The map above shows which US states have House Representatives from only 1 party as of the 119th Us Congress. Below is a full list of numbers for all states:
The table below shows how many seats each party won in 2024 by state, along with the % share of the seats this represents.
The final numbers takes the share of seats in that state and subtracts the 2024 Presidential vote share from each party. 0% means the number of representatives is fair for each party. The higher (or lower) the number the less fair it is for one party or another.
Take California, as of 2024, 83% of its congressional seats are held by Democrats and just 17% by Republicans. BUT Harris only won 58.47% of the vote compared to Trump’s 38.33%. Which means Democrats have 24.2% more seats than they should and the Republicans have 21.0% fewer seats than they should.
The numbers don’t totally match as 3rd parties get zero representation at any level.
| State | Total Seats | Republican Seats | Democratic Seats | R Seat Share | D Seat Share | Diff R* | Diff D* |
|---|---|---|---|---|---|---|---|
| Alabama | 7 | 5 | 2 | 71% | 29% | 6.9% | -5.5% |
| Alaska | 1 | 1 | 0 | 100% | 0% | 45.5% | -41.4% |
| Arizona | 9 | 6 | 3 | 67% | 33% | 14.4% | -13.4% |
| Arkansas | 4 | 4 | 0 | 100% | 0% | 35.8% | -33.6% |
| California | 52 | 9 | 43 | 17% | 83% | -21.0% | 24.2% |
| Colorado | 8 | 4 | 4 | 50% | 50% | 6.9% | -4.1% |
| Connecticut | 5 | 0 | 5 | 0% | 100% | -41.9% | 43.6% |
| Delaware | 1 | 0 | 1 | 0% | 100% | -41.8% | 43.5% |
| Florida | 28 | 20 | 8 | 71% | 29% | 15.3% | -14.4% |
| Georgia | 14 | 9 | 5 | 64% | 36% | 13.6% | -12.8% |
| Hawaii | 2 | 0 | 2 | 0% | 100% | -37.5% | 39.4% |
| Idaho | 2 | 2 | 0 | 100% | 0% | 33.1% | -30.4% |
| Illinois | 17 | 3 | 14 | 18% | 82% | -25.8% | 28.0% |
| Indiana | 9 | 7 | 2 | 78% | 22% | 19.2% | -17.4% |
| Iowa | 4 | 4 | 0 | 100% | 0% | 44.3% | -42.5% |
| Kansas | 4 | 3 | 1 | 75% | 25% | 17.8% | -16.0% |
| Kentucky | 6 | 5 | 1 | 83% | 17% | 18.9% | -17.3% |
| Louisiana | 6 | 4 | 2 | 67% | 33% | 6.4% | -4.9% |
| Maine | 2 | 0 | 2 | 0% | 100% | -45.5% | 47.6% |
| Maryland | 8 | 1 | 7 | 13% | 88% | -21.6% | 24.9% |
| Massachusetts | 9 | 0 | 9 | 0% | 100% | -36.0% | 38.8% |
| Michigan | 13 | 7 | 6 | 54% | 46% | 4.1% | -2.2% |
| Minnesota | 8 | 4 | 4 | 50% | 50% | 3.3% | -0.9% |
| Mississippi | 4 | 3 | 1 | 75% | 25% | 14.1% | -13.0% |
| Missouri | 8 | 6 | 2 | 75% | 25% | 16.5% | -15.1% |
| Montana | 2 | 2 | 0 | 100% | 0% | 41.6% | -38.5% |
| Nebraska | 3 | 3 | 0 | 100% | 0% | 40.7% | -38.9% |
| Nevada | 4 | 1 | 3 | 25% | 75% | -25.6% | 27.5% |
| New Hampshire | 2 | 0 | 2 | 0% | 100% | -47.9% | 49.4% |
| New Jersey | 12 | 3 | 9 | 25% | 75% | -21.1% | 23.0% |
| New Mexico | 3 | 0 | 3 | 0% | 100% | -45.9% | 48.2% |
| New York | 26 | 7 | 19 | 27% | 73% | -16.4% | 17.2% |
| North Carolina | 14 | 10 | 4 | 71% | 29% | 20.6% | -19.1% |
| North Dakota | 1 | 1 | 0 | 100% | 0% | 33.0% | -30.5% |
| Ohio | 15 | 10 | 5 | 67% | 33% | 11.5% | -10.6% |
| Oklahoma | 5 | 5 | 0 | 100% | 0% | 33.8% | -31.9% |
| Oregon | 6 | 1 | 5 | 17% | 83% | -24.3% | 28.1% |
| Pennsylvania | 17 | 10 | 7 | 59% | 41% | 8.5% | -7.5% |
| Rhode Island | 2 | 0 | 2 | 0% | 100% | -41.8% | 44.5% |
| South Carolina | 7 | 6 | 1 | 86% | 14% | 27.5% | -26.1% |
| South Dakota | 1 | 1 | 0 | 100% | 0% | 36.6% | -34.2% |
| Tennessee | 9 | 8 | 1 | 89% | 11% | 24.7% | -23.4% |
| Texas | 38 | 25 | 13 | 66% | 34% | 9.6% | -8.2% |
| Utah | 4 | 4 | 0 | 100% | 0% | 40.6% | -37.8% |
| Vermont | 1 | 0 | 1 | 0% | 100% | -32.3% | 36.2% |
| Virginia | 11 | 5 | 6 | 45% | 55% | -0.6% | 2.7% |
| Washington | 10 | 2 | 8 | 20% | 80% | -19.0% | 22.8% |
| West Virginia | 2 | 2 | 0 | 100% | 0% | 30.0% | -28.1% |
| Wisconsin | 8 | 6 | 2 | 75% | 25% | 25.4% | -23.7% |
| Wyoming | 1 | 1 | 0 | 100% | 0% | 28.4% | -25.8% |
| Total | 435 | 220 | 215 | 51% | 49% | 0.8% | 1.1% |
And after doing the above, I’ve decided to update how many seats party party should have won compared to how many it did win:
| State | R Steats Based On Vote Share | D Seats Based On Vote Share | R Seats In Theory - Actual Seats | D Seats In Theory - Actual Seats |
|---|---|---|---|---|
| Alabama | 5 | 2 | 0 | 0 |
| Alaska | 1 | 0 | 0 | 0 |
| Arizona | 5 | 4 | -1 | 1 |
| Arkansas | 3 | 1 | -1 | 1 |
| California | 20 | 30 | 11 | -13 |
| Colorado | 3 | 4 | -1 | 0 |
| Connecticut | 2 | 3 | 2 | -2 |
| Delaware | 0 | 1 | 0 | 0 |
| Florida | 16 | 12 | -4 | 4 |
| Georgia | 7 | 7 | -2 | 2 |
| Hawaii | 1 | 1 | 1 | -1 |
| Idaho | 1 | 1 | -1 | 1 |
| Illinois | 7 | 9 | 4 | -5 |
| Indiana | 5 | 4 | -2 | 2 |
| Iowa | 2 | 2 | -2 | 2 |
| Kansas | 2 | 2 | -1 | 1 |
| Kentucky | 4 | 2 | -1 | 1 |
| Louisiana | 4 | 2 | 0 | 0 |
| Maine | 1 | 1 | 1 | -1 |
| Maryland | 3 | 5 | 2 | -2 |
| Massachusetts | 3 | 6 | 3 | -3 |
| Michigan | 6 | 6 | -1 | 0 |
| Minnesota | 4 | 4 | 0 | 0 |
| Mississippi | 2 | 2 | -1 | 1 |
| Missouri | 5 | 3 | -1 | 1 |
| Montana | 1 | 1 | -1 | 1 |
| Nebraska | 2 | 1 | -1 | 1 |
| Nevada | 2 | 2 | 1 | -1 |
| New Hampshire | 1 | 1 | 1 | -1 |
| New Jersey | 6 | 6 | 3 | -3 |
| New Mexico | 1 | 2 | 1 | -1 |
| New York | 11 | 15 | 4 | -4 |
| North Carolina | 7 | 7 | -3 | 3 |
| North Dakota | 1 | 0 | 0 | 0 |
| Ohio | 8 | 7 | -2 | 2 |
| Oklahoma | 3 | 2 | -2 | 2 |
| Oregon | 2 | 3 | 1 | -2 |
| Pennsylvania | 9 | 8 | -1 | 1 |
| Rhode Island | 1 | 1 | 1 | -1 |
| South Carolina | 4 | 3 | -2 | 2 |
| South Dakota | 1 | 0 | 0 | 0 |
| Tennessee | 6 | 3 | -2 | 2 |
| Texas | 21 | 16 | -4 | 3 |
| Utah | 2 | 2 | -2 | 2 |
| Vermont | 0 | 1 | 0 | 0 |
| Virginia | 5 | 6 | 0 | 0 |
| Washington | 4 | 6 | 2 | -2 |
| West Virginia | 1 | 1 | -1 | 1 |
| Wisconsin | 4 | 4 | -2 | 2 |
| Wyoming | 1 | 0 | 0 | 0 |
| Total | 217 | 210 | -3 | -5 |
Note, that a negative number means it has that many more seats than it should and a positive number means it should have this many more. Also, due to rounding and third party candidates the seat totals don’t totally match actual totals for all states.
Florida & Texas are the most Republican overrepresented with 4 each house seats in each, and this is before any gerrymandering in either state comes into effect.
Conversely, California is by far the most Democratic overrepresentation with 13 extra seats going to the Democrats there than the vote total would suggest.
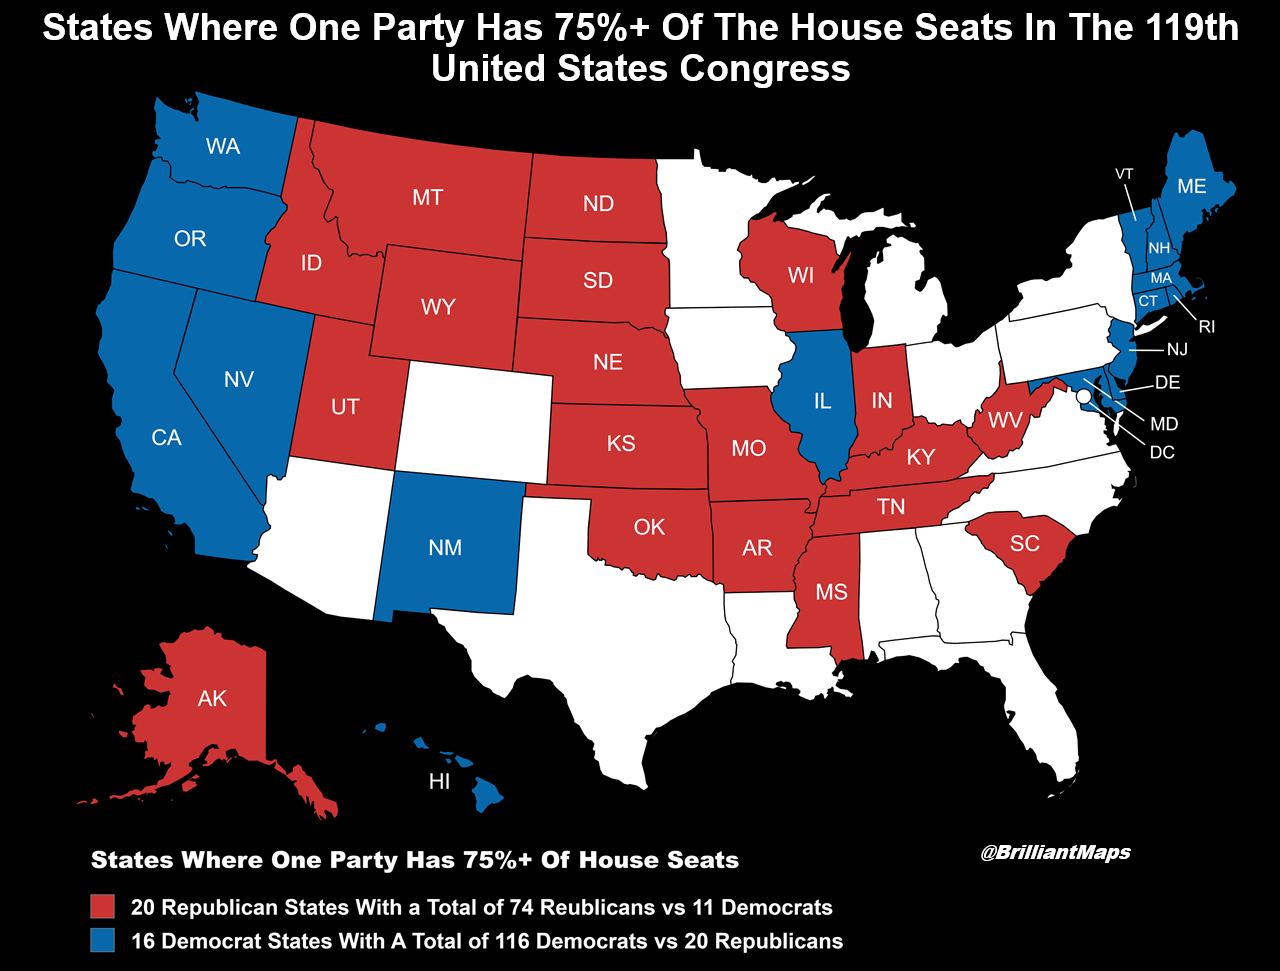
And finally another map showing where 1 party has more than 75% of all seats.


Leave a Reply