
The map above shows the number Admissions of Permanent Residents by Country of Citizenship to Canada between 2015 and 2025. Data comes from the Immigration, Refugees and Citizenship Canada (IRCC) monthly updates.
Here’s the full total for each country below (my numbers are full year to the end of 2025 which is why India is slightly higher):
| Country of Citizenship | Total |
|---|---|
| Afghanistan | 90,855 |
| Albania | 6,100 |
| Algeria | 48,285 |
| Andorra | - |
| Angola | 1,275 |
| Antigua and Barbuda | 905 |
| Argentina | 3,625 |
| Armenia | 2,270 |
| Australia | 16,865 |
| Austria | 1,075 |
| Azerbaijan | 2,665 |
| Azores | - |
| Bahama Islands, The | 2,475 |
| Bahrain | 310 |
| Bangladesh | 37,725 |
| Barbados | 2,185 |
| Belarus | 2,535 |
| Belgium | 5,280 |
| Belize | 690 |
| Benin, Republic of | 5,300 |
| Bermuda | - |
| Bhutan | 805 |
| Bolivia | 1,400 |
| Bosnia-Herzegovina | 1,105 |
| Botswana, Republic of | 560 |
| Brazil | 56,230 |
| Brunei | 45 |
| Bulgaria | 2,095 |
| Burkina-Faso | 3,990 |
| Burundi | 12,230 |
| Cambodia | 2,065 |
| Cameroon, Federal Republic of | 77,875 |
| Cape Verde Islands | 25 |
| Central African Republic | 3,480 |
| Chad, Republic of | 2,110 |
| Chile | 5,760 |
| China, People's Republic of | 298,715 |
| Colombia | 40,760 |
| Comoros | 140 |
| Congo, Democratic Republic of the | 31,095 |
| Congo, People's Republic of the | 2,280 |
| Costa Rica | 1,955 |
| Croatia | 3,655 |
| Cuba | 9,005 |
| Curacao | - |
| Cyprus | 175 |
| Czech Republic | 2,985 |
| Denmark | 850 |
| Djibouti, Republic of | 2,700 |
| Dominica | 430 |
| Dominican Republic | 7,810 |
| East Timor, Democratic Republic of | - |
| Ecuador | 4,535 |
| Egypt | 31,980 |
| El Salvador | 7,025 |
| Equatorial Guinea, Republic of | 25 |
| Eritrea | 79,585 |
| Estonia | 345 |
| Ethiopia | 28,115 |
| Fiji | 1,415 |
| Finland | 995 |
| France | 93,430 |
| French Polynesia | - |
| Gabon Republic | 810 |
| Gambia | 785 |
| Georgia | 1,970 |
| Germany | 12,330 |
| Ghana | 11,350 |
| Greece | 3,790 |
| Grenada | 1,030 |
| Guadeloupe | - |
| Guatemala | 2,755 |
| Guinea, Republic of | 4,735 |
| Guinea-Bissau | 40 |
| Guyana | 4,600 |
| Haiti | 33,370 |
| Holy See | - |
| Honduras | 4,195 |
| Hong Kong SAR | 25,050 |
| Hungary | 6,175 |
| Iceland | 230 |
| India | 941,220 |
| Indonesia, Republic of | 5,185 |
| Iran | 89,905 |
| Iraq | 34,920 |
| Ireland, Republic of | 17,065 |
| Israel | 14,740 |
| Italy | 11,795 |
| Ivory Coast, Republic of | 22,180 |
| Jamaica | 40,015 |
| Japan | 10,730 |
| Jordan | 10,860 |
| Kazakhstan | 4,205 |
| Kenya | 7,780 |
| Kiribati | - |
| Korea, People's Democratic Republic of | 80 |
| Korea, Republic of | 51,970 |
| Kosovo, Republic of | 1,785 |
| Kuwait | 300 |
| Kyrgyzstan | 1,355 |
| Laos | 205 |
| Latvia | 905 |
| Lebanon | 27,170 |
| Lesotho | 45 |
| Liberia | 985 |
| Libya | 5,160 |
| Liechtenstein | - |
| Lithuania | 1,175 |
| Luxembourg | 115 |
| Macau SAR | 255 |
| Macedonia | 1,010 |
| Madagascar | 3,145 |
| Malawi | 330 |
| Malaysia | 3,780 |
| Maldives, Republic of | 20 |
| Mali, Republic of | 3,525 |
| Malta | 90 |
| Marshall Islands, Republic of the | - |
| Mauritania | 965 |
| Mauritius | 9,975 |
| Mexico | 46,875 |
| Micronesia, Federated States of | - |
| Moldova | 4,440 |
| Monaco | - |
| Mongolia, People's Republic of | 1,060 |
| Montenegro, Republic of | 195 |
| Morocco | 46,170 |
| Mozambique | 95 |
| Myanmar (Burma) | 2,635 |
| Namibia | 915 |
| Nauru | - |
| Nepal | 14,995 |
| Netherlands Antilles, The | - |
| Netherlands, The | 4,945 |
| Nevis | - |
| New Caledonia | - |
| New Zealand | 4,960 |
| Nicaragua | 2,125 |
| Niger, Republic of the | 915 |
| Nigeria | 135,755 |
| Northern Mariana Islands, Commonwealth of the | - |
| Norway | 720 |
| Oman | 105 |
| Other | 175 |
| Pakistan | 109,605 |
| Palau, Republic of | - |
| Palestinian Authority (Gaza/West Bank) | 6,335 |
| Panama, Republic of | 740 |
| Papua New Guinea | 25 |
| Paraguay | 575 |
| Peru | 6,735 |
| Philippines | 332,055 |
| Poland | 7,620 |
| Portugal | 8,660 |
| Puerto Rico | - |
| Qatar | 10 |
| Reunion | - |
| Romania | 7,560 |
| Russia | 20,935 |
| Rwanda | 7,470 |
| Samoa, American | - |
| Samoa, Independent State of | 5 |
| San Marino | - |
| Sao Tome and Principe | - |
| Saudi Arabia | 2,620 |
| Senegal | 8,145 |
| Serbia, Republic of | 4,150 |
| Seychelles | 30 |
| Sierra Leone | 775 |
| Singapore | 2,870 |
| Sint-Maarten | - |
| Slovak Republic | 2,590 |
| Slovenia | 355 |
| Solomon Islands | 45 |
| Somalia, Democratic Republic of | 31,130 |
| South Africa, Republic of | 16,435 |
| South Sudan, Republic of | 2,880 |
| Spain | 7,010 |
| Sri Lanka | 25,350 |
| St. Kitts-Nevis | 375 |
| St. Lucia | 2,750 |
| St. Vincent and the Grenadines | 3,285 |
| Stateless | 12,745 |
| Sudan, Democratic Republic of | 15,990 |
| Surinam | 100 |
| Swaziland | 215 |
| Sweden | 2,165 |
| Switzerland | 2,360 |
| Syria | 119,460 |
| Taiwan | 10,155 |
| Tajikistan | 480 |
| Tanzania, United Republic of | 2,310 |
| Thailand | 5,155 |
| Togo, Republic of | 5,510 |
| Tonga | 5 |
| Trinidad and Tobago, Republic of | 4,835 |
| Tunisia | 31,105 |
| Turkey | 23,390 |
| Turkmenistan | 225 |
| Turks and Caicos Islands | - |
| Tuvalu | - |
| Uganda | 5,170 |
| Ukraine | 41,825 |
| United Arab Emirates | 160 |
| United Kingdom and Overseas Territories | 54,700 |
| United States of America | 103,195 |
| Uruguay | 550 |
| Uzbekistan | 1,725 |
| Vanuatu | - |
| Venezuela | 17,175 |
| Vietnam | 45,985 |
| Virgin Islands, British | - |
| Western Sahara | - |
| Yemen | 6,600 |
| Zambia | 830 |
| Zimbabwe | 5,270 |
| Country not stated | - |
| Total | 3,894,285 |
And here’s a map and table showing the distribution by province:
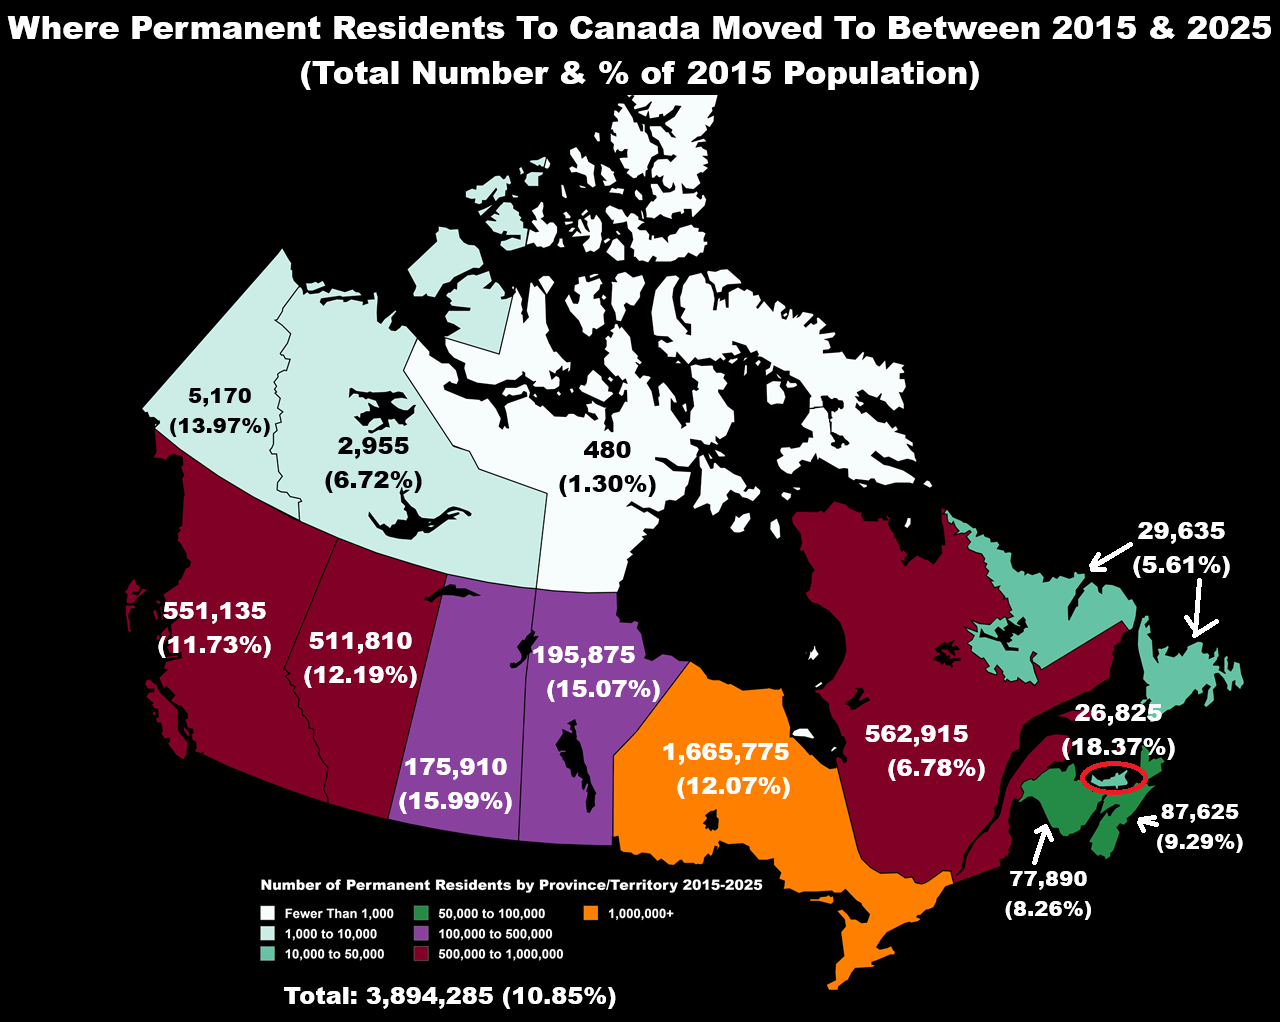
| Province/Territory | Total | % of 2015 Population |
|---|---|---|
| Newfoundland and Labrador | 29,635 | 5.61% |
| Prince Edward Island | 26,825 | 18.37% |
| Nova Scotia | 87,625 | 9.29% |
| New Brunswick | 77,890 | 8.26% |
| Quebec | 562,915 | 6.78% |
| Ontario | 1,665,775 | 12.07% |
| Manitoba | 195,875 | 15.07% |
| Saskatchewan | 175,910 | 15.99% |
| Alberta | 511,810 | 12.19% |
| British Columbia | 551,135 | 11.73% |
| Yukon | 5,170 | 13.97% |
| Northwest Territories | 2,955 | 6.72% |
| Nunavut | 480 | 1.30% |
| Total | 3,894,285 | 10.85% |
Which surprised you the most?


Leave a Reply