
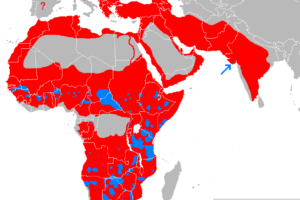
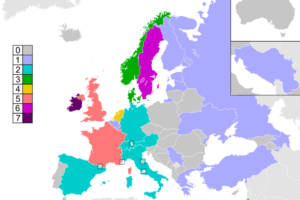
The map above shows how much GDP is created by every hour worked in a country measured in constant 2021 International $ at PPP.
Basically, this means it shows how much economic output a typical worker is producing in economy relative to the cost of living in that country. Or to put another way how productive an economy is.
The data comes from the International Labour Organization (ILO) and is their estimate for 2025.
Luxembourg produces by far the most at $166.08 per hour, more than double that of the United States at $81.80.
It’s also interesting to note that in pure GDP per capita terms the US is the 7th richest country in the world, but when you factor in the number of hours worked it falls to 14th place, just behind France.
Here’s the full list of data for 2025.
| Country | GDP Per Hour Worked (In International PPP $) |
|---|---|
| Luxembourg | $166.08 |
| Ireland | $139.12 |
| Norway | $123.63 |
| Guyana | $113.89 |
| Denmark | $96.97 |
| Singapore | $96.88 |
| Macao, China | $92.00 |
| Belgium | $91.63 |
| Netherlands | $90.44 |
| Austria | $90.12 |
| Sweden | $85.73 |
| Switzerland | $85.43 |
| Western Europe | $83.60 |
| France | $82.21 |
| United States of America | $81.80 |
| Finland | $81.31 |
| Germany | $80.48 |
| Northern America | $80.34 |
| Northern America: High income | $80.34 |
| Northern Europe | $78.04 |
| Northern, Southern and Western Europe: High income | $77.46 |
| Americas: High income | $77.18 |
| Northern, Southern and Western Europe | $75.56 |
| G7 | $74.92 |
| New Caledonia | $74.88 |
| Italy | $74.36 |
| South-Eastern Asia and the Pacific: High income | $72.64 |
| European Union 27 | $71.32 |
| Brunei Darussalam | $71.30 |
| European Union 28 | $71.07 |
| Channel Islands | $70.75 |
| United States Virgin Islands | $70.27 |
| Guam | $70.00 |
| United Kingdom of Great Britain and Northern Ireland | $69.49 |
| Australia | $69.19 |
| Spain | $67.88 |
| Iceland | $67.43 |
| Taiwan, China | $67.41 |
| Malta | $67.15 |
| Canada | $66.95 |
| World: High income | $66.37 |
| Europe and Central Asia: High income | $64.94 |
| Puerto Rico | $63.57 |
| Hong Kong, China | $63.25 |
| Southern Europe | $62.86 |
| Israel | $60.81 |
| Slovenia | $60.14 |
| Croatia | $58.05 |
| Asia and the Pacific: High income | $57.67 |
| Central and Western Asia: High income | $57.65 |
| Czechia | $56.88 |
| Qatar | $56.76 |
| Saudi Arabia | $56.58 |
| French Polynesia | $55.70 |
| Europe and Central Asia | $55.20 |
| Eastern Asia: High income | $54.80 |
| Lithuania | $54.71 |
| Portugal | $54.42 |
| Japan | $53.74 |
| Estonia | $52.41 |
| Romania | $52.13 |
| Pacific Islands | $51.28 |
| New Zealand | $50.42 |
| Republic of Korea | $49.59 |
| Greece | $49.45 |
| Poland | $48.75 |
| Arab States: High income | $48.61 |
| Bahrain | $48.03 |
| Slovakia | $47.56 |
| Hungary | $46.65 |
| Eastern Europe: High income | $46.06 |
| Latvia | $45.67 |
| Russian Federation | $44.31 |
| United Arab Emirates | $43.01 |
| Panama | $42.88 |
| Americas | $42.71 |
| Eastern Europe | $42.13 |
| Türkiye | $40.18 |
| Western Asia | $39.91 |
| Latin America and the Caribbean: High income | $39.32 |
| Kazakhstan | $39.28 |
| Cyprus | $38.34 |
| Uruguay | $38.13 |
| Central and Western Asia: Upper-middle income | $38.02 |
| Montenegro | $37.49 |
| Arab States | $37.49 |
| Bulgaria | $36.22 |
| Iraq | $36.07 |
| Gabon | $34.92 |
| Chile | $34.19 |
| North Macedonia | $33.56 |
| Argentina | $33.39 |
| Europe and Central Asia: Upper-middle income | $33.19 |
| Central and Western Asia | $32.86 |
| Oman | $32.84 |
| Mauritius | $32.83 |
| Bahamas | $32.72 |
| Trinidad and Tobago | $32.22 |
| Turkmenistan | $31.57 |
| Belarus | $31.45 |
| Kuwait | $31.40 |
| Malaysia | $30.43 |
| Costa Rica | $30.30 |
| Libya | $29.84 |
| Georgia | $29.34 |
| APEC | $29.32 |
| Serbia | $28.80 |
| Northern Africa: Upper-middle income | $28.43 |
| World excluding India and China | $28.27 |
| Algeria | $28.18 |
| World excluding BRICS | $28.11 |
| MENA | $27.74 |
| Dominican Republic | $27.60 |
| Arab League | $27.46 |
| Northern, Southern and Western Europe: Upper-middle income | $27.24 |
| Egypt | $27.05 |
| Djibouti | $26.55 |
| Azerbaijan | $26.48 |
| Bosnia and Herzegovina | $26.47 |
| Iran (Islamic Republic of) | $26.20 |
| Southern Asia: Upper-middle income | $26.15 |
| Armenia | $25.64 |
| Suriname | $25.32 |
| Eswatini | $24.95 |
| Cuba | $24.72 |
| Africa: Upper-middle income | $24.53 |
| G20 | $24.46 |
| Botswana | $23.79 |
| Northern Africa: Lower-middle income | $23.20 |
| Saint Lucia | $23.19 |
| World | $23.11 |
| Eastern Asia | $22.93 |
| Mexico | $22.43 |
| World: Upper-middle income excluding China | $22.38 |
| Sub-Saharan Africa: Upper-middle income | $22.04 |
| Brazil | $22.01 |
| Saint Vincent and the Grenadines | $21.85 |
| Central Asia | $21.70 |
| South Africa | $21.64 |
| Eastern Europe: Upper-middle income | $21.56 |
| South America | $21.46 |
| Barbados | $21.31 |
| Latin America and the Caribbean | $21.26 |
| Americas: Upper-middle income | $21.25 |
| Latin America and the Caribbean: Upper-middle income | $21.25 |
| Caribbean | $21.24 |
| Northern Africa | $21.04 |
| World: Upper-middle income | $20.88 |
| Central America | $20.82 |
| Southern Africa | $20.75 |
| Maldives | $20.57 |
| China | $19.77 |
| Eastern Asia: Upper-middle income | $19.77 |
| Mongolia | $19.59 |
| Asia and the Pacific: Upper-middle income | $19.58 |
| Albania | $19.50 |
| Fiji | $19.34 |
| Tunisia | $19.22 |
| Colombia | $18.92 |
| Equatorial Guinea | $18.85 |
| Thailand | $18.46 |
| Sri Lanka | $17.99 |
| Jordan | $17.88 |
| South-Eastern Asia and the Pacific: Upper-middle income | $17.81 |
| South-Eastern Asia and the Pacific | $17.43 |
| BRICS | $17.24 |
| Asia and the Pacific | $16.99 |
| Sao Tome and Principe | $16.63 |
| Paraguay | $16.44 |
| Arab States: Lower-middle income | $15.93 |
| Ecuador | $15.82 |
| Venezuela (Bolivarian Republic of) | $15.72 |
| Indonesia | $15.70 |
| Namibia | $15.64 |
| ASEAN | $15.63 |
| South-Eastern Asia | $15.62 |
| Mauritania | $15.14 |
| Guatemala | $14.70 |
| Belize | $14.68 |
| Tonga | $14.04 |
| Morocco | $13.72 |
| Peru | $13.31 |
| CARICOM | $12.83 |
| Republic of Moldova | $12.74 |
| Uzbekistan | $12.67 |
| Viet Nam | $12.42 |
| Samoa | $12.30 |
| Philippines | $12.05 |
| Yemen | $12.04 |
| El Salvador | $12.01 |
| Europe and Central Asia: Lower-middle income | $11.71 |
| Central and Western Asia: Lower-middle income | $11.71 |
| Bhutan | $11.43 |
| Cabo Verde | $11.35 |
| Ghana | $10.84 |
| India | $10.68 |
| Southern Asia | $10.64 |
| South-Eastern Asia and the Pacific: Lower-middle income | $10.39 |
| Asia and the Pacific: Lower-middle income | $10.20 |
| Southern Asia: Lower-middle income | $10.17 |
| World: Lower-middle income | $9.98 |
| Nepal | $9.77 |
| Arab States: Low income | $9.72 |
| Tajikistan | $9.71 |
| Angola | $9.49 |
| Timor-Leste | $9.44 |
| Nicaragua | $9.35 |
| Bolivia (Plurinational State of) | $9.34 |
| World: Lower-middle income excluding India | $9.32 |
| Africa: Lower-middle income | $9.19 |
| Jamaica | $8.94 |
| Lao People's Democratic Republic | $8.87 |
| Kyrgyzstan | $8.84 |
| Bangladesh | $8.72 |
| Côte d'Ivoire | $8.59 |
| Honduras | $8.05 |
| Africa | $8.03 |
| Western Sahara | $7.72 |
| Syrian Arab Republic | $7.59 |
| Congo | $7.57 |
| Americas: Lower-middle income | $7.51 |
| Latin America and the Caribbean: Lower-middle income | $7.51 |
| Kenya | $7.39 |
| Pakistan | $7.20 |
| Guinea | $6.82 |
| Senegal | $6.73 |
| Somalia | $6.39 |
| Sub-Saharan Africa: Lower-middle income | $6.28 |
| Cameroon | $6.23 |
| Afghanistan | $6.16 |
| Papua New Guinea | $6.09 |
| Comoros | $6.02 |
| Rwanda | $6.00 |
| Gambia | $5.97 |
| Vanuatu | $5.92 |
| Myanmar | $5.80 |
| Nigeria | $5.80 |
| Sub-Saharan Africa | $5.80 |
| Western Africa | $5.78 |
| Zambia | $5.23 |
| Central Africa | $5.21 |
| Ethiopia | $4.70 |
| Zimbabwe | $4.50 |
| Togo | $4.33 |
| Burkina Faso | $4.30 |
| Eastern Africa | $4.21 |
| Benin | $4.16 |
| Cambodia | $3.98 |
| Tanzania, United Republic of | $3.70 |
| World: Low income | $3.44 |
| Haiti | $3.39 |
| Chad | $3.29 |
| Africa: Low income | $3.24 |
| Uganda | $3.20 |
| Sub-Saharan Africa: Low income | $3.20 |
| Lesotho | $3.19 |
| Guinea-Bissau | $3.06 |
| Mali | $2.99 |
| Asia and the Pacific: Low income | $2.79 |
| Eritrea | $2.78 |
| Malawi | $2.77 |
| Sierra Leone | $2.63 |
| Solomon Islands | $2.62 |
| Mozambique | $2.43 |
| Congo, Democratic Republic of the | $2.41 |
| Niger | $2.34 |
| Madagascar | $1.89 |
| Central African Republic | $1.57 |
| Liberia | $1.53 |
| Korea (the Democratic People's Republic of) | $1.37 |
| Burundi | $0.90 |
A more detailed explanation on the metrics being used here.
GDP Per Hour Worked
This measures how much economic output (GDP) is produced for every hour of labour.
Instead of just looking at GDP per person or per worker, this zooms in on productivity per hour, which gives a clearer sense of how efficiently labour is being used.
GDP (Gross Domestic Product)
GDP is the total value of all goods and services produced in a country within a year.
Per Hour Worked
Rather than looking at GDP per worker (which could be misleading if some people work part-time or more likely long hours), this metric divides total GDP by the total number of hours worked across the economy.
This tells us how much output is generated for each hour of labor.
In Constant 2021 International $
- Constant means they adjust for inflation — so they’re using 2021 prices to keep the value of money stable over time.
- This avoids the problem of comparing dollars from different years where the value of money changes.
At PPP (Purchasing Power Parity)
PPP adjusts for differences in cost of living and price levels between countries.
$1 in the U.S. might buy you more or less than $1 in India — PPP makes these adjustments so you can compare output between countries fairly.
Putting It All Together
GDP Per Hour Worked (In Constant 2021 International $ at PPP) tells you:
How much real economic output (adjusted for inflation and cost of living differences) is produced, on average, for each hour of labour in a country.
Why It Matters:
- A high GDP per hour worked = high labor productivity.
- It shows how efficiently a country turns labor into goods and services, regardless of how many hours people work.
- Useful for comparing productivity across countries without being skewed by differences in wages, prices, or work hours.
Which country surpised you the most?


Leave a Reply