
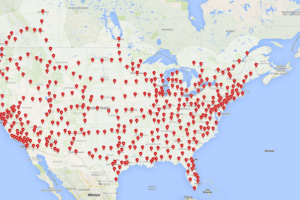
The map above shows which has more searches Tesla or the Ford F-150.
It’s based on Google Trends data for the last 12 months.
Now, you may think it’s a bit unfair to compare searches for all of Tesla’s cars with searches for just the F-150, and you’d be right.
However, the sales figures between them are probably smaller than you might think.
In 2024, the Ford F-150 actually lost the top spot as America’s best selling vehicle to the Toyota Rav4. However, they still sold 460,915 of them, a 5% decline on 2023.
As for Tesla, sales for all models tumbled 23% in 2024 compared to just 516,597 vehicles.
Here’s the data for each state:
| State | Tesla Share of Searches | Ford F-150 Share of Searches | Difference (Postive more Tesla, Negative more F-150) |
|---|---|---|---|
| District of Columbia | 89% | 11% | 78% |
| California | 84% | 16% | 68% |
| New Jersey | 80% | 20% | 60% |
| Nevada | 78% | 22% | 56% |
| Hawaii | 77% | 23% | 54% |
| Massachusetts | 75% | 25% | 50% |
| New York | 73% | 27% | 46% |
| Washington | 72% | 28% | 44% |
| Maryland | 71% | 29% | 42% |
| Connecticut | 70% | 30% | 40% |
| Rhode Island | 67% | 33% | 34% |
| Illinois | 66% | 34% | 32% |
| Florida | 65% | 35% | 30% |
| Delaware | 65% | 35% | 30% |
| Virginia | 63% | 37% | 26% |
| Oregon | 62% | 38% | 24% |
| Arizona | 61% | 39% | 22% |
| Pennsylvania | 59% | 41% | 18% |
| Utah | 58% | 42% | 16% |
| Colorado | 58% | 42% | 16% |
| New Hampshire | 57% | 43% | 14% |
| Georgia | 55% | 45% | 10% |
| Vermont | 55% | 45% | 10% |
| North Carolina | 53% | 47% | 6% |
| Ohio | 53% | 47% | 6% |
| Minnesota | 51% | 49% | 2% |
| Texas | 50% | 50% | 0% |
| Indiana | 48% | 52% | -4% |
| Wisconsin | 46% | 54% | -8% |
| Michigan | 45% | 55% | -10% |
| Missouri | 44% | 56% | -12% |
| South Carolina | 44% | 56% | -12% |
| Tennessee | 43% | 57% | -14% |
| Maine | 43% | 57% | -14% |
| Kansas | 42% | 58% | -16% |
| Idaho | 41% | 59% | -18% |
| New Mexico | 40% | 60% | -20% |
| Kentucky | 39% | 61% | -22% |
| Iowa | 39% | 61% | -22% |
| Nebraska | 38% | 62% | -24% |
| Oklahoma | 37% | 63% | -26% |
| Alabama | 35% | 65% | -30% |
| Arkansas | 34% | 66% | -32% |
| Louisiana | 33% | 67% | -34% |
| Montana | 32% | 68% | -36% |
| Alaska | 32% | 68% | -36% |
| West Virginia | 30% | 70% | -40% |
| South Dakota | 29% | 71% | -42% |
| Mississippi | 26% | 74% | -48% |
| Wyoming | 26% | 74% | -48% |
| North Dakota | 24% | 76% | -52% |
Which one would you prefer to drive?


Leave a Reply