
This would make the average Roman in 14AD poorer than the average citizen of every single one of the world’s countries in 2015.
Wondering how that’s possible? Then keep reading to find out.
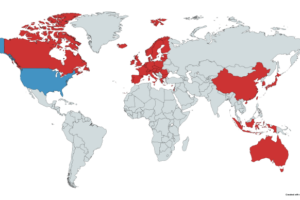
According to the World Bank, the Democratic Republic of the Congo is currently the world’s poorest nation with GDP per capita in constant 1990 PPP dollars of $766 in 2012. This makes today’s average Congolese citizen about 34% richer than the average Roman in 14AD.
However, as the map above shows GDP per capita varied widely across the Empire. In Italia, the core of the Empire in 14AD, average GDP per capita is estimated to have been as high as $857, making it actually higher than Congo’s today. This was caused, in part, by the fact that taxation tended to flow from the periphery to the centre and the concentrations of the Empire’s elite citizens living in or near Rome.
In contrast, the Empire’s poorest provinces were only half as wealthy, which dragged down the average. Interestingly, this relative income inequality between Roman provinces is similar to that seen between US states today.
According to the United States Bureau of Economic Analysis, Delaware has the highest GDP per capita of any state at $61,183 in 2012 vs Mississippi’s much smaller $28,944 or just a little less than half as much. However, Washington DC’s figure of $145,663 is five times that of Mississippi’s.
So how is it possible for citizens of today’s poorest countries to be, on average, wealthier than the citizens of one of history’s greatest empires?
Politically, there have been a couple of changes since the Roman Empire:
Independence: Most states that were part of Empires have decolonised and are today de jure independent, meaning they don’t need to pay money directly to a foreign occupying power. However, debt for many countries remains a major issue.
End of Slavery: While slavery still happens far too often in the world today, it is illegal in all countries. In contrast, the Roman Empire was at its very core a slave state, with slavery playing an important role in the economy.
However, neither of these are fully sufficient to explain the wealth differences between today’s global poor and those of Romans living 2,000 years ago. Two other changes are more important.
Science & Technology: The first factor is the vast improvements in science and technology over the past 2,000 years. While the Romans were able to build engineering marvels such as roads and aqueducts, they wouldn’t have a clue what to do with a mobile phone. And the speed of technology’s diffusion is increasing.
For example, Zimbabwe (the second poorest country according to the World Bank) has more mobile phones than people. Combine this with vast improvements in agriculture over the past 2,000 years and even the world’s poorest economies have far more productive workforces than Rome did.
Health: Life Expectancy in the Roman Empire has been estimated to have been as low as 25 years, due in part to extremely high infant mortality rates that might have been somewhere between 15-35%. Today, Sierra Leone has the world’s lowest life expectancy at 38 years and Afghanistan has the the worst infant mortality rate of somewhere between 14-19%.
So even people living in countries with the worst health stats today, are statically likely to live longer, and see a greater share of their children reach adulthood, than a Roman would in 14AD. Nevertheless, that’s not to say each of us couldn’t be doing more to help by donating to humanitarian organizations like the Red Cross and Doctors without Borders.
Methodology
You may also be wondering how on earth you calculate and compare GDP per capita figures from 2,000 years ago? The numbers for the map come from historian Angus Maddison who uses Sestertius records to find wheat equivalent figure for national disposable income and makes comparisons based off that.
It also assumes the population of the Empire in 14AD was 44 million (other estimates have it as high as 60 million), so is at best just a very educated guess. The Roman Economy Wikipedia page has more on this.
It is interesting to note that outside of Italia, Egypt was the wealthiest province of the Empire and the areas that make up modern France were some of the poorest. In terms of GDP per capita of these 3 regions today, France is the wealthiest ($40,375) followed by Italy ($35,486) with Egypt ($10,877) only roughly a quarter as well off as France (but 16X wealthier than it was 2,000 years ago).
Made it this far? Here’s a bonus map looking at the various trade routes within the Roman Empire in 180AD to give you a better idea about the types of goods and resources each part of the Empire produced and perhaps help explain why some were richer than others.

- Contours of the World Economy 1-2030 AD: Essays in Macro-Economic History (includes the essay that is the basis for the map at the top)
- The Cambridge Companion to the Roman Economy
- The Roman Market Economy
Also see:
- An Incredibly Detailed Map of the Roman Empire At Its Height in 211AD
- Map Of The Roads Of The Roman Empire in 200AD
What do you think of the map? Do you think life was really so bad back in the Roman Empire? Leave your comments below:


Olaf Olson says
This is interesting as a historical resource, but any comparison to today is downright silly. Many people in the Roman Empire were sustenance workers who never entered the economy at all. However, if you took the HDI for metropolitan free citizens in the Roman Empire and compared that to today, it would be at least a medium level of development.
Donkey donkey boo says
The analysis of the U.S. is flawed — purchasing power differences greatly reduce the inter-state inequality. The U.S. has much lesser geographical inequality than most European nations.
JA! says
I should say, in Hispania (Spain), Barcino (Barcelona), if existed at that time, was just a very small town. Biggest cities were Tarraco (Tarragona), Cartago Nova (Cartagena) and Gades (Cadiz). Later Emerita Augusta (Merida), CaesarAugusta (Zaragoza) and Hispalis (Seville).
Alberto Massidda says
I would have compared the lifestyle, not the GDP. The wealth and welfare available in Italia at that time was much higher compared to any of today’s countries. Also, the rest of the non-roman world had basically no GDP at all.
The analysis looks just flawed
David Swaby says
If you compare the first decade of the twenty first century to the Roman Empire, in terms of production (industry), medicine (science), and engineering (most of our cities have got vastly healthier since the nineteenth century) we vastly outweigh the RE in this regard, so this must make an economical impact in comparison. In terms of the core land of Italy (and Rome), modern Italy is immensely better off for every Italian (economically & politically) than under RE. Even pollution was not good under the RE. There is an ice core spike in the metal lead found about 100BC to 400AD (roughly classical period), due to intensive Roman smelting of lead, mainly supplied by the Spanish lead mines.
Matthew Pease says
Per capita income includes the slaves or not?
Faramund says
You are missing that the $570 is in 1990 dollars… Using 1990 dollars there are several countries with lower GDP per capita than that today. What you’ve written above ignores inflation.
Rem says
This doesn’t make sense. Obviously back then things would have been a lot cheaper. Have you taken into account product inflation? The demand of billions of people obviously means that in the 21st century, prices are going to be a lot different compared to 2,000 years ago. I guarantee the elite Romans were living it up unlike the people in third world countries today. They headed the empire. This article doesn’t make any sense.
ROMA INVICTA says
When they mentioned technology, they left out the biggest factor in why this is a poor analysis. Industrialization. Rome made everything by hand. They lacked the capabilities of mass production. Another factor was how trade worked, they not only took forever to transport goods, but they also lost a lot due to trade routes being plundered and also natural conditions.
History’s Awesome says
That deficit though… that last map tells the story of how it collapsed. Just couldn’t afford the required balance of the cost of defense to maintain the empire and the cost of keeping the population distracted through entertainment. The comments above hit the nail on the head as far as the GDP comparison. You have to keep it in context; Romans were still the wealthiest people in the western world at that time. Interesting read nonetheless.
rafael Trefil says
In todays’ numbers the Roman Empire would be in the $65,000 to $100,000 Dollar range. Remember this is relative to other countries. Comparing it to today’s countries is silly.
Noname says
Sorry, but Tyrus isn’t southern suburb of Tel Aviv-Jaffa, but in south of Lebanon.
Difference is cca 200 km.
ulv says
Brilliant map, not so brilliant text.
Ash says
You chose a specific date I notice of 14 AD, the beginning of the reign of the 4 Good Emperors. I’d be curious to know what the per capita GDP was in 100-180 AD Rome just to see the improvement from 14 AD.