
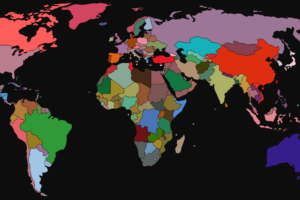
The map above shows how the richest, middle and poorest income countries have changed from 1950 until today.
And to be clear, the maps are not showing what was regarded as the First, Second & Third Worlds during the Cold War but instead split countries purely based on income.
Data, maps and explanation below:


Interestingly, only two countries: Oman and South Korea managed to go from 3rd to 1st!
Rankings across all 4 years:
| Country | Ranking 1950 | Ranking 1975 | Ranking 2000 | Ranking 2022 |
|---|---|---|---|---|
| Qatar | 1st | 1st | 1st | 1st |
| Norway | 1st | 1st | 1st | 1st |
| Singapore | 1st | 1st | 1st | 1st |
| United Arab Emirates | 1st | 1st | 1st | 1st |
| Kuwait | 1st | 1st | 1st | 1st |
| Switzerland | 1st | 1st | 1st | 1st |
| Ireland | 1st | 1st | 1st | 1st |
| United States | 1st | 1st | 1st | 1st |
| Luxembourg | 1st | 1st | 1st | 1st |
| Saudi Arabia | 1st | 1st | 1st | 1st |
| Taiwan | 2nd | 2nd | 1st | 1st |
| Australia | 1st | 1st | 1st | 1st |
| Denmark | 1st | 1st | 1st | 1st |
| Netherlands | 1st | 1st | 1st | 1st |
| Hong Kong | 1st | 1st | 1st | 1st |
| Oman | 3rd | 2nd | 1st | 1st |
| Sweden | 1st | 1st | 1st | 1st |
| Germany | 1st | 1st | 1st | 1st |
| Canada | 1st | 1st | 1st | 1st |
| Austria | 1st | 1st | 1st | 1st |
| Iceland | 1st | 1st | 1st | 1st |
| Belgium | 1st | 1st | 1st | 1st |
| South Korea | 3rd | 2nd | 1st | 1st |
| Finland | 1st | 1st | 1st | 1st |
| France | 1st | 1st | 1st | 1st |
| Bahrain | 1st | 2nd | 1st | 1st |
| United Kingdom | 1st | 1st | 1st | 1st |
| Japan | 2nd | 1st | 1st | 1st |
| New Zealand | 1st | 1st | 1st | 1st |
| Israel | 1st | 1st | 1st | 1st |
| Italy | 1st | 1st | 1st | 1st |
| Puerto Rico | 1st | 1st | 1st | 1st |
| Malta | 2nd | 2nd | 1st | 1st |
| Spain | 1st | 1st | 1st | 1st |
| Slovenia | No Data | 1st | 1st | 1st |
| Poland | 1st | 1st | 1st | 1st |
| Czechia | No Data | 1st | 1st | 1st |
| Cyprus | 2nd | 2nd | 1st | 1st |
| Seychelles | 2nd | 2nd | 1st | 1st |
| Lithuania | No Data | No Data | 2nd | 1st |
| Czechoslovakia | 1st | 1st | 1st | 1st |
| Estonia | No Data | No Data | 1st | 1st |
| Hungary | 1st | 1st | 1st | 1st |
| Portugal | 2nd | 1st | 1st | 1st |
| Slovakia | No Data | No Data | 1st | 1st |
| Turkey | 2nd | 2nd | 2nd | 1st |
| Latvia | No Data | No Data | 2nd | 1st |
| Croatia | No Data | 1st | 1st | 1st |
| Malaysia | 2nd | 2nd | 1st | 1st |
| Kazakhstan | No Data | No Data | 2nd | 1st |
| Romania | 2nd | 2nd | 2nd | 1st |
| Trinidad and Tobago | 1st | 1st | 1st | 1st |
| Russia | 2nd | 1st | 2nd | 1st |
| Greece | 2nd | 1st | 1st | 1st |
| Panama | 2nd | 2nd | 2nd | 1st |
| Chile | 1st | 2nd | 1st | 1st |
| Equatorial Guinea | 3rd | 2nd | 1st | 2nd |
| Montenegro | No Data | 2nd | 2nd | 2nd |
| Mauritius | 1st | 2nd | 1st | 2nd |
| Bulgaria | 2nd | 1st | 2nd | 2nd |
| Uruguay | 1st | 1st | 1st | 2nd |
| USSR | 1st | 1st | 2nd | 2nd |
| Yugoslavia | 2nd | 2nd | 2nd | 2nd |
| China | 3rd | 3rd | 2nd | 2nd |
| Belarus | No Data | No Data | 2nd | 2nd |
| Iran | 2nd | 1st | 2nd | 2nd |
| Argentina | 1st | 1st | 1st | 2nd |
| Dominican Republic | 2nd | 2nd | 2nd | 2nd |
| Azerbaijan | No Data | No Data | 2nd | 2nd |
| Turkmenistan | No Data | No Data | 2nd | 2nd |
| Serbia | No Data | 1st | 2nd | 2nd |
| Thailand | 3rd | 2nd | 2nd | 2nd |
| Botswana | 3rd | 3rd | 2nd | 2nd |
| Mexico | 1st | 2nd | 1st | 2nd |
| Gabon | 2nd | 1st | 2nd | 2nd |
| Costa Rica | 2nd | 2nd | 2nd | 2nd |
| Brazil | 2nd | 2nd | 2nd | 2nd |
| Colombia | 1st | 2nd | 2nd | 2nd |
| Georgia | No Data | No Data | 2nd | 2nd |
| North Macedonia | No Data | 1st | 2nd | 2nd |
| Armenia | No Data | No Data | 2nd | 2nd |
| Algeria | 2nd | 2nd | 2nd | 2nd |
| Mongolia | 3rd | 3rd | 3rd | 2nd |
| Egypt | 3rd | 3rd | 2nd | 2nd |
| Iraq | 2nd | 2nd | 3rd | 2nd |
| Albania | 2nd | 2nd | 2nd | 2nd |
| Indonesia | 3rd | 3rd | 2nd | 2nd |
| Peru | 1st | 2nd | 2nd | 2nd |
| Libya | 3rd | 2nd | 2nd | 2nd |
| Uzbekistan | No Data | No Data | 2nd | 2nd |
| Bosnia and Herzegovina | No Data | 2nd | 2nd | 2nd |
| Barbados | 1st | 1st | 1st | 2nd |
| South Africa | 1st | 2nd | 2nd | 2nd |
| Tunisia | 2nd | 2nd | 2nd | 2nd |
| Sri Lanka | 2nd | 3rd | 2nd | 2nd |
| Saint Lucia | 3rd | 3rd | 2nd | 2nd |
| Lebanon | 1st | 2nd | 2nd | 2nd |
| Ecuador | 2nd | 2nd | 2nd | 2nd |
| El Salvador | 2nd | 2nd | 2nd | 2nd |
| Jordan | 2nd | 2nd | 2nd | 2nd |
| Dominica | 3rd | 3rd | 2nd | 2nd |
| Paraguay | 2nd | 2nd | 2nd | 2nd |
| Eswatini | 3rd | 2nd | 2nd | 2nd |
| Morocco | 2nd | 2nd | 2nd | 2nd |
| Philippines | 2nd | 2nd | 3rd | 2nd |
| Vietnam | 3rd | 3rd | 3rd | 2nd |
| Namibia | 1st | 2nd | 2nd | 2nd |
| Guatemala | 2nd | 2nd | 2nd | 2nd |
| India | 3rd | 3rd | 3rd | 2nd |
| Ukraine | No Data | No Data | 2nd | 2nd |
| Cuba | 2nd | 2nd | 3rd | 2nd |
| Jamaica | 2nd | 2nd | 2nd | 2nd |
| Cape Verde | 3rd | 3rd | 3rd | 3rd |
| Laos | 3rd | 3rd | 3rd | 3rd |
| Moldova | No Data | No Data | 3rd | 3rd |
| Bolivia | 2nd | 2nd | 2nd | 3rd |
| Angola | 2nd | 3rd | 3rd | 3rd |
| Pakistan | 3rd | 3rd | 3rd | 3rd |
| Tajikistan | No Data | No Data | 3rd | 3rd |
| Kyrgyzstan | No Data | No Data | 3rd | 3rd |
| Venezuela | 1st | 1st | 1st | 3rd |
| Honduras | 2nd | 2nd | 3rd | 3rd |
| Myanmar | 3rd | 3rd | 3rd | 3rd |
| Nicaragua | 2nd | 2nd | 3rd | 3rd |
| Nigeria | 3rd | 3rd | 3rd | 3rd |
| Bangladesh | 3rd | 3rd | 3rd | 3rd |
| Palestine | 2nd | 2nd | 2nd | 3rd |
| Ghana | 2nd | 3rd | 3rd | 3rd |
| Congo | 2nd | 3rd | 2nd | 3rd |
| Cote d'Ivoire | 2nd | 2nd | 3rd | 3rd |
| Cambodia | 3rd | 3rd | 3rd | 3rd |
| Sao Tome and Principe | 3rd | 3rd | 3rd | 3rd |
| Mauritania | 3rd | 3rd | 3rd | 3rd |
| Djibouti | 1st | 2nd | 3rd | 3rd |
| Kenya | 3rd | 3rd | 3rd | 3rd |
| Zambia | 3rd | 3rd | 3rd | 3rd |
| Tanzania | 3rd | 3rd | 3rd | 3rd |
| Nepal | 3rd | 3rd | 3rd | 3rd |
| Cameroon | 3rd | 3rd | 3rd | 3rd |
| Senegal | 2nd | 3rd | 3rd | 3rd |
| Syria | 1st | 1st | 2nd | 3rd |
| Benin | 2nd | 3rd | 3rd | 3rd |
| Lesotho | 3rd | 3rd | 3rd | 3rd |
| Ethiopia | 3rd | 3rd | 3rd | 3rd |
| Rwanda | 3rd | 3rd | 3rd | 3rd |
| Uganda | 3rd | 3rd | 3rd | 3rd |
| Gambia | 3rd | 3rd | 3rd | 3rd |
| Yemen | 2nd | 2nd | 2nd | 3rd |
| Comoros | 3rd | 3rd | 3rd | 3rd |
| Guinea | 3rd | 3rd | 3rd | 3rd |
| Burkina Faso | 3rd | 3rd | 3rd | 3rd |
| Zimbabwe | 3rd | 3rd | 3rd | 3rd |
| Sierra Leone | 3rd | 3rd | 3rd | 3rd |
| Mali | 3rd | 3rd | 3rd | 3rd |
| Guinea-Bissau | 3rd | 3rd | 3rd | 3rd |
| Togo | 3rd | 3rd | 3rd | 3rd |
| North Korea | No Data | No Data | 3rd | 3rd |
| Haiti | 2nd | 3rd | 3rd | 3rd |
| Chad | 3rd | 3rd | 3rd | 3rd |
| Madagascar | 2nd | 3rd | 3rd | 3rd |
| Afghanistan | 3rd | 3rd | 3rd | 3rd |
| Malawi | 3rd | 3rd | 3rd | 3rd |
| Mozambique | 2nd | 3rd | 3rd | 3rd |
| Niger | 3rd | 3rd | 3rd | 3rd |
| Democratic Republic of Congo | 3rd | 3rd | 3rd | 3rd |
| Liberia | 2nd | 2nd | 3rd | 3rd |
| Burundi | 3rd | 3rd | 3rd | 3rd |
| Central African Republic | 3rd | 3rd | 3rd | 3rd |
GDP per capita figures for all 4 years:
| Entity | GDP Per Capita 1950 | GDP Per Capita 1975 | GDP Per Capita 2000 | GDP Per Capita 2022 |
|---|---|---|---|---|
| Qatar | $48,436 | $54,866 | $45,788 | $149,171 |
| Norway | $8,655 | $19,560 | $54,040 | $88,366 |
| Singapore | $3,572 | $9,602 | $37,773 | $80,320 |
| United Arab Emirates | $25,182 | $40,591 | $48,888 | $77,204 |
| Kuwait | $46,031 | $28,950 | $35,845 | $71,534 |
| Switzerland | $11,541 | $24,468 | $43,251 | $63,323 |
| Ireland | $5,504 | $11,662 | $38,807 | $60,257 |
| United States | $15,240 | $25,956 | $45,886 | $58,487 |
| Luxembourg | $13,378 | $22,643 | $50,064 | $55,485 |
| Saudi Arabia | $3,556 | $18,788 | $23,905 | $53,517 |
| Taiwan | $1,460 | $5,614 | $26,787 | $53,143 |
| Australia | $11,815 | $20,993 | $36,603 | $52,049 |
| Denmark | $11,067 | $21,712 | $39,021 | $50,690 |
| Netherlands | $9,558 | $21,318 | $37,900 | $49,670 |
| Hong Kong | $4,082 | $11,456 | $32,894 | $48,289 |
| Oman | $993 | $6,802 | $24,186 | $47,989 |
| Sweden | $10,742 | $22,607 | $34,203 | $47,126 |
| Germany | $6,186 | $19,193 | $33,367 | $46,648 |
| Canada | $11,622 | $22,819 | $36,943 | $45,530 |
| Austria | $5,907 | $18,564 | $34,796 | $43,793 |
| Iceland | $8,498 | $18,935 | $33,108 | $42,146 |
| Belgium | $8,706 | $19,831 | $33,720 | $41,872 |
| South Korea | $998 | $4,362 | $23,108 | $41,321 |
| Finland | $6,779 | $18,237 | $32,690 | $40,701 |
| France | $8,266 | $20,653 | $33,410 | $39,066 |
| Bahrain | $3,354 | $6,252 | $17,022 | $38,652 |
| United Kingdom | $11,061 | $18,884 | $31,946 | $38,407 |
| Japan | $3,062 | $18,082 | $33,211 | $38,269 |
| New Zealand | $13,479 | $19,907 | $26,823 | $38,250 |
| Israel | $4,490 | $16,176 | $26,059 | $36,649 |
| Italy | $5,582 | $17,123 | $32,717 | $36,224 |
| Puerto Rico | $3,416 | $11,073 | $27,392 | $35,281 |
| Malta | $1,573 | $5,738 | $20,435 | $34,496 |
| Spain | $3,459 | $12,613 | $26,995 | $34,123 |
| Slovenia | No Data | $17,205 | $21,501 | $32,674 |
| Poland | $3,900 | $9,258 | $12,732 | $32,468 |
| Czechia | No Data | $10,954 | $17,056 | $32,247 |
| Cyprus | $2,885 | $5,528 | $22,327 | $31,523 |
| Seychelles | $2,632 | $4,506 | $14,380 | $31,055 |
| Lithuania | No Data | No Data | $10,807 | $30,863 |
| Czechoslovakia | $5,581 | $11,794 | $15,378 | $30,641 |
| Estonia | No Data | No Data | $16,807 | $30,067 |
| Hungary | $3,953 | $9,253 | $13,129 | $29,452 |
| Portugal | $3,325 | $10,388 | $23,372 | $28,992 |
| Slovakia | No Data | No Data | $13,905 | $27,519 |
| Turkey | $2,079 | $5,719 | $11,904 | $27,362 |
| Latvia | No Data | No Data | $11,310 | $27,220 |
| Croatia | No Data | $11,053 | $13,245 | $26,987 |
| Malaysia | $2,485 | $4,221 | $13,475 | $26,629 |
| Kazakhstan | No Data | No Data | $9,309 | $26,492 |
| Romania | $1,884 | $5,995 | $7,090 | $26,198 |
| Trinidad and Tobago | $5,856 | $14,534 | $19,180 | $25,773 |
| Russia | $3,311 | $11,164 | $10,553 | $25,437 |
| Greece | $3,052 | $12,309 | $20,965 | $25,284 |
| Panama | $2,577 | $5,649 | $9,899 | $23,557 |
| Chile | $5,880 | $6,731 | $15,212 | $22,741 |
| Equatorial Guinea | $797 | $3,080 | $12,915 | $22,707 |
| Montenegro | No Data | $5,512 | $6,046 | $20,942 |
| Mauritius | $3,942 | $6,030 | $14,272 | $20,643 |
| Bulgaria | $2,632 | $9,295 | $8,411 | $20,592 |
| Uruguay | $7,015 | $8,563 | $13,050 | $20,182 |
| USSR | $4,529 | $9,779 | $8,194 | $19,355 |
| Yugoslavia | $2,276 | $7,976 | $8,473 | $19,352 |
| China | $799 | $1,594 | $4,730 | $19,238 |
| Belarus | No Data | No Data | $9,111 | $18,700 |
| Iran | $2,742 | $9,377 | $9,105 | $18,473 |
| Argentina | $7,949 | $12,946 | $14,369 | $18,292 |
| Dominican Republic | $1,637 | $3,365 | $6,788 | $17,714 |
| Azerbaijan | No Data | No Data | $4,215 | $17,683 |
| Turkmenistan | No Data | No Data | $4,173 | $17,235 |
| Serbia | No Data | $8,498 | $6,060 | $17,098 |
| Thailand | $1,302 | $3,123 | $9,627 | $16,421 |
| Botswana | $489 | $1,712 | $8,044 | $16,352 |
| Mexico | $3,510 | $8,011 | $12,613 | $16,235 |
| Gabon | $2,958 | $9,985 | $10,638 | $15,721 |
| Costa Rica | $3,129 | $7,007 | $9,320 | $15,497 |
| Brazil | $2,236 | $6,582 | $9,834 | $14,640 |
| Colombia | $3,432 | $5,772 | $8,497 | $14,469 |
| Georgia | No Data | No Data | $4,892 | $14,360 |
| North Macedonia | No Data | $8,064 | $8,084 | $14,051 |
| Armenia | No Data | No Data | $5,140 | $13,838 |
| Algeria | $2,176 | $4,020 | $6,835 | $13,506 |
| Mongolia | $677 | $1,387 | $2,936 | $13,443 |
| Egypt | $1,451 | $2,265 | $6,594 | $13,205 |
| Iraq | $2,174 | $6,878 | $3,649 | $13,072 |
| Albania | $1,596 | $3,649 | $4,808 | $12,978 |
| Indonesia | $1,280 | $2,386 | $5,384 | $12,802 |
| Peru | $3,679 | $6,896 | $6,038 | $12,763 |
| Libya | $620 | $6,872 | $9,771 | $12,755 |
| Uzbekistan | No Data | No Data | $4,667 | $12,559 |
| Bosnia and Herzegovina | No Data | $5,247 | $7,082 | $12,143 |
| Barbados | $3,390 | $9,825 | $12,600 | $11,546 |
| South Africa | $4,041 | $6,808 | $7,583 | $11,416 |
| Tunisia | $1,777 | $3,899 | $7,548 | $10,914 |
| Sri Lanka | $1,997 | $2,434 | $5,841 | $10,705 |
| Saint Lucia | $1,231 | $2,428 | $7,191 | $10,452 |
| Lebanon | $3,872 | $5,742 | $7,406 | $10,341 |
| Ecuador | $2,970 | $5,514 | $6,908 | $10,124 |
| El Salvador | $2,375 | $4,030 | $5,404 | $9,219 |
| Jordan | $2,651 | $4,117 | $7,622 | $9,151 |
| Dominica | $980 | $1,940 | $5,697 | $8,880 |
| Paraguay | $2,391 | $3,464 | $4,896 | $8,763 |
| Eswatini | $604 | $2,856 | $4,895 | $8,522 |
| Morocco | $2,319 | $2,919 | $4,754 | $8,400 |
| Philippines | $1,706 | $3,241 | $4,034 | $8,371 |
| Vietnam | $1,049 | $1,132 | $2,773 | $8,050 |
| Namibia | $4,009 | $6,293 | $5,972 | $7,979 |
| Guatemala | $3,323 | $5,439 | $5,860 | $7,969 |
| India | $987 | $1,430 | $2,753 | $7,766 |
| Ukraine | No Data | No Data | $5,166 | $7,749 |
| Cuba | $2,638 | $3,733 | $4,009 | $7,649 |
| Jamaica | $2,115 | $6,129 | $6,531 | $7,482 |
| Cape Verde | $1,006 | $1,237 | $3,584 | $7,203 |
| Laos | $697 | $999 | $2,262 | $7,168 |
| Moldova | No Data | No Data | $2,990 | $6,675 |
| Bolivia | $3,011 | $4,010 | $4,174 | $6,481 |
| Angola | $1,677 | $1,710 | $2,014 | $6,119 |
| Pakistan | $1,025 | $1,559 | $3,155 | $5,532 |
| Tajikistan | No Data | No Data | $1,723 | $5,508 |
| Kyrgyzstan | No Data | No Data | $3,246 | $5,305 |
| Venezuela | $8,462 | $16,385 | $13,993 | $5,267 |
| Honduras | $2,018 | $2,764 | $3,336 | $5,187 |
| Myanmar | $631 | $1,057 | $1,843 | $5,177 |
| Nicaragua | $2,565 | $5,013 | $2,859 | $5,093 |
| Nigeria | $1,200 | $2,051 | $2,145 | $5,070 |
| Bangladesh | $861 | $843 | $1,485 | $4,926 |
| Palestine | $1,549 | $4,085 | $5,377 | $4,775 |
| Ghana | $1,788 | $1,988 | $2,100 | $4,242 |
| Congo | $1,693 | $2,745 | $4,159 | $4,188 |
| Cote d'Ivoire | $1,659 | $2,812 | $2,353 | $4,012 |
| Cambodia | $768 | $925 | $1,659 | $3,944 |
| Sao Tome and Principe | $1,278 | $2,469 | $2,219 | $3,752 |
| Mauritania | $679 | $1,699 | $1,935 | $3,680 |
| Djibouti | $3,459 | $4,691 | $1,881 | $3,623 |
| Kenya | $1,038 | $1,502 | $1,915 | $3,404 |
| Zambia | $1,054 | $1,659 | $1,429 | $3,342 |
| Tanzania | $676 | $956 | $1,149 | $3,057 |
| Nepal | $802 | $1,047 | $1,677 | $3,014 |
| Cameroon | $1,070 | $1,677 | $1,961 | $2,812 |
| Senegal | $2,007 | $2,225 | $1,984 | $2,661 |
| Syria | $3,838 | $8,878 | $7,668 | $2,495 |
| Benin | $1,627 | $1,570 | $1,909 | $2,477 |
| Lesotho | $631 | $1,270 | $1,967 | $2,313 |
| Ethiopia | $622 | $972 | $772 | $2,289 |
| Rwanda | $1,020 | $1,199 | $1,024 | $2,198 |
| Uganda | $1,095 | $1,243 | $1,192 | $2,122 |
| Gambia | $982 | $1,497 | $1,441 | $2,011 |
| Yemen | $1,452 | $2,844 | $4,212 | $1,959 |
| Comoros | $534 | $1,038 | $1,204 | $1,900 |
| Guinea | $520 | $854 | $1,047 | $1,809 |
| Burkina Faso | $756 | $1,068 | $1,275 | $1,705 |
| Zimbabwe | $1,117 | $2,235 | $2,211 | $1,704 |
| Sierra Leone | $902 | $1,551 | $829 | $1,690 |
| Mali | $728 | $982 | $1,153 | $1,652 |
| Guinea-Bissau | $462 | $1,479 | $1,231 | $1,625 |
| Togo | $870 | $1,556 | $1,150 | $1,587 |
| North Korea | No Data | No Data | $1,657 | $1,569 |
| Haiti | $1,790 | $1,726 | $1,521 | $1,546 |
| Chad | $815 | $952 | $716 | $1,394 |
| Madagascar | $1,516 | $1,795 | $1,239 | $1,367 |
| Afghanistan | $1,156 | $1,074 | $502 | $1,358 |
| Malawi | $516 | $934 | $967 | $1,190 |
| Mozambique | $1,806 | $2,238 | $1,196 | $1,088 |
| Niger | $983 | $1,050 | $693 | $1,008 |
| Democratic Republic of Congo | $909 | $1,213 | $414 | $844 |
| Liberia | $3,151 | $4,326 | $972 | $811 |
| Burundi | $595 | $883 | $740 | $717 |
| Central African Republic | $1,307 | $1,323 | $964 | $596 |
More about the concept of First, Second & Third Worlds:
Origin of the First, Second, and Third World Concepts
These terms emerged during the Cold War as a way to categorize countries based on their political and economic alignment—not living standards, not development levels, and not geography.
They were first popularized by French demographer Alfred Sauvy in 1952.
First World
Original Meaning
Countries aligned with the United States and other Western capitalist democracies during the Cold War.
Characteristics
- Capitalist economic systems
- Liberal democratic political structures
- Typically industrialized and high-income
Examples (Cold War context)
- United States
- Canada
- Western Europe (e.g., UK, France, West Germany)
- Japan
- Australia, New Zealand
Second World
Original Meaning
Countries aligned with the Soviet Union and the communist/socialist bloc.
Characteristics
- State-controlled or centrally planned economies
- One-party communist governments
Examples
- Soviet Union
- Eastern European communist states (e.g., East Germany, Poland)
- China (at the time)
- Cuba
- North Korea
- Vietnam
Third World
Original Meaning
Countries that were not aligned with either the US or the USSR during the Cold War.
This included many nations in Africa, Asia, Latin America, and the Middle East, many of which were newly independent after decolonization.
Characteristics
- Politically non-aligned
- Economically diverse: some were poor, others not
- Often members of the Non-Aligned Movement (NAM)
Examples
- India
- Indonesia
- Egypt
- Yugoslavia
- Ghana
- Many Latin American, African, and Asian nations
How the Meaning Changed Over Time
After the Cold War ended, the original political meanings faded. In popular usage:
- “First World” → wealthy, industrialized countries
- “Third World” → incorrectly used to mean poor or developing countries
- “Second World” mostly fell out of use
Instead, we now use:
- Developed / Developing
- Global North / Global South
- High-income / middle-income / low-income
- OECD / BRICS, etc.
Why “Third World” Became Inaccurate and Controversial
As stated above, its original meaning was political, not economic
People often use “Third World” today to mean:
- poor
- underdeveloped
- chaotic
But originally, it meant “not aligned with NATO or the Warsaw Pact.” Many Third World countries were actually quite developed or powerful (e.g., India, Yugoslavia).
After the Cold War, the political context disappeared
The First vs. Second vs. Third World system depended on the existence of two superpower blocs. Once the USSR collapsed:
- There was no “Second World” anymore.
- The rest of the system broke down.
It carries negative connotations
By the 1980s–2000s, “Third World” had become associated with:
- poverty
- instability
- inferiority
Because of this, it is now widely seen as:
- derogatory
- outdated
- imprecise
It oversimplifies extremely diverse countries
“Third World” lumps together:
- Singapore (rich)
- Haiti (poor)
- India (huge and diverse)
- Saudi Arabia (rich in oil)
- Ethiopia (low income)
These countries have nothing in common economically.
How the Non-Aligned Movement Fit Into the First/Second/Third World Framework
The Non-Aligned Movement, founded formally in 1961 at the Belgrade Conference, was a group of countries that did not want to align militarily with either the U.S.-led capitalist bloc (First World) or the Soviet-led communist bloc (Second World).
Founding leaders
- Jawaharlal Nehru (India)
- Josip Broz Tito (Yugoslavia)
- Gamal Abdel Nasser (Egypt)
- Kwame Nkrumah (Ghana)
- Sukarno (Indonesia)
Why NAM formed
- Avoid Cold War military alliances
- Preserve national sovereignty
- Support anti-colonial and independence movements
- Promote peace and development outside the U.S.–USSR rivalry
How it relates to “Third World”
The original meaning of “Third World” basically overlaps with Non-Aligned Movement countries, because:
- First World = aligned with U.S.
- Second World = aligned with USSR
- Third World = NOT aligned (i.e., NAM)
Not every Third World country was formally in NAM, but the concepts are closely related.
Evolution of the Term “Global South”

The term “Global South” emerged in the 1960s–1980s from:
- the Brandt Line (a proposed North–South economic division)
- development economics
- post-colonial studies
How these approaches have some big problems of their own:

Rather than political alignment, it refers to structural global inequality.
Meaning today
“Global South” generally refers to:
- countries with lower average incomes
- formerly colonized countries
- regions of Africa, Latin America, the Middle East, and South/Southeast Asia
- some emerging powers (India, Brazil, Indonesia, South Africa, etc.)
- The United Nations Conference on Trade and Development (UNCTAD)’s has it’s own classification of economies, which was used for the map above.
Why it replaced “Third World”
- More respectful
- More accurate, rooted in global economics, not Cold War politics
- Includes advanced economies in the Southern hemisphere (e.g., Australia) only when appropriate
- Emphasizes shared experiences such as colonial legacies, development challenges, and global power imbalances
Caveats
The Global South is not strictly geographic:
- Australia is geographically south but not part of the “Global South.”
- China is in the “Global South” despite being a major power.
And finally a note on GDP data used in the original maps:
The Data comes from the Maddison Project Database, which describes the data in the following way:
- This data is adjusted for inflation and for differences in living costs between countries.
- Gross domestic product (GDP) is a measure of the total value added from the production of goods and services in a country or region each year. GDP per capita is GDP divided by population.
- This data is expressed in international-$ at 2011 prices, using a combination of 2011 and 1990 PPPs for historical data.
- Time series for former countries and territories are calculated forward in time by estimating values based on their last official borders.
- The Maddison Project Database is based on the work of many researchers who have produced estimates of economic growth and population for individual countries. The full list of sources for this historical data is given in the original dataset.
- For more regularly updated estimates of GDP per capita since 1990, see the World Bank’s indicator.


Leave a Reply