
All of the maps here come from the US Governments now defunct NationalAtlas.gov project.
“The online version of the National Atlas (officially known as the 1997-2014 Edition of the National Atlas of the United States) was removed from service in 2014.”
As Wikipedia further explains:
In late 2013, mapping managers at the U.S. Geological Survey decided to end the program despite the fact that nationalatlas.gov received three times the use of its other mapping service nationalmap.gov. The demise of the National Atlas was announced in February 2014 and nationalatlas.gov was taken offline on October 1, 2014.
Here’s the full statement put out at the time:
During this year, National Atlas of the United States and The National Map will transition into a combined single source for geospatial and cartographic information. This transformation is projected to streamline access to maps, data and information from the USGS National Geospatial Program (NGP). This action will prioritize our civilian mapping role and consolidate core investments while maintaining top-quality customer service.
The USGS will continue its long history of providing topographic maps, geospatial data and other geographic information by offering a range of scales and layers of geospatial information on The National Map Viewer and through US Topo maps. As a result of the conversion to an integrated single source for geospatial and cartographic information, nationalatlas.gov will be removed from service on September 30, 2014.
“We recognize how important it is for citizens to have access to the cartographic and geographic information of our nation. We are committed to providing that access through nationalmap.gov”, said Mark DeMulder, NGP Director.
“We value the National Atlas customers and stakeholders and want to make this transition as easy as possible,” explained Jay Donnelly, the National Atlas Program Manager. “We will post updates to The National Map and National Atlas Websites as this transition unfolds, including information on the future availability of the products and services currently delivered by nationalatlas.gov.”
And a few interesting FAQ questions:
Q: Will I still be able to find everything from the National Atlas on The National Map Web site?
No. Most National Atlas products and services that were primarily intended for a broad public audience as well as thematic data contributions from outside the National Geospatial Program (NGP) will not be available from nationalmap.gov. To learn more about this, please visit our National Atlas transition page. We also encourage you to download National Atlas products prior to September 30, 2014.
Q: Why was this decision made?
There were two primary considerations: budget and program priorities. The USGS NGP currently includes both the National Atlas and The National Map. Its strategic focus is on producing high quality elevation and hydrography data for the Nation and on making US Topo maps for America. Within this tight budget climate, the resources once devoted to producing the National Atlas will now be redirected to these NGP priorities.
Q: Who made the decision?
Mark DeMulder, the Director of the NGP, made this decision. He did so with the concurrence of his leadership team and the USGS Associate Director for Core Science Systems, Mr. Kevin Gallagher.
In any case the government might not want to still show you these maps, but I think they’re great so I present them to you here:
Landsat Satellite Map of The United States

In 1972, Landsat began transmitting views of our planet back to Earth. The first Landsat and its five successors (two of them in operation now) have delivered millions of new images from a satellite orbiting 438 miles above the Earth. Landsat’s orbit enables a new image to be recorded every sixteen days of any area on the Earth’s surface. In October, 2008, the U.S. Geological Survey opened the Landsat archive to user access at no charge.
These Satellite View maps were created from mosaics of many Landsat images joined together. Colors were selected to better show variations in the landscape. Relief shading was added to enhance the terrain and make the landforms more apparent.
Map of The Growth Of The United States

You can read more about this map here.
Map Of All Federal Lands & Indian Reservations In The US

To find out more about this map read my article here.
Map of US TimeZones

Map of US States In Bright Colors

You can also see similar maps for each US state below:
Map of US States With State Capitals

Map of Lakes & Rivers In The United States

Map of Annual Average Daily Maximum Temperature In The US

Map of Annual Average Daily Minimum Temperature In The US

Map of Average Annual Precipitation In The US

From the map:
Precipitation varies widely across the United States, from a low of 2.3 inches per year at California’s Death Valley to a high of 460 inches on Hawaii’s Mount Waialeale.
Nevada ranks as the driest state with an average annual precipitation of 9.5 inches and Hawaii is the Wettest at 70.3 inches.
Map of Average Annual Relative Humidity In The US

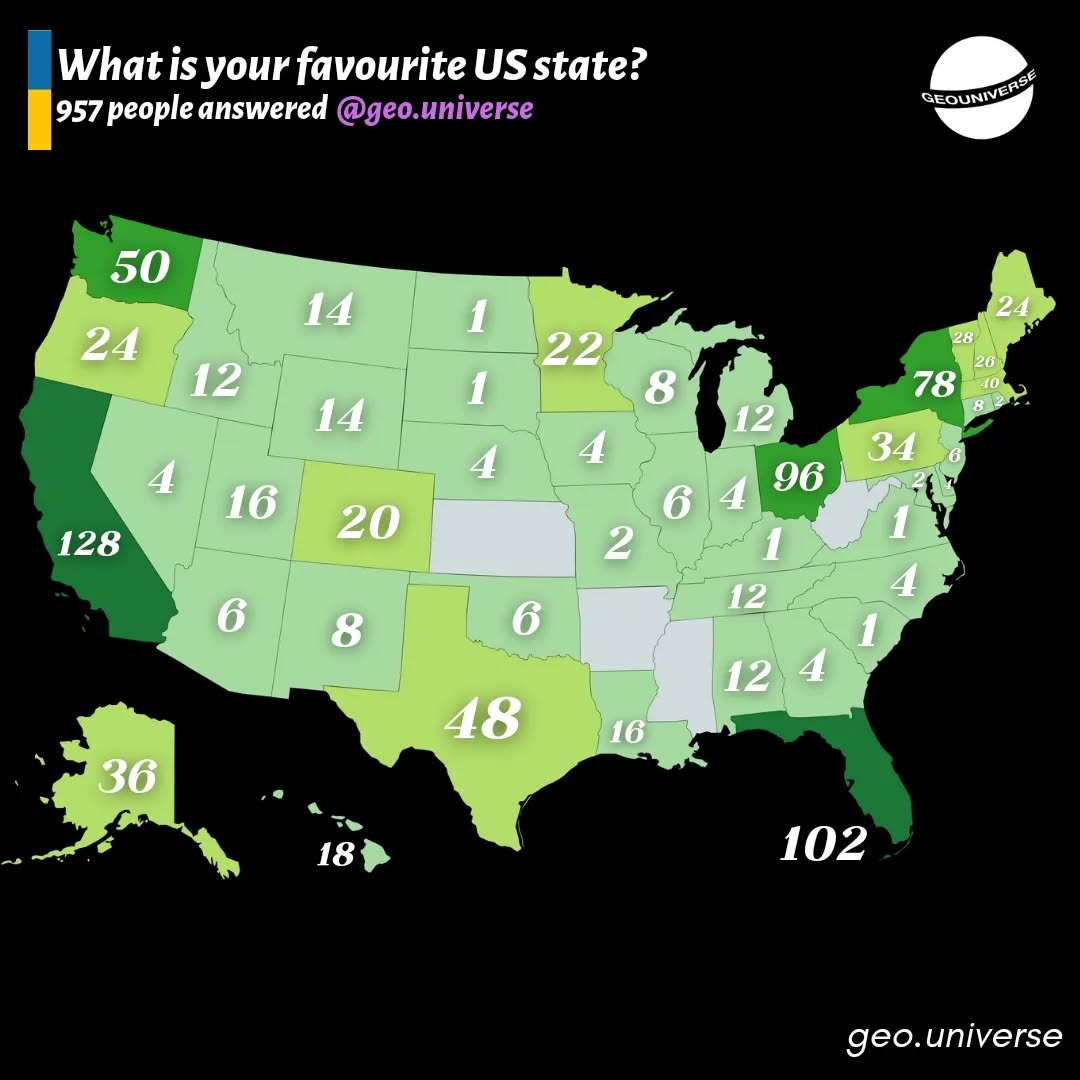
And finally here’s a fun map not from this series by Geo Universe
What’s Your Favourite US State?
Enjoy these maps? Then please help us by sharing them: