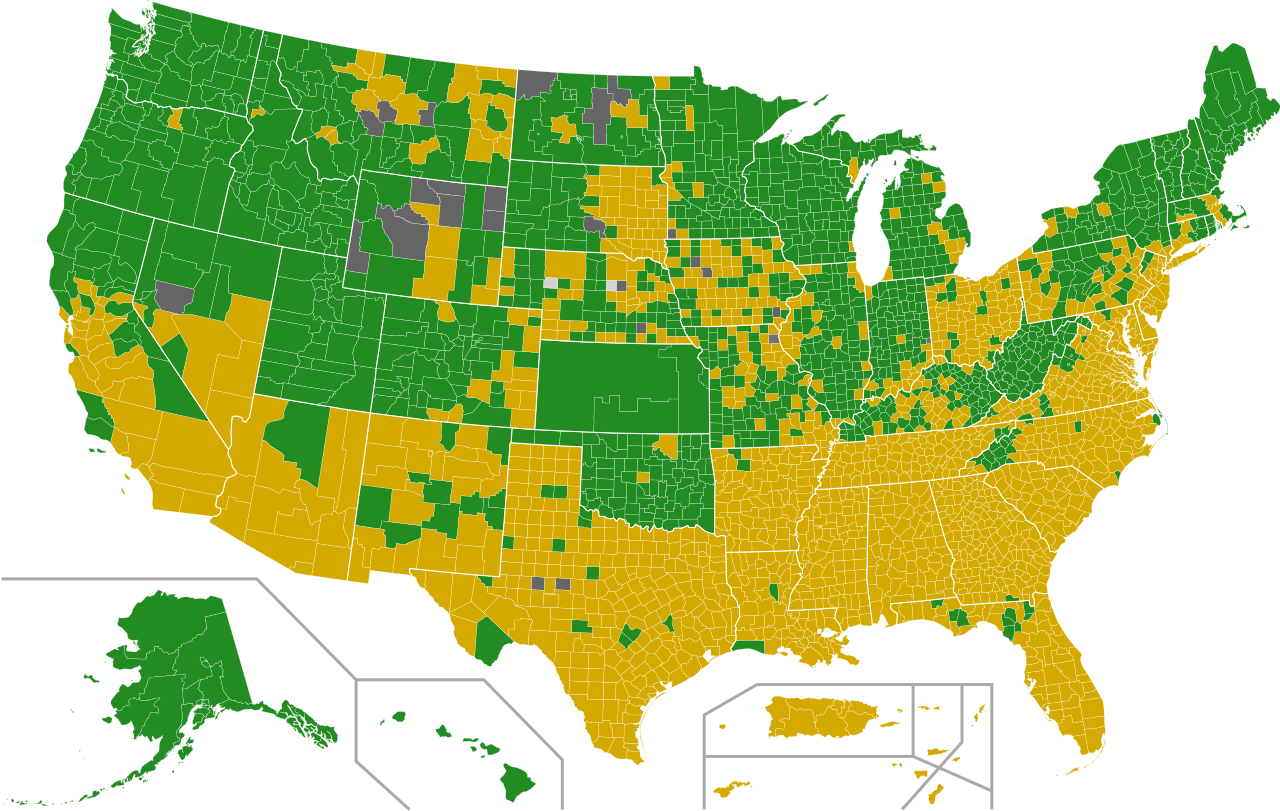
The map above shows which counties switched party in the 2016 US Presidential election compared to 2012. Red counties switched from Democrat to Republican, blue counties switched from Republican to Democrat and the vast majority in grey did not switch parties.
2016 US Presidential Election Map By County & Vote Share
The map above shows the county level and vote share results of the 2016 US Presidential Election. The darker the blue the more a county went for Hilary Clinton and the darker the red the more the county went for Donald Trump.
How Whites Voted In The 2016 US Presidential Election by State & County
The map above gives a preliminary view how white voters voted in the 2016 US presidential election on a county by county basis. The counties in blue voted for Hillary Clinton and the ones in red voted for Donald Trump.
If “Did Not Vote” Had Been A Candidate In The 2016 US Presidential Election, It Would Have Won By a Landslide
The map above shows what the 2016 US Presidential Election results would have been if votes not cast for Hillary, Trump or one of the third party candidates had gone to fictional candidate “Did Not Vote.”
See the 2020 results here.
2016 US Presidential Electoral Map If Only [X] Voted
The map above shows how the 2016 US Presidential election might go if only one demographic group got the vote. The map was created by Ste Kinney-Fields and is based on data from from fivethirtyeight and 270towin. You can read the full article here.
2016 Democratic Presidential Primary Results by County
The map above shows a county by country breakdown of the Democratic Presidential primaries. Counties won by Hilary Clinton are shown in gold and those won by Bernie Sanders are shown in green (ties are in dark grey).
2016 Republican Presidential Primary Results by County
The map above shows the country level results of the 2016 Republican Presidential primaries. Dark blue for Trump, gold for Cruz, red for Rubio, turquoise for Kasich and light-blue for Carson.
What Day of The Week Elections Are Normally Held: Election Days By Country
The map above shows what day of the week elections are normally held, but doesn’t say anything about whether the elections are free and/or fair.
Where Germans Voted For The Nazis in 1933
One important fact to remember about that the Nazis is that they were originally democratically elected into office. The map above shows where National Socialist German Workers Party (Nazi) support was the highest in the election of March 3rd, 1933.
It would turn out to be the last somewhat “free,” multi-party German election held across all of Germany until December 2nd, 1990, after German reunification.
However, it’s also important to note that while the Nazis won the most seats in 1933, they did not win a majority of them or the popular vote.
2016 Electoral Map: How Hispanic and Asian Voters Could Change The Electoral College
The map above shows what the 2016 presidential election results could look like based on the increase in the number of Hispanic and Asian voters who will be voting for the first time 2016.
The interactive version allows you to make some assumptions and see what the results would be. Some interesting findings include: