
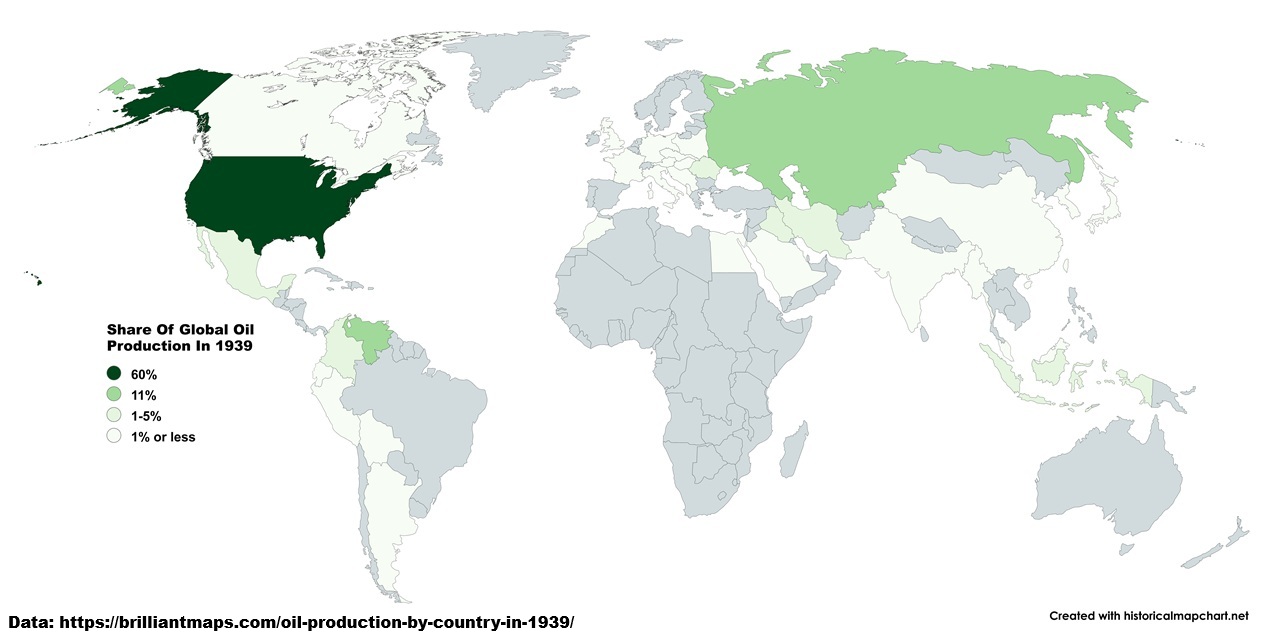
The map above shows the top 10 oil producing countries in 1939. Three big things stand out to me:
- First, of all Nazi Germany, Italy and Japan are not among the top 10.
- Two, Saudi Arabia and other Gulf states are also not among the top 10.
- Just how much more dominant the US was than everyone else. You can see the table below but US production was more than double the next 9 combined.
Here is the data by country:
| Country | Barrels of Oil | Share of World Oil Production |
|---|---|---|
| United States | 1,169,471,698 | 60.0% |
| Venezuela | 208,881,646 | 10.7% |
| USSR | 207,287,646 | 10.6% |
| Iran | 66,578,329 | 3.4% |
| Indonesia | 54,380,511 | 2.8% |
| Romania | 42,688,941 | 2.2% |
| Mexico | 41,991,141 | 2.2% |
| Iraq | 27,111,582 | 1.4% |
| Colombia | 22,575,882 | 1.2% |
| Trinidad and Tobago | 19,599,970 | 1.0% |
| Argentina | 18,218,053 | 0.9% |
| Peru | 12,273,071 | 0.6% |
| Myanmar | 7,203,759 | 0.4% |
| Bahrain | 7,101,141 | 0.4% |
| Canada | 6,957,476 | 0.4% |
| Brunei | 5,342,959 | 0.3% |
| Germany | 5,062,471 | 0.3% |
| Egypt | 4,556,223 | 0.2% |
| Saudi Arabia | 3,687,394 | 0.2% |
| Poland | 3,591,618 | 0.2% |
| China | 2,627,012 | 0.1% |
| Japan | 2,202,859 | 0.1% |
| India | 2,127,606 | 0.1% |
| Ecuador | 2,086,559 | 0.1% |
| Malaysia | 1,149,318 | 0.1% |
| Austria | 985,129 | 0.1% |
| Hungary | 985,129 | 0.1% |
| Albania | 964,606 | 0.0% |
| France | 478,882 | 0.0% |
| Bolivia | 191,553 | 0.0% |
| Czechoslovakia | 143,665 | 0.0% |
| Italy | 82,094 | 0.0% |
| Morocco | 34,206 | 0.0% |
| Taiwan | 34,206 | 0.0% |
| United Kingdom | 27,365 | 0.0% |
| Barbados | 6,841 | 0.0% |
| Yugoslavia | 6,841 | 0.0% |
| Algeria | - | 0.0% |
| Angola | - | 0.0% |
| Australia | - | 0.0% |
| Bangladesh | - | 0.0% |
| Brazil | - | 0.0% |
| Bulgaria | - | 0.0% |
| Cameroon | - | 0.0% |
| Chile | - | 0.0% |
| Congo | - | 0.0% |
| Cote d'Ivoire | - | 0.0% |
| Cuba | - | 0.0% |
| Democratic Republic of Congo | - | 0.0% |
| Denmark | - | 0.0% |
| Gabon | - | 0.0% |
| Ghana | - | 0.0% |
| Greece | - | 0.0% |
| Guatemala | - | 0.0% |
| Israel | - | 0.0% |
| Kuwait | - | 0.0% |
| Libya | - | 0.0% |
| Mongolia | - | 0.0% |
| Netherlands | - | 0.0% |
| New Zealand | - | 0.0% |
| Nigeria | - | 0.0% |
| Norway | - | 0.0% |
| Oman | - | 0.0% |
| Pakistan | - | 0.0% |
| Philippines | - | 0.0% |
| Qatar | - | 0.0% |
| Spain | - | 0.0% |
| Suriname | - | 0.0% |
| Sweden | - | 0.0% |
| Syria | - | 0.0% |
| Thailand | - | 0.0% |
| Tunisia | - | 0.0% |
| Turkey | - | 0.0% |
| United Arab Emirates | - | 0.0% |
The data comes from Our World In Data and has been converted from TWh to Barrels.


Clive Conway says
With regard to the 1939 oil producers map, Nazi Germany wasn’t ever a country. Would a map have Republican USA on it, or Conservative UK?