
Both the orange and blue areas each contribute 50% of America’s GDP.
From the author:
Making Sense Of The World, One Map At A Time
Both the orange and blue areas each contribute 50% of America’s GDP.
From the author:

The map above shows what Trump’s failed peace plan for Israel & Palestine called the Peace to Prosperity: A Vision to Improve the Lives of the Palestinian and Israeli People would have looked like.
From the map:
Here’s what you need to know:

The plan was to buy time to secure defenses before the US could strike back.
Ultimately the plan assumed that help from the United Kingdom and the rest of the Empire would come.
From the map:

The map above provides a detailed geographic overview of income inequality across the Nordic Region, illustrating differences in both income levels and distribution patterns.
Some regional variations, such as border effects, are attributed to incomplete income data from neighboring countries.

The countries in red: South Africa, Lesotho and Eswatini (formerly Swaziland) have the same number of murders (22,071) each year than all the areas in blue (22,069).
This includes all of Europe, Canada, Australia, Japan, South Korea, Indonesia, Vietnam, Saudi Arabia as well as several Western and Midwest US Sates and a few other places to get the totals to match.
However, there’s something even more more shocking.

Here are the key observations:
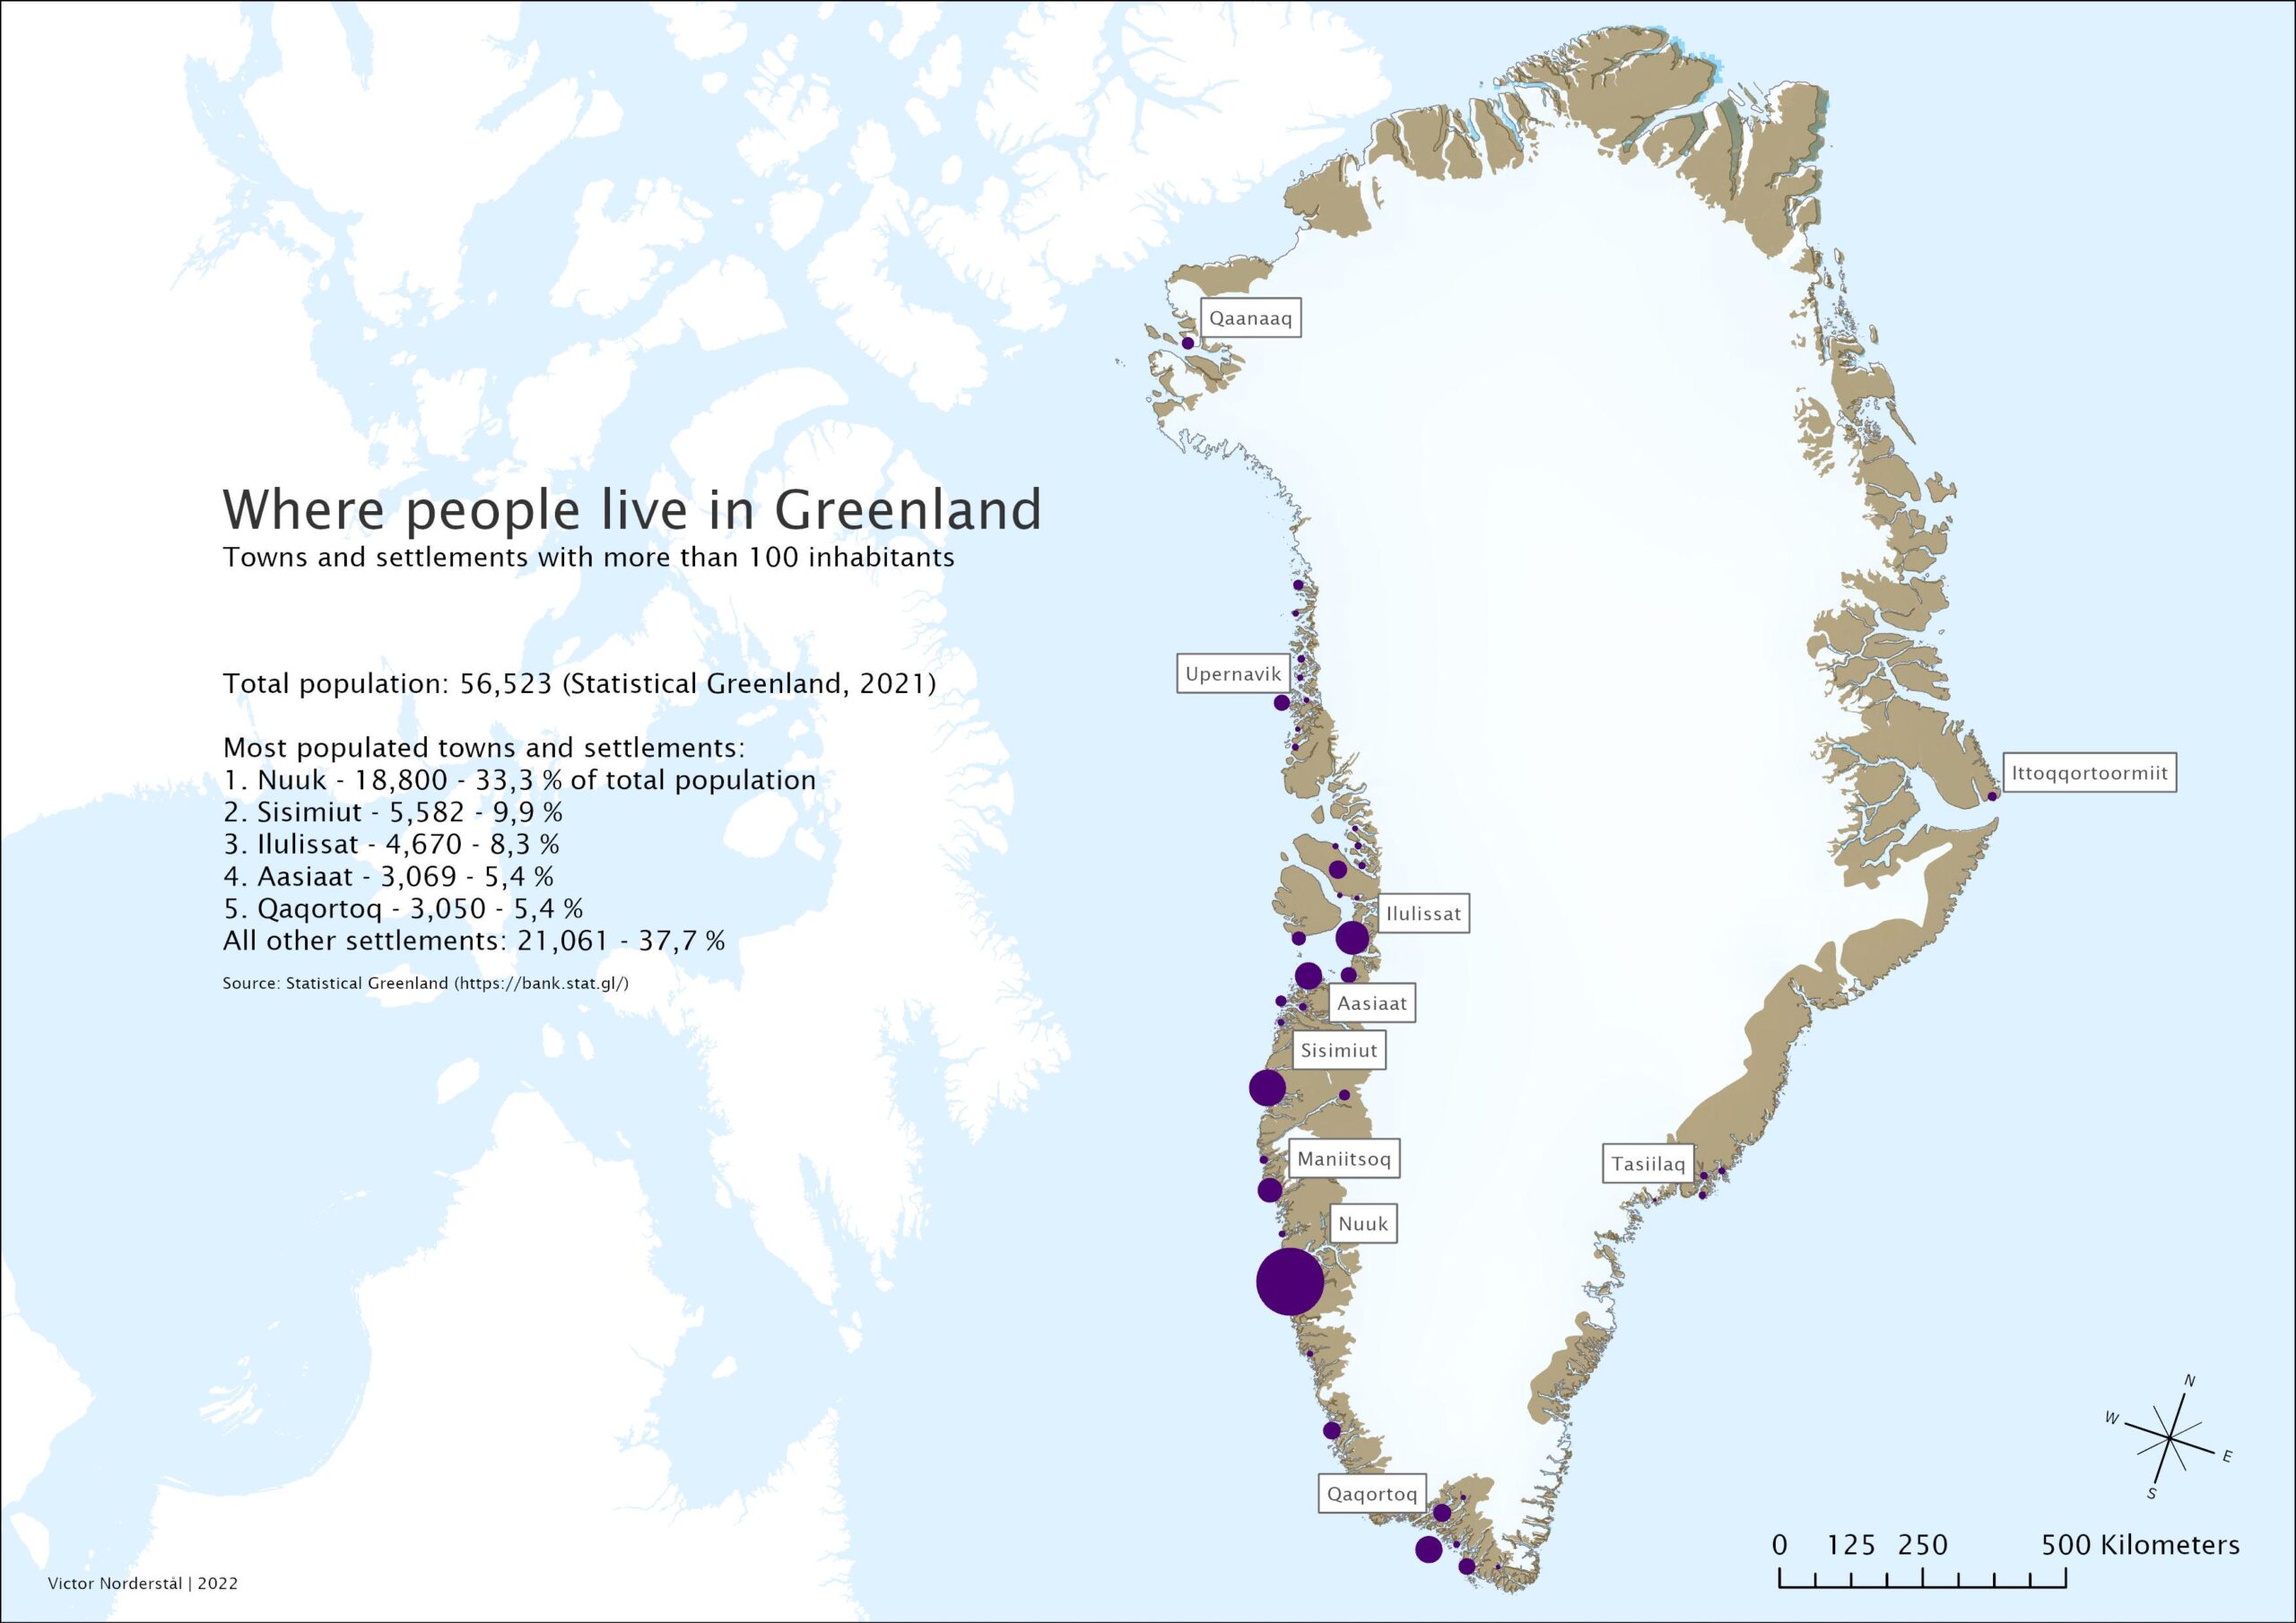
The maps below show how skewed population concentrations are in various countries around the world from Egypt to China to Canada and the United States (at the bottom).
But before continuing I’m not exactly sure who created the original maps, so if you know please leave a comment and let me know so I can give proper credit.
Also the population figures are slightly too low for most countries so I suspect the maps are a few years old.


