“I created a NCAA map that consists of every D1 D2 and D3 team in the country. Took me around 3 weeks to complete.”
Making Sense Of The World, One Map At A Time
“I created a NCAA map that consists of every D1 D2 and D3 team in the country. Took me around 3 weeks to complete.”
The maps below all come this CIA album on Flicker. They describe the maps in the following ways:
The Cartography Section of General William Donovan’s Office of Strategic Services (OSS) produced some 8,000 hand-drawn maps and 64 plaster topographic 3-D models in support of the war effort. Many of their products played crucial roles in the planning and execution of major military operations in the European, North African, and Asian Theaters.
And here are the 22 maps:
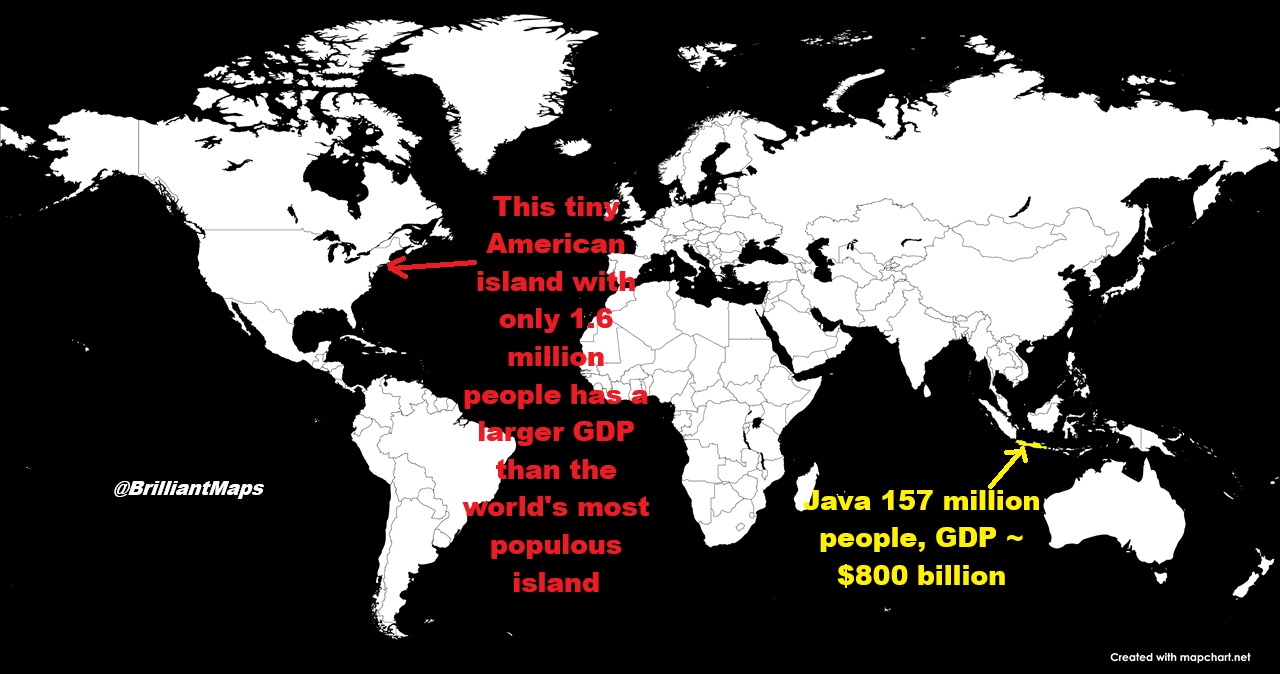
The map above above shows a surprising fact. Manhattan has an estimated total GDP just over $1 trillion USD but only 1,665,510 residents meaning GDP per capita is a staggering $604,619.
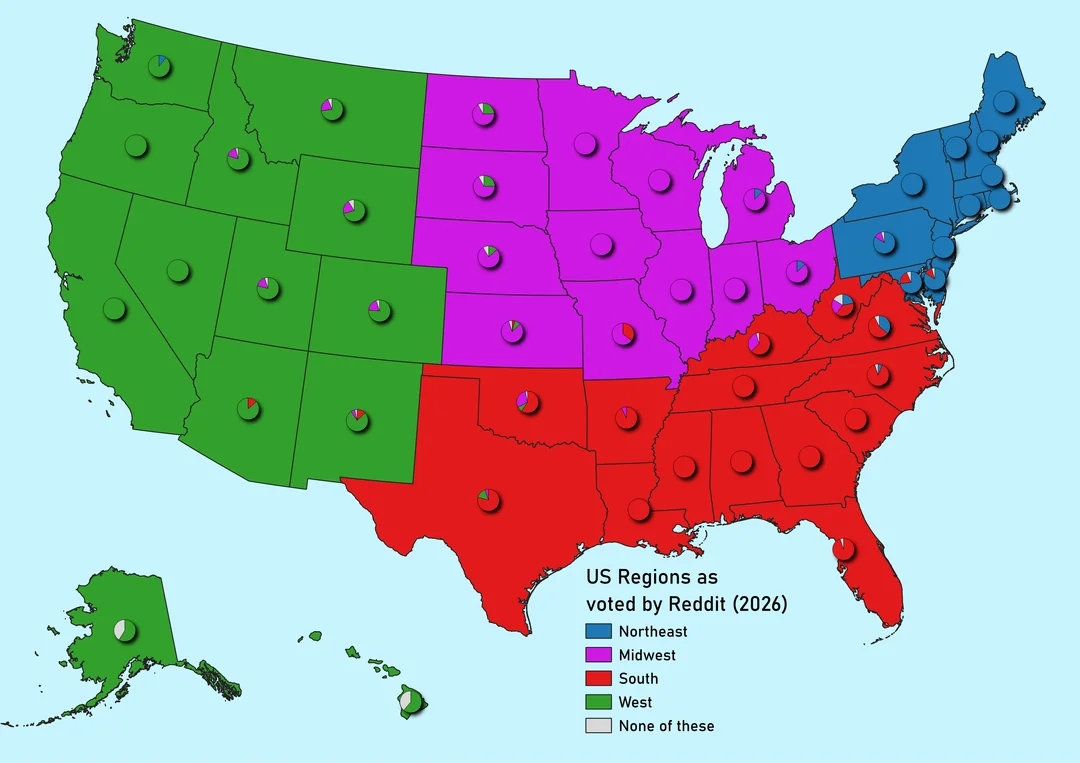
All of these maps come from reddit user DM_me_fun_stuff_pls who also did a survey on 24 Ways Redditors Would Divide Europe.
For these maps he explains:
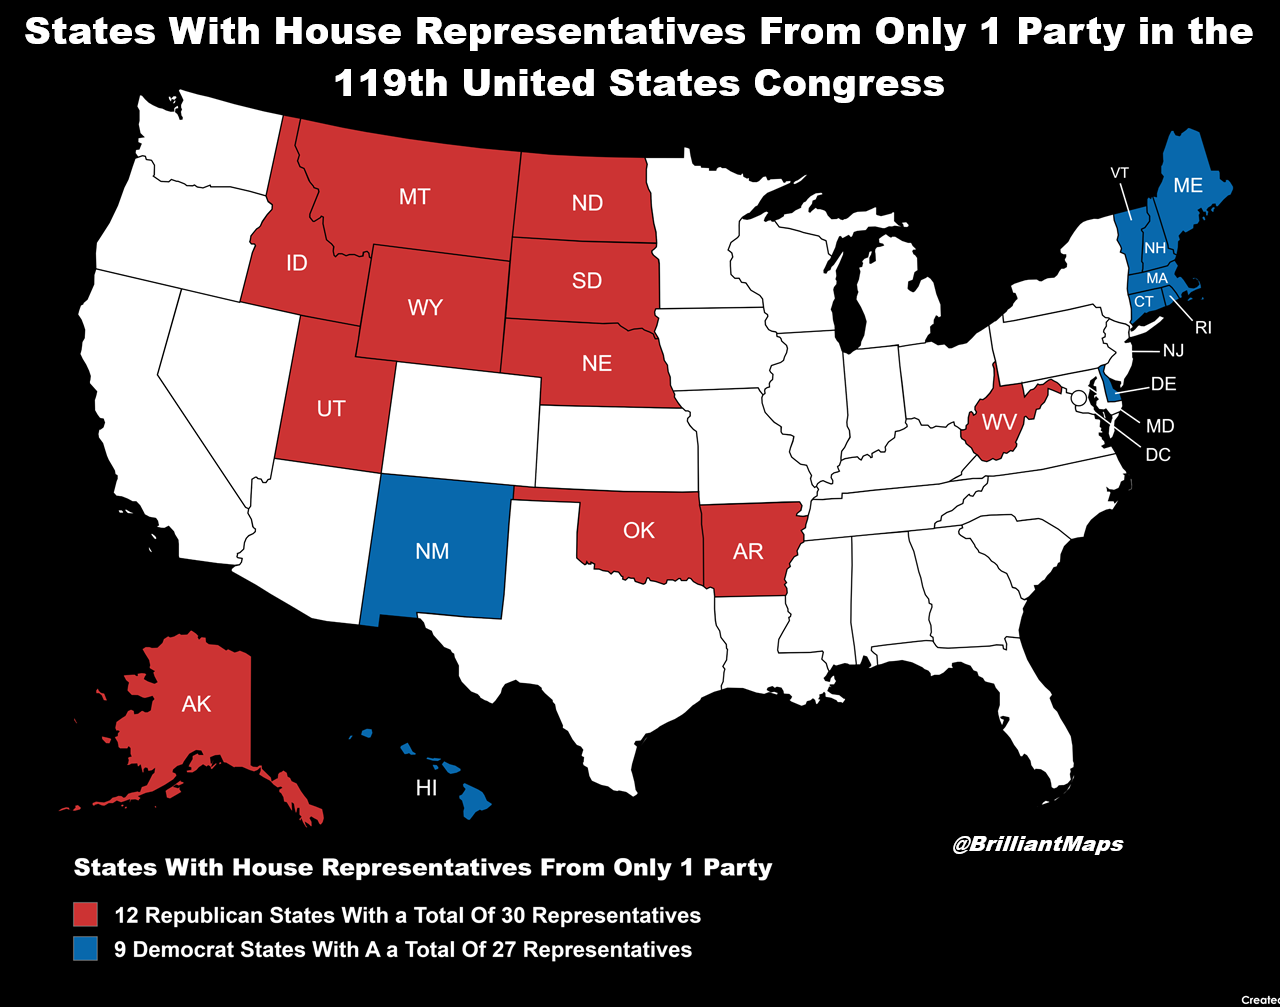
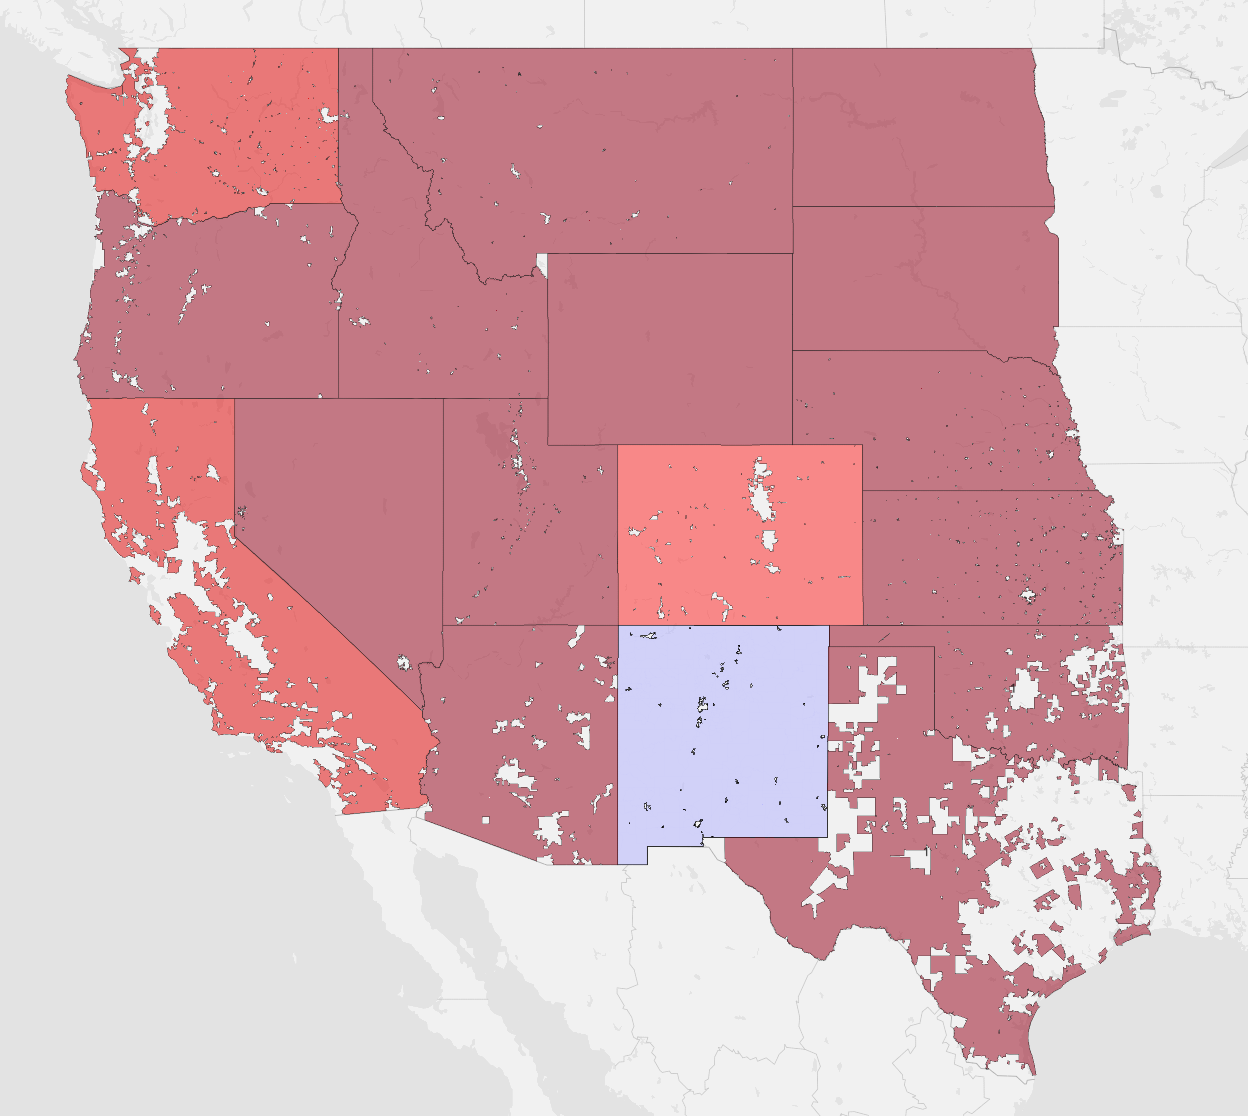
The map above shows which US states have House Representatives from only 1 party as of the 119th Us Congress. Below is a full list of numbers for all states:
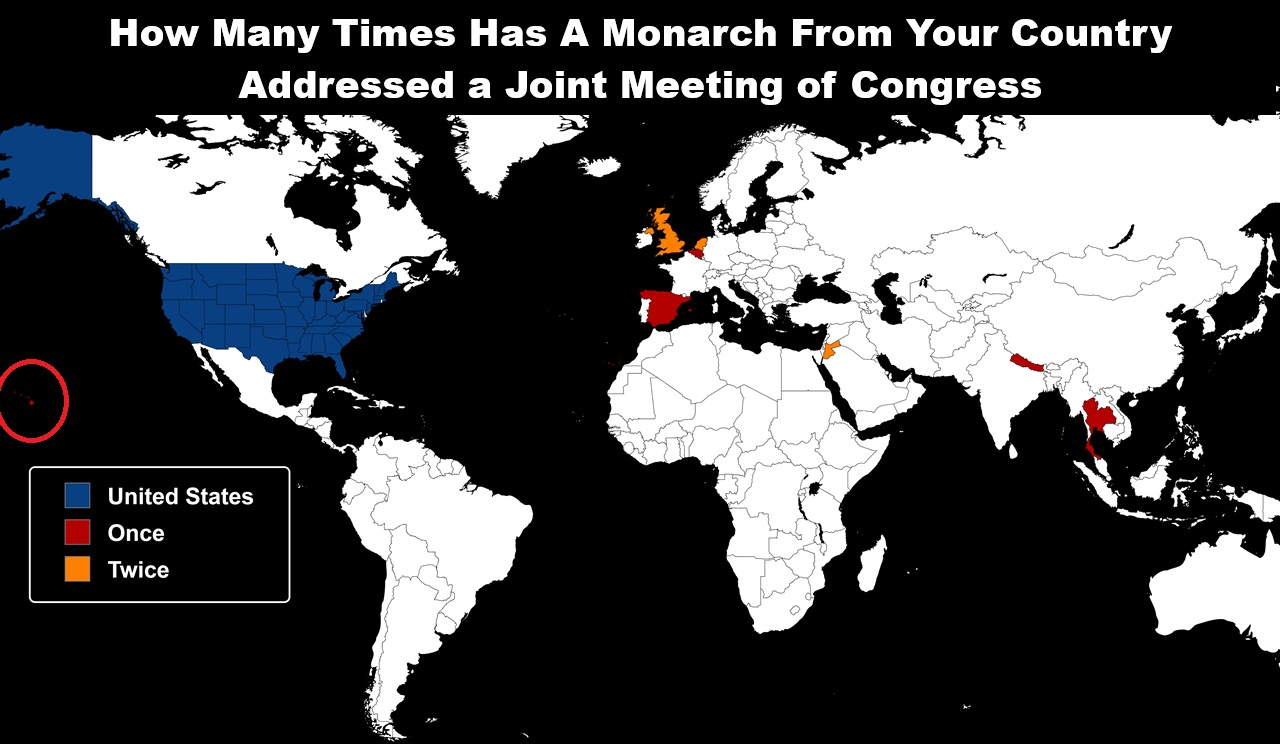
The map above shows how many Monarchs (Kings & Queens) have addressed a joint meeting of the US Congress throughout history, and I’m surprised how low the numbers are. According to Congress.gov: King Charles is the 11th king or queen to address a joint meeting of Congress.
The others in order are:
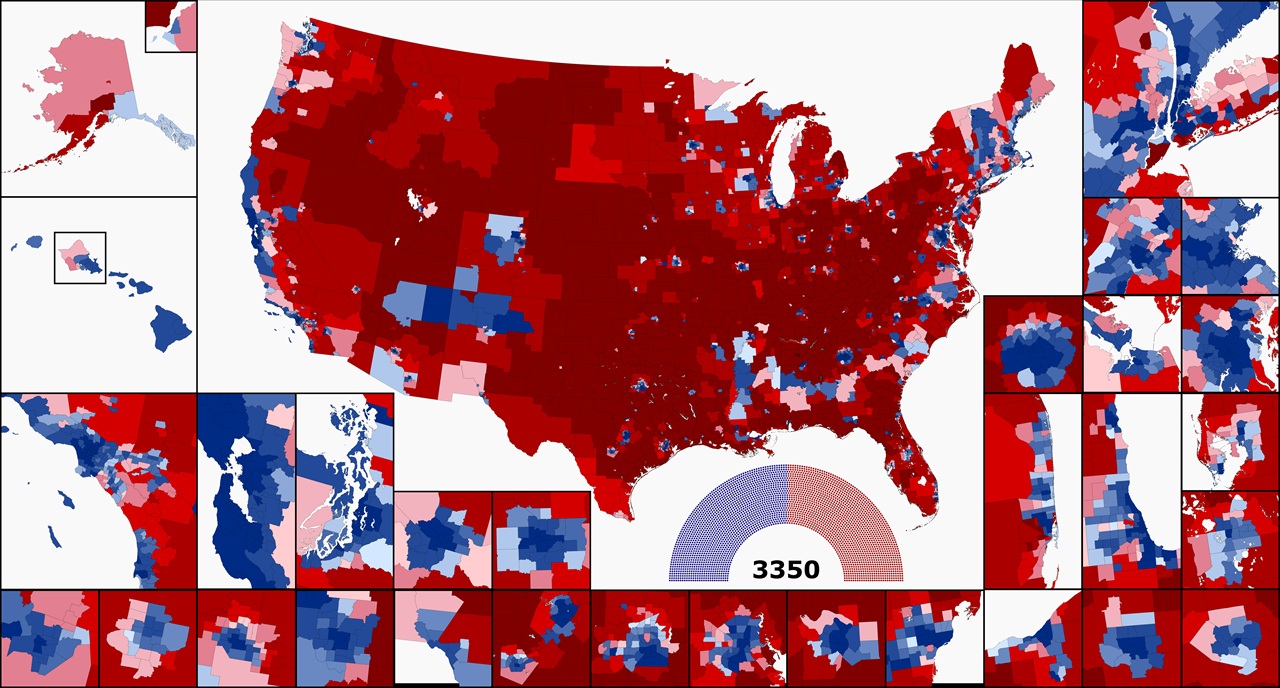
The map above shows what the US House would look like if it had 100k people per district vs the over 750k people per district today.
Overall, you’d have a house with 3,350 members, which in this map would mean 1692 Democrats and 1658 Republicans.
About the inserst:
The following maps were all created by reddit user DM_me_fun_stuff_pls who explains:
After my last post on the Regions of Europe, a week ago, I have gotten over 200 responses on my survey on it, thank you for that! So here are the results of the survey.
Notes on the Survey and Map: Each category is normalized to the most voted country in each category. So 100% does not mean every single respondent chose this country but that it was the most chosen (although most of the times it was close).
It would probably be great and interesting to go into a lower level of subdivisions for some of these Regions, but honestly I don’t know how I would go about doing a survey for that, that is not a complete chore to respond to…