
Below is the translation of the Italian terms into English:
Making Sense Of The World, One Map At A Time
Below is the translation of the Italian terms into English:

This map is often cited as one of the best examples of data visualization due to its detailed and multidimensional portrayal of information. And statistician professor Edward Tufte described the graphic as what “may well be the best statistical graphic ever drawn.”
Here are the key elements of the graphic:
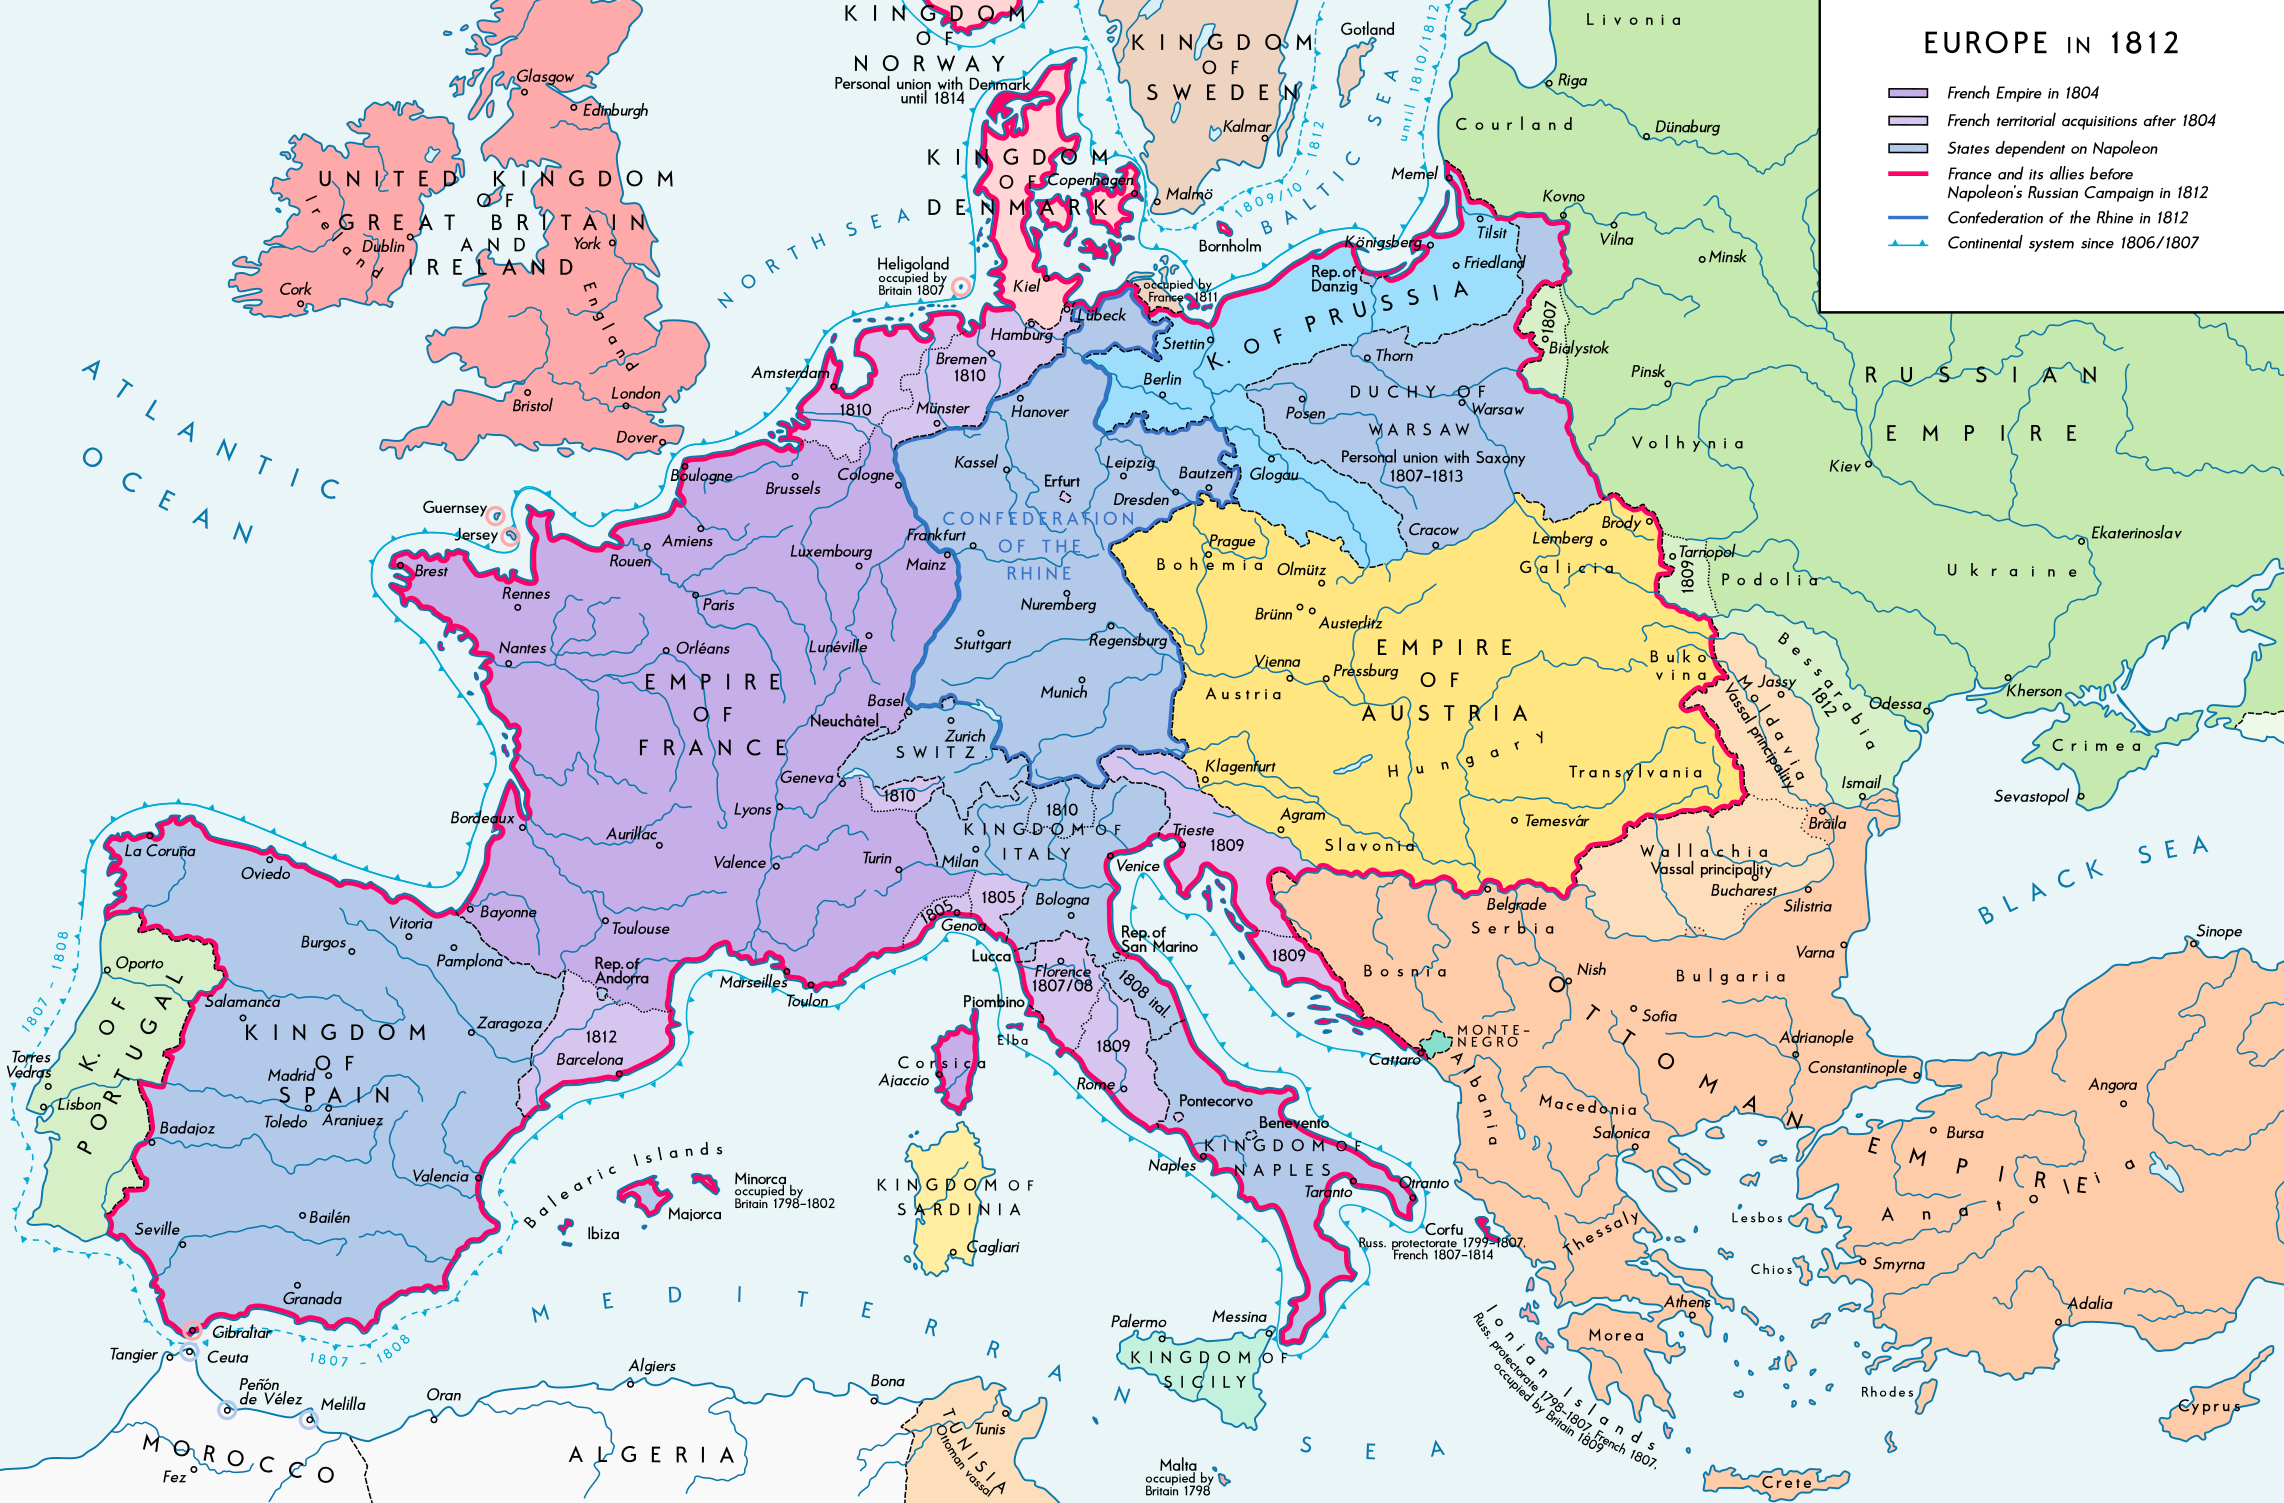
The boundaries and political entities shown are reflective of the territorial changes brought about by Napoleon Bonaparte’s conquests and alliances.
Here are some key details:

The color-coded legend indicates varying degrees of certainty, with darker colors representing higher percentages and lighter colors representing lower percentages.


The map displays the percentage of 15-29 year olds employed in various regions of Europe in 2023.
It uses a color gradient to indicate the employment rates, with darker blue representing higher employment rates and darker red representing lower employment rates.
The data comes from Eurostat.
Some key facts:

Data comes from Worldslargestthings.com.
Here’s the largest item from each state based on the map:


The color coding represents different nationalities:
Here is the detailed information for each German state based on the map:

In spite of numerous requests, TfL is refusing to disclose the location of the cameras. (So much for FOI)
The aim of this page is to crowd-source the location of cameras across the zone.
So if you have seen one on your travels, post it here so we can create our own map.
You can see an interactive version here: