
Jefferson Davis was easily elected with 97% of the vote (47,057 votes) and all 109 electoral college votes. His vice-president Alexander Stephens got 3.02% of the popular vote (1,465 votes).
Making Sense Of The World, One Map At A Time
Jefferson Davis was easily elected with 97% of the vote (47,057 votes) and all 109 electoral college votes. His vice-president Alexander Stephens got 3.02% of the popular vote (1,465 votes).

This map from the National Atlas of the United States of America shows the distribution of federal lands and Indian reservations across the United States. T
The legend indicates the different types of federal land management and their corresponding colors on the map.
Here’s what each color represents:

The map above shows the two countries that have lost wars to actual birds (losing wars to Turkey doesn’t count). To learn more about each see below:

The map highlights that most Australian states have a higher population of kangaroos compared to humans, except for Victoria and Tasmania where the human population exceeds the kangaroo population.
Here is the information for each Australian state:

This map visually compares the territorial extents of the British Empire and the Mongol Empire at their respective peaks.

Below is the translation of the Italian terms into English:

This map is often cited as one of the best examples of data visualization due to its detailed and multidimensional portrayal of information. And statistician professor Edward Tufte described the graphic as what “may well be the best statistical graphic ever drawn.”
Here are the key elements of the graphic:
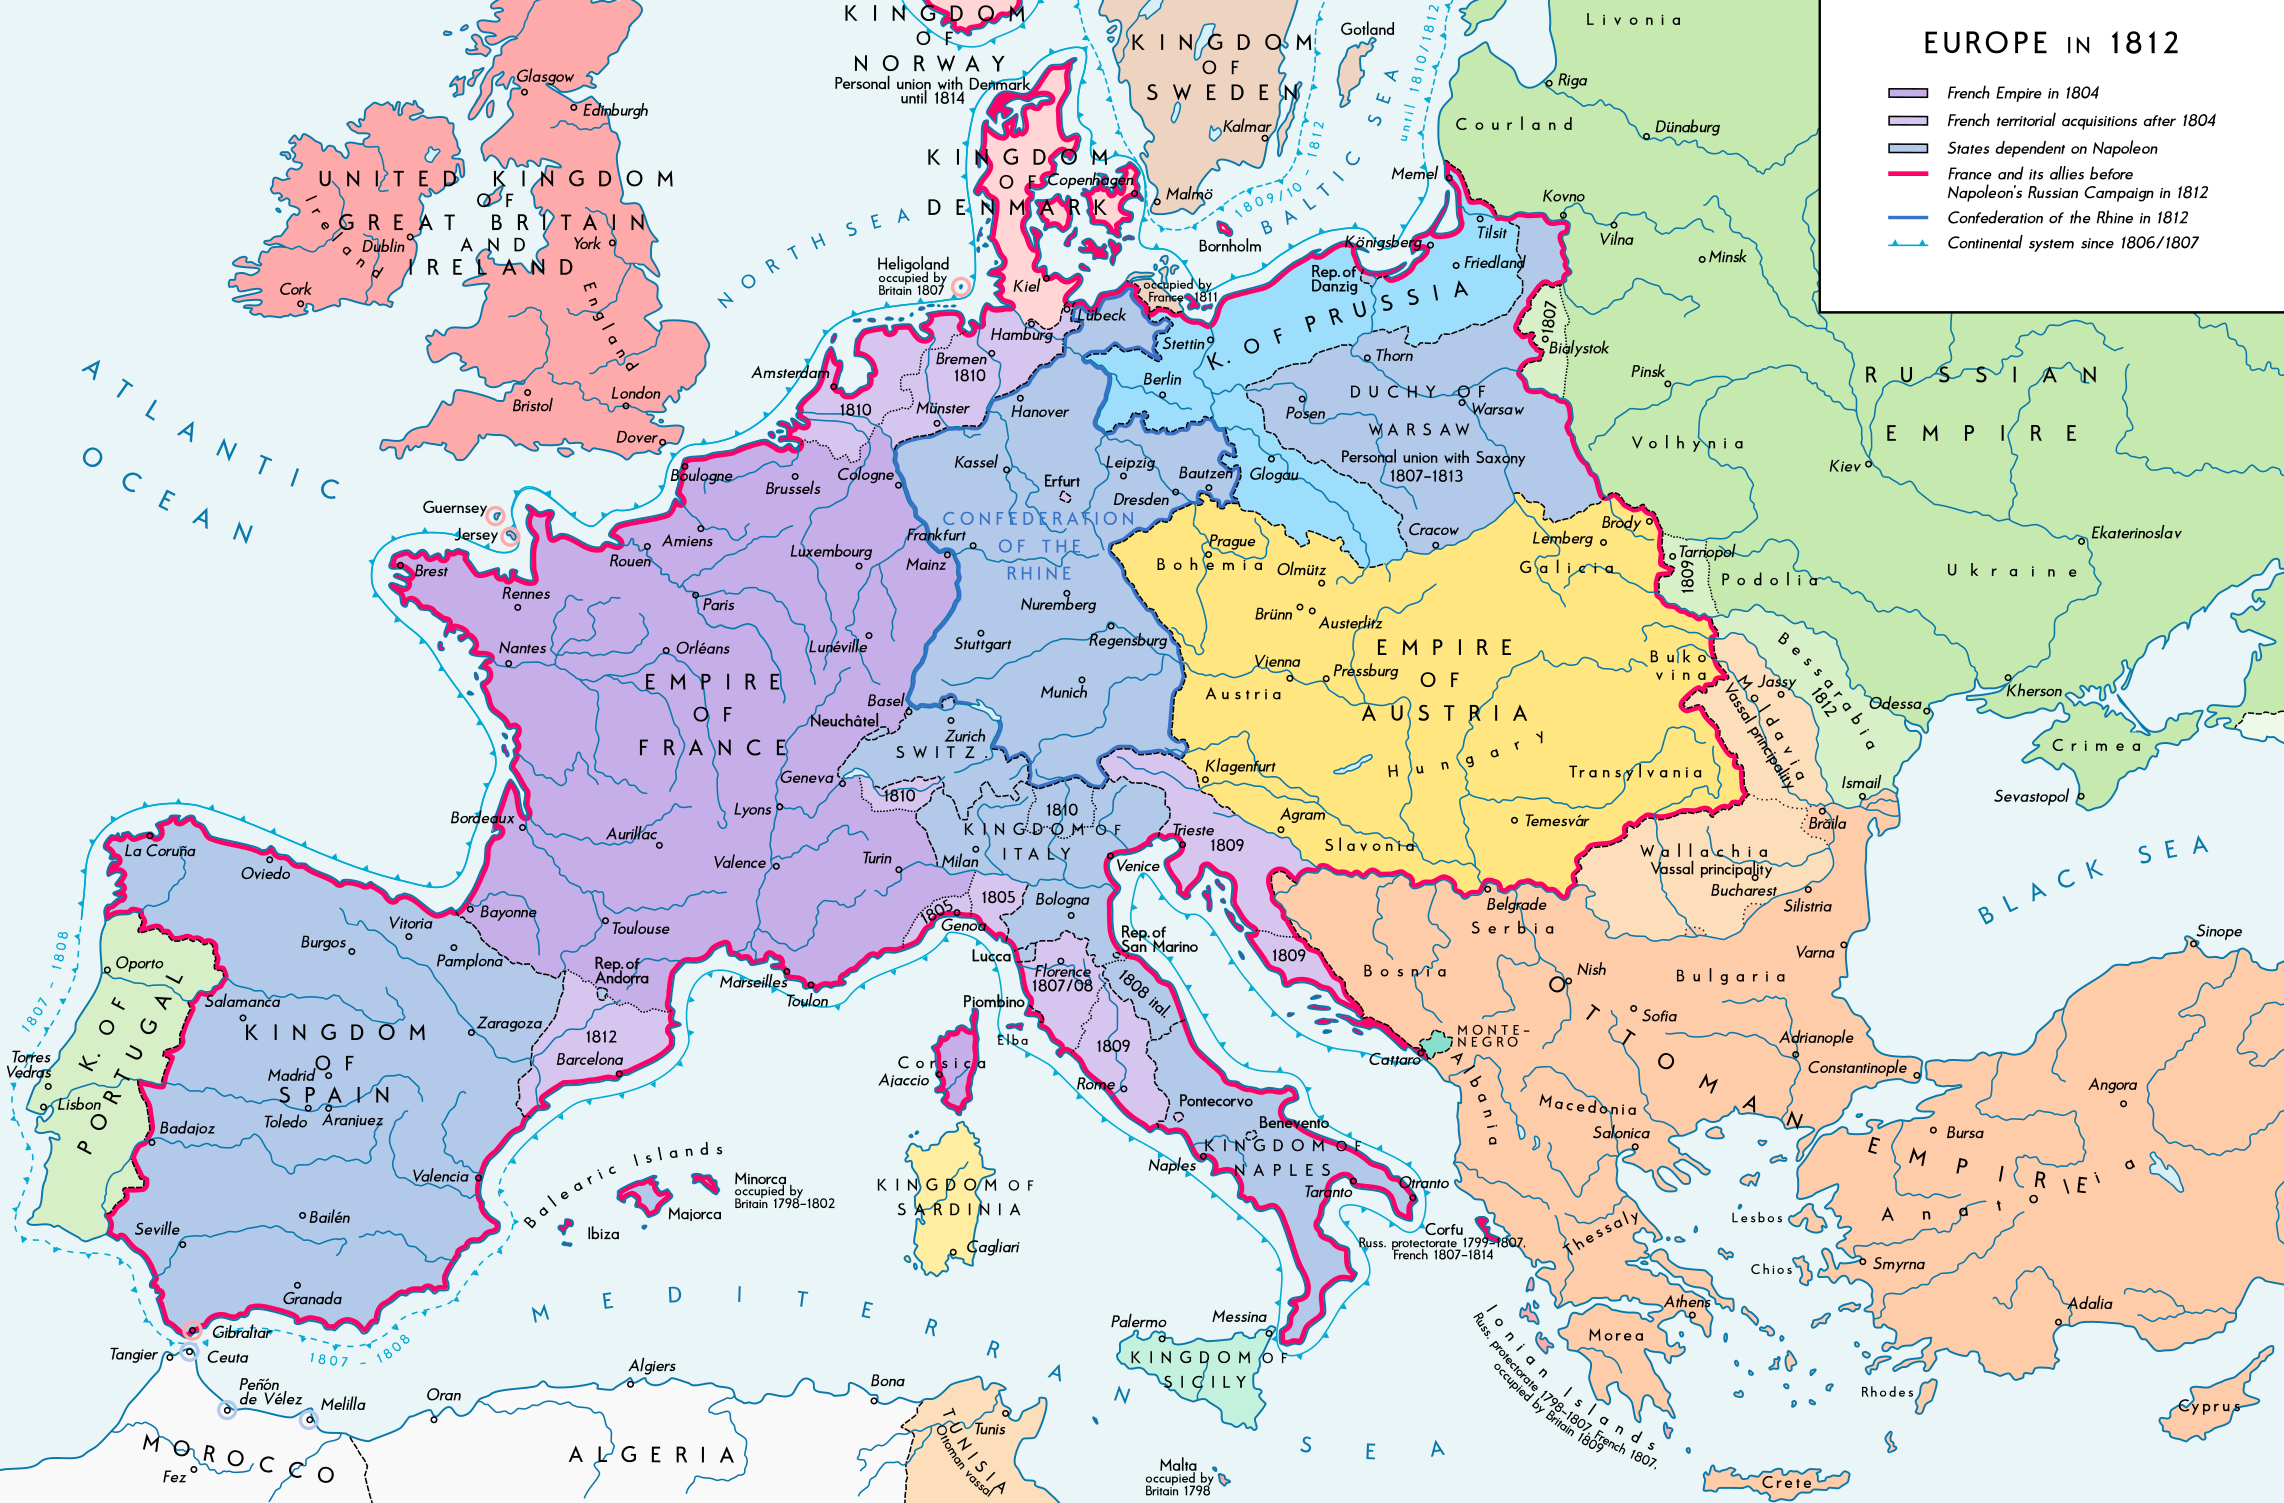
The boundaries and political entities shown are reflective of the territorial changes brought about by Napoleon Bonaparte’s conquests and alliances.
Here are some key details:

The color-coded legend indicates varying degrees of certainty, with darker colors representing higher percentages and lighter colors representing lower percentages.
