The video above shows the growth of the United States from the founding of Jamestown in 1607 right to the revolutionary war right up until 2022.
And here’s a Satellite version of the map:
Making Sense Of The World, One Map At A Time
The video above shows the growth of the United States from the founding of Jamestown in 1607 right to the revolutionary war right up until 2022.
And here’s a Satellite version of the map:
The video above was created by YouTuber EmperorTigerstar and shows Every other day of the American Revolutionary War.
You can also watch a speed up version below:

This map visually compares the territorial extents of the British Empire and the Mongol Empire at their respective peaks.

Below is the translation of the Italian terms into English:

This map is often cited as one of the best examples of data visualization due to its detailed and multidimensional portrayal of information. And statistician professor Edward Tufte described the graphic as what “may well be the best statistical graphic ever drawn.”
Here are the key elements of the graphic:
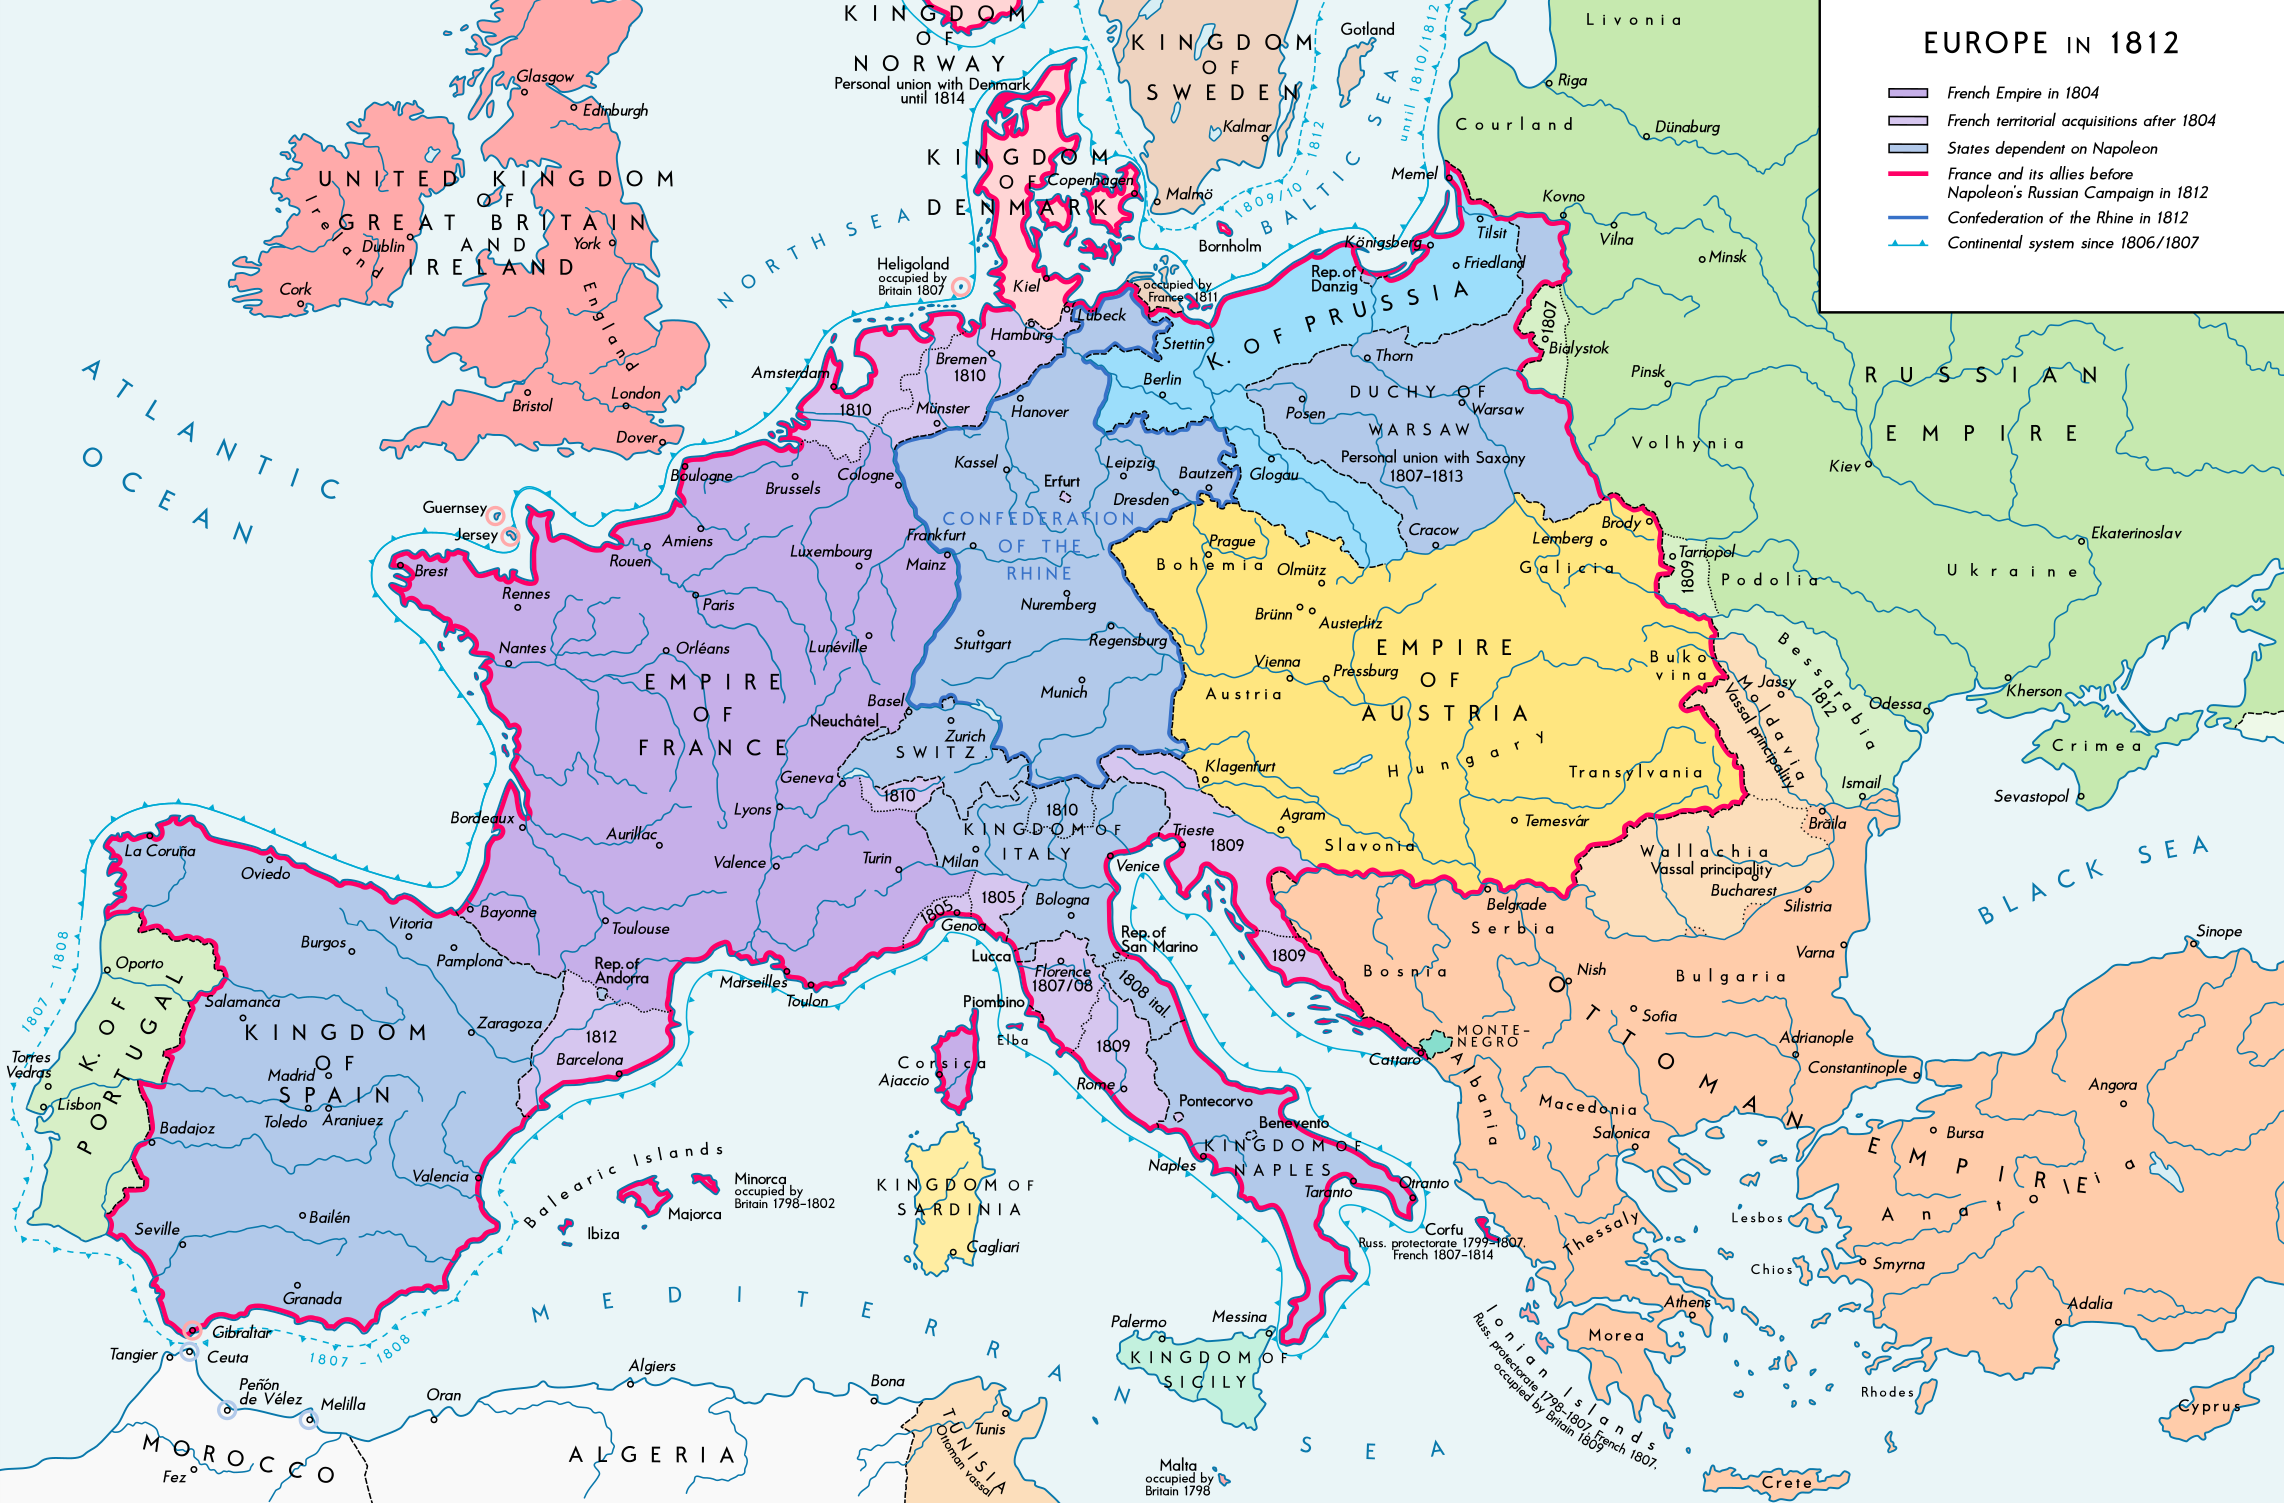
The boundaries and political entities shown are reflective of the territorial changes brought about by Napoleon Bonaparte’s conquests and alliances.
Here are some key details:
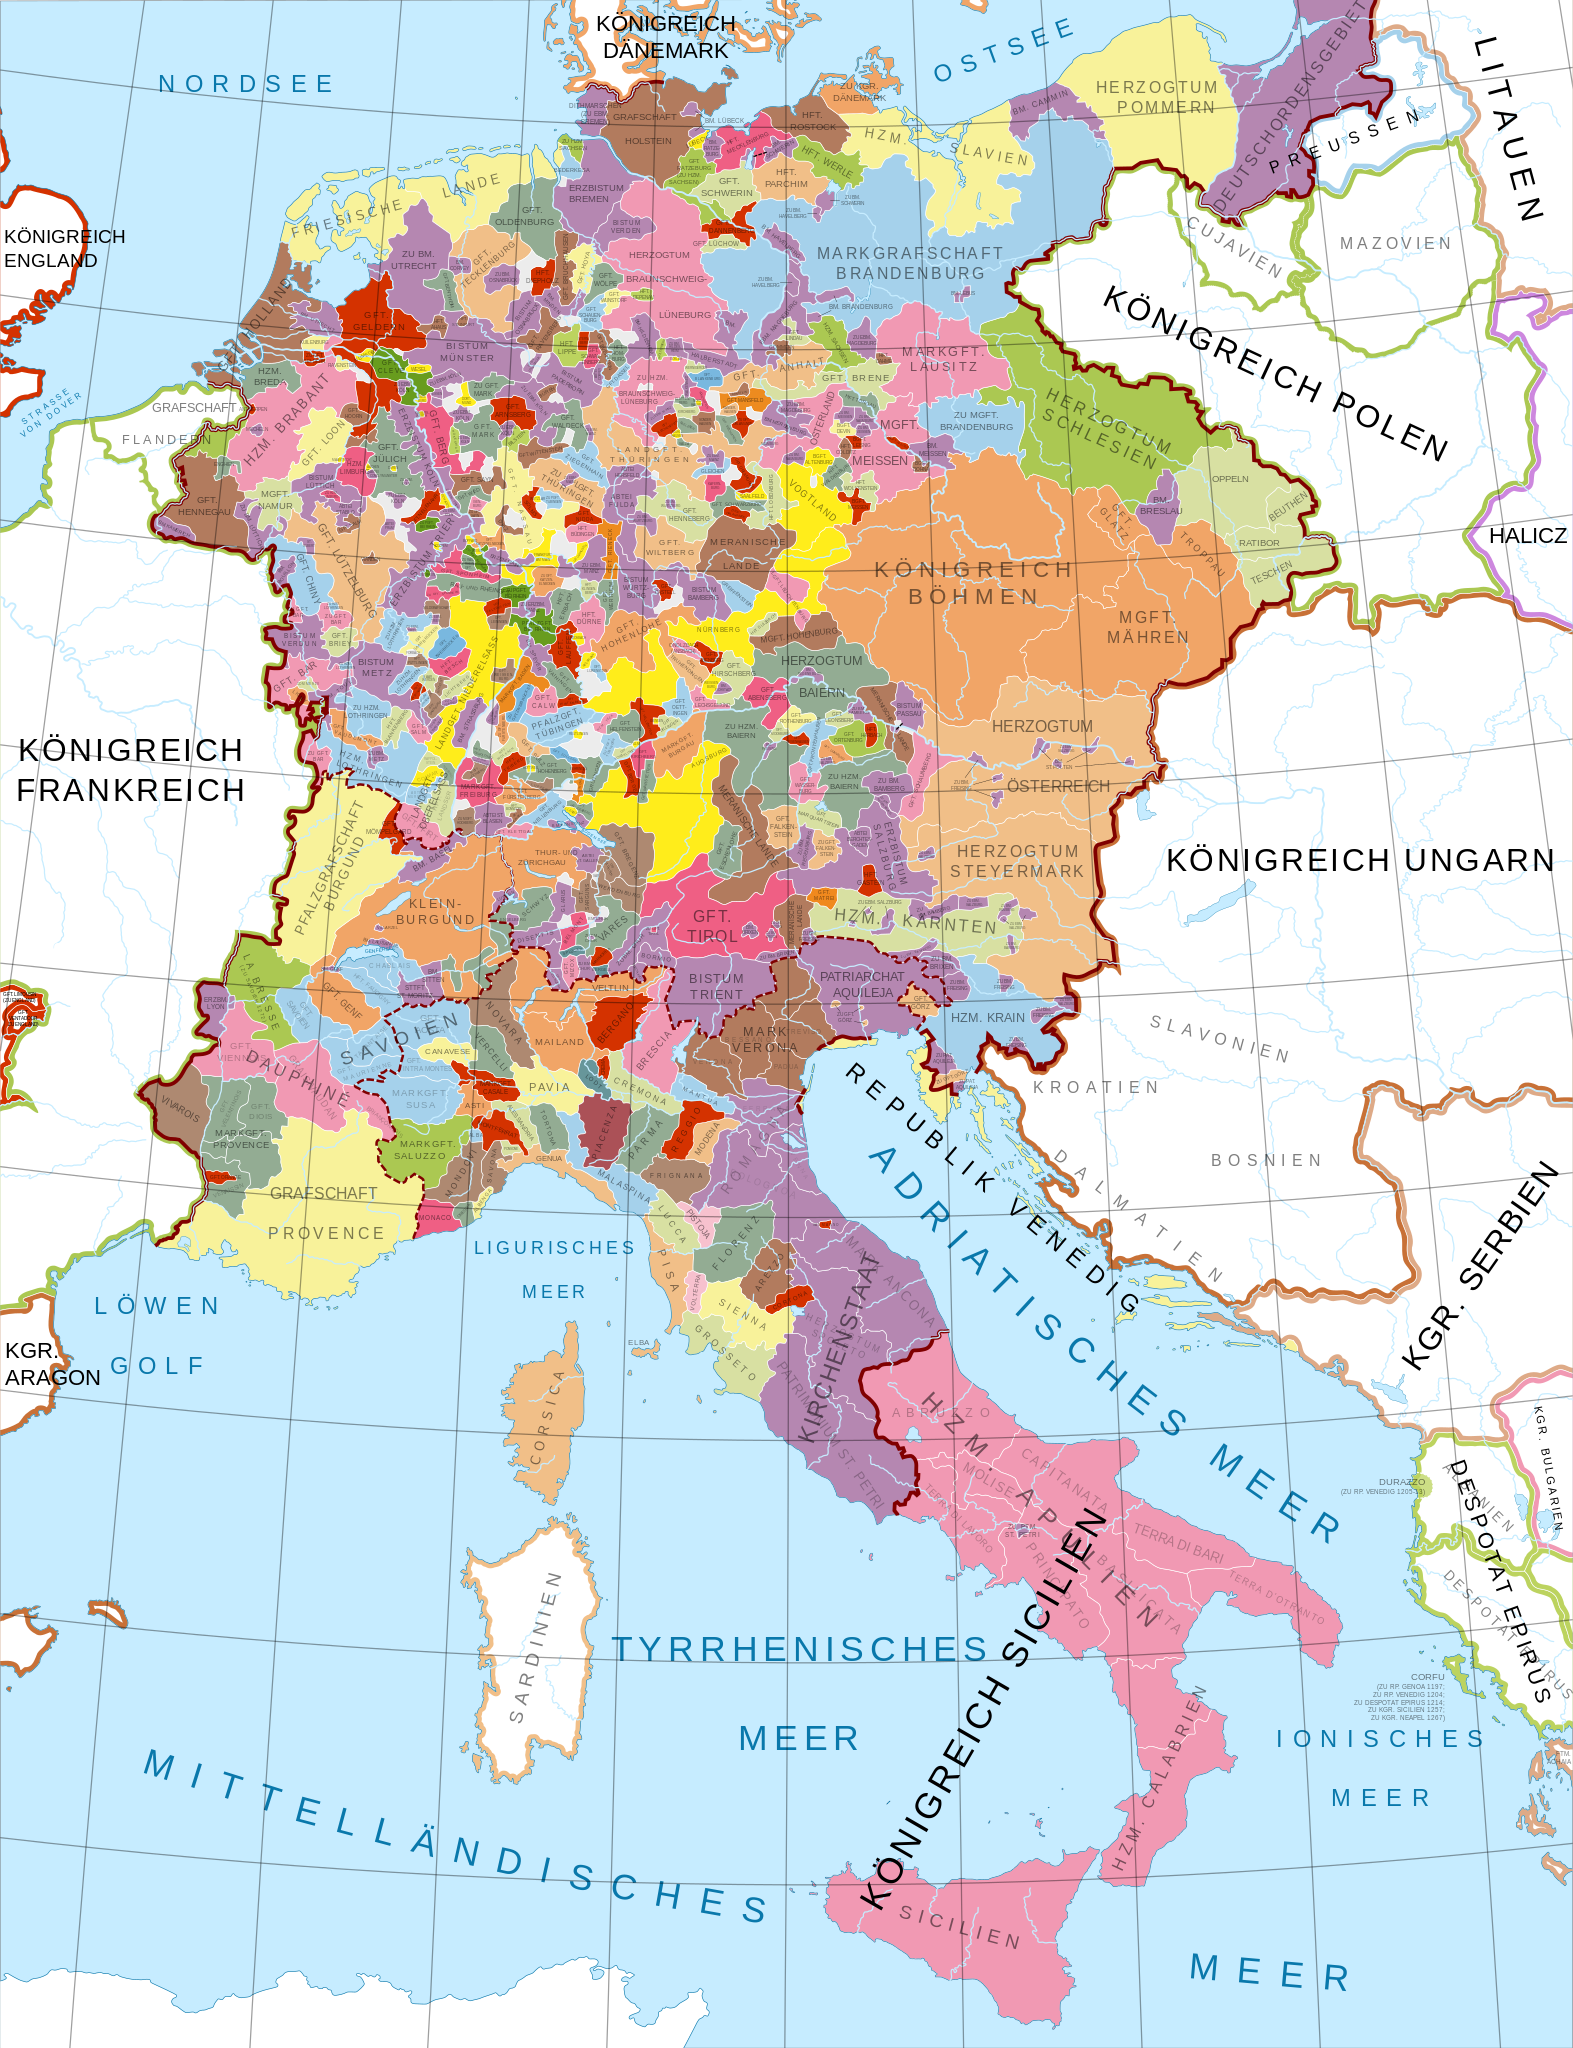
Here are some key points about this era:

The map above clearly shows when Egypt has and hasn’t been ruled by Egyptians. Overall, it’s been ruled by Egyptians for 2,194 years (42.8% of the time) and non-Egyptians for 2,930 years (57.2%) of the time.
The map above shows how long the Ottoman Empire ruled the various parts of the Western Balkans. Some regions were ruled for over 500 years, whereas others were ruled for less than a century and some were never conquered at all.
