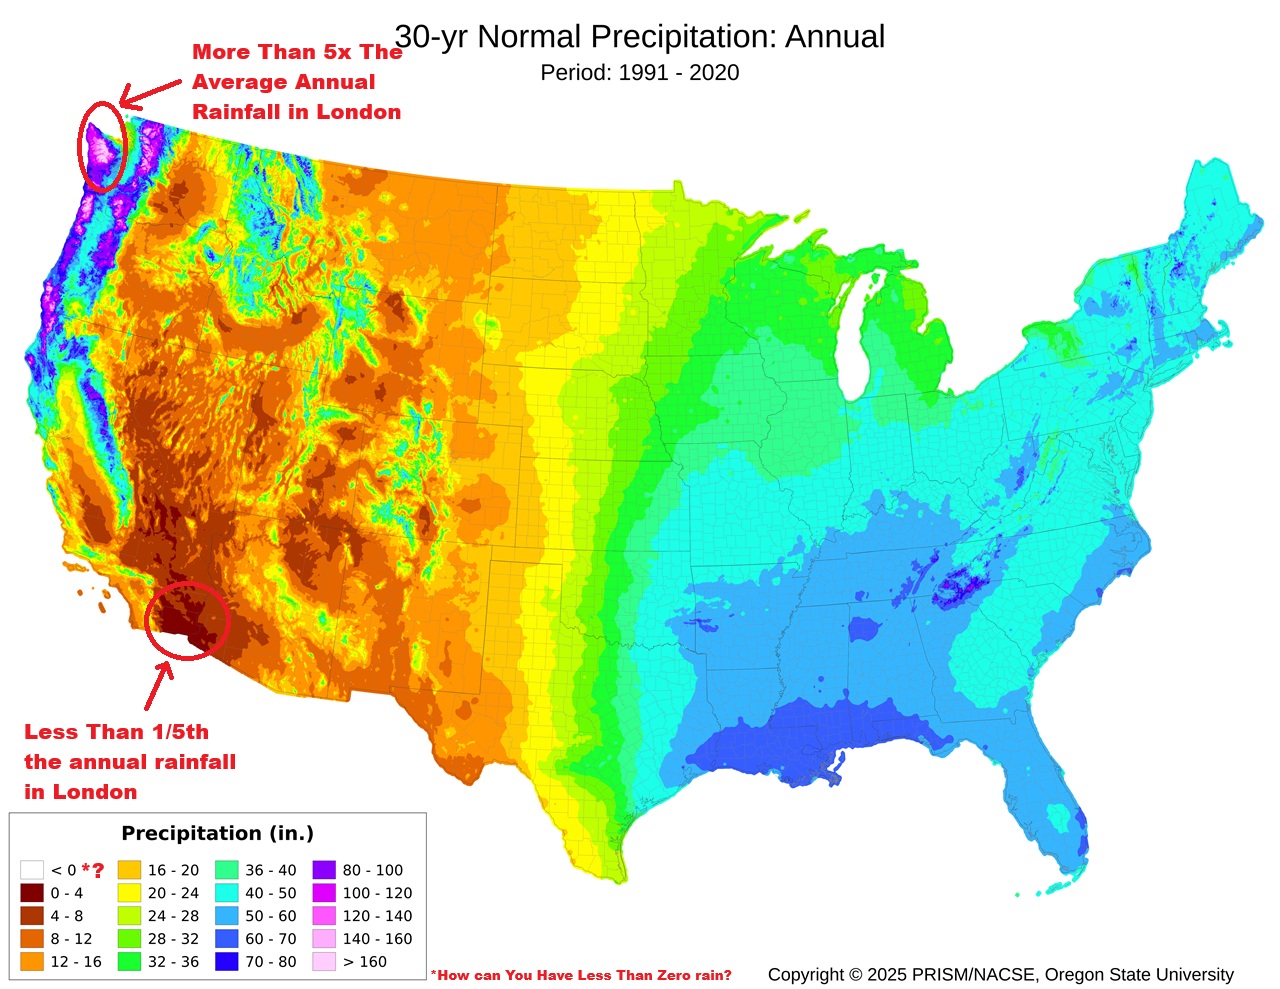
It shows long-term “normal” precipitation totals, measured in inches per year.
More about it:
General U.S. Precipitation Patterns
- Western U.S. (especially the Southwest):
- Very dry, much of Nevada, Utah, Arizona, and eastern California receive less than 8 inches per year (shown in dark brown to red).
- The deserts of the Southwest (e.g., Death Valley) are among the driest areas in North America.
- Pacific Coast & Mountains:
- The Pacific Northwest (western Washington and Oregon) and the Sierra Nevada in California are extremely wet, often over 80 inches, with some coastal and mountain regions exceeding 160 inches annually (purple and pink shades).
- This is due to moist air from the Pacific Ocean rising over coastal mountain ranges.
- Great Plains:
- Precipitation increases steadily from west to east, ranging from 10 inches in the west to 40 inches near the Mississippi River.
- This gradient reflects the rain shadow of the Rockies and the gradual increase in moisture from Gulf of Mexico influence.
- Eastern U.S.:
- Much wetter, the Southeast, Gulf Coast, and Appalachians receive 40–80 inches per year, with some spots in the southern Appalachians exceeding 80 inches.
- The Northeast and Midwest average around 30–45 inches annually.
- Overall Range:
- The U.S. spans an enormous range: from <4 inches/year in deserts to >160 inches/year in Pacific coastal mountains.
Comparison to London & the UK
| Location | Avg. Annual Precipitation | Comparison to U.S. |
|---|---|---|
| London | ~23 inches (≈580 mm) | Similar to U.S. regions in eastern Colorado or Nebraska, or parts of the northern Great Plains, relatively dry compared to most of the eastern U.S. |
| UK average | ~45 inches (≈1150 mm) | Roughly equivalent to eastern U.S. states like Tennessee, Kentucky, or Pennsylvania, moderate rainfall, wetter than most of the continental interior U.S., but far drier than the U.S. Pacific Northwest. |
| Wettest parts of UK (e.g., western Scotland, Snowdonia, Lake District) | 100–180 inches (2500–4500 mm) | Comparable to the wettest U.S. regions like the Olympic Peninsula in Washington State. |
| Driest parts of UK (e.g., East Anglia, southeast England) | 20–25 inches (500–650 mm) | Comparable to central Great Plains or interior California valleys, relatively dry |
- The average U.S. rainfall is broadly similar to that of the UK, but the range is vastly larger due to geography, from deserts to rainforests.
- London is much drier than most of the eastern U.S., with precipitation comparable to semi-arid areas of the western U.S.
- The UK as a whole has rainfall amounts similar to the humid eastern and southern U.S., but lacks the extreme dry or wet zones that the U.S. has due to its smaller size and maritime climate.


Y.D. Robinson says
The UK pattern looks broadly like the New Zealand pattern, London is pretty similar to Christchurch (and the South East plus East Anglia to the Canterbury Plain), and western Scotland or the Lake District or Snowdonia are pretty similar to the South Island west coast (e.g. Hokitika). Of course, unlike the UK, New Zealand (particularly the South Island) has lofty snowcapped mountains that are over 3,000 metres tall.