The following maps all come from data taken from Special Eurobarometer 545 Gender Stereotypes published in early 2024.
And it should be noted the surveys included both men and women in roughly equal number.
The full methodology can be found here.
I’ve published the maps below along with the underlying data so you can make your own conclusions:
Feminism has “gone too far” (%)

The data by country:
| Country | Total 'Agree' | Total 'Disagree' | Totally agree | Tend to agree | Tend to disagree | Totally disagree | It depends (SPONTANEOUS) | Don't know |
|---|---|---|---|---|---|---|---|---|
| European Union (EU27) | 45% | 48% | 17% | 28% | 28% | 20% | 2% | 5% |
| Belgium | 47% | 50% | 16% | 31% | 31% | 19% | 1% | 2% |
| Bulgaria | 44% | 35% | 17% | 27% | 26% | 9% | 9% | 12% |
| Czechia | 52% | 40% | 21% | 31% | 28% | 12% | 2% | 6% |
| Denmark | 48% | 42% | 21% | 27% | 17% | 25% | 4% | 6% |
| Germany | 34% | 56% | 12% | 22% | 29% | 27% | 4% | 6% |
| Estonia | 54% | 27% | 23% | 31% | 19% | 8% | 4% | 15% |
| Ireland | 47% | 43% | 18% | 29% | 26% | 17% | 2% | 8% |
| Greece | 49% | 45% | 21% | 28% | 30% | 15% | 2% | 4% |
| Spain | 53% | 43% | 27% | 26% | 22% | 21% | 1% | 3% |
| France | 54% | 39% | 21% | 33% | 22% | 17% | 1% | 6% |
| Croatia | 44% | 49% | 14% | 30% | 32% | 17% | 3% | 4% |
| Italy | 48% | 49% | 18% | 30% | 30% | 19% | 1% | 2% |
| Cyprus | 63% | 30% | 35% | 28% | 20% | 10% | 1% | 6% |
| Latvia | 51% | 31% | 21% | 30% | 22% | 9% | 2% | 16% |
| Lithuania | 49% | 34% | 22% | 27% | 25% | 9% | 3% | 14% |
| Luxembourg | 43% | 48% | 16% | 27% | 28% | 20% | 6% | 3% |
| Hungary | 46% | 47% | 14% | 32% | 30% | 17% | 2% | 5% |
| Malta | 61% | 33% | 18% | 43% | 22% | 11% | 2% | 4% |
| Netherlands | 34% | 61% | 11% | 23% | 25% | 36% | 1% | 4% |
| Austria | 47% | 41% | 15% | 32% | 25% | 16% | 6% | 6% |
| Poland | 44% | 50% | 13% | 31% | 38% | 12% | 3% | 3% |
| Portugal | 46% | 44% | 5% | 41% | 30% | 14% | 3% | 7% |
| Romania | 42% | 50% | 13% | 29% | 36% | 14% | 2% | 6% |
| Slovenia | 55% | 40% | 29% | 26% | 26% | 14% | 1% | 4% |
| Slovakia | 49% | 39% | 15% | 34% | 30% | 9% | 3% | 9% |
| Finland | 47% | 42% | 20% | 27% | 21% | 21% | 5% | 6% |
| Sweden | 34% | 63% | 10% | 24% | 16% | 47% | 1% | 2% |
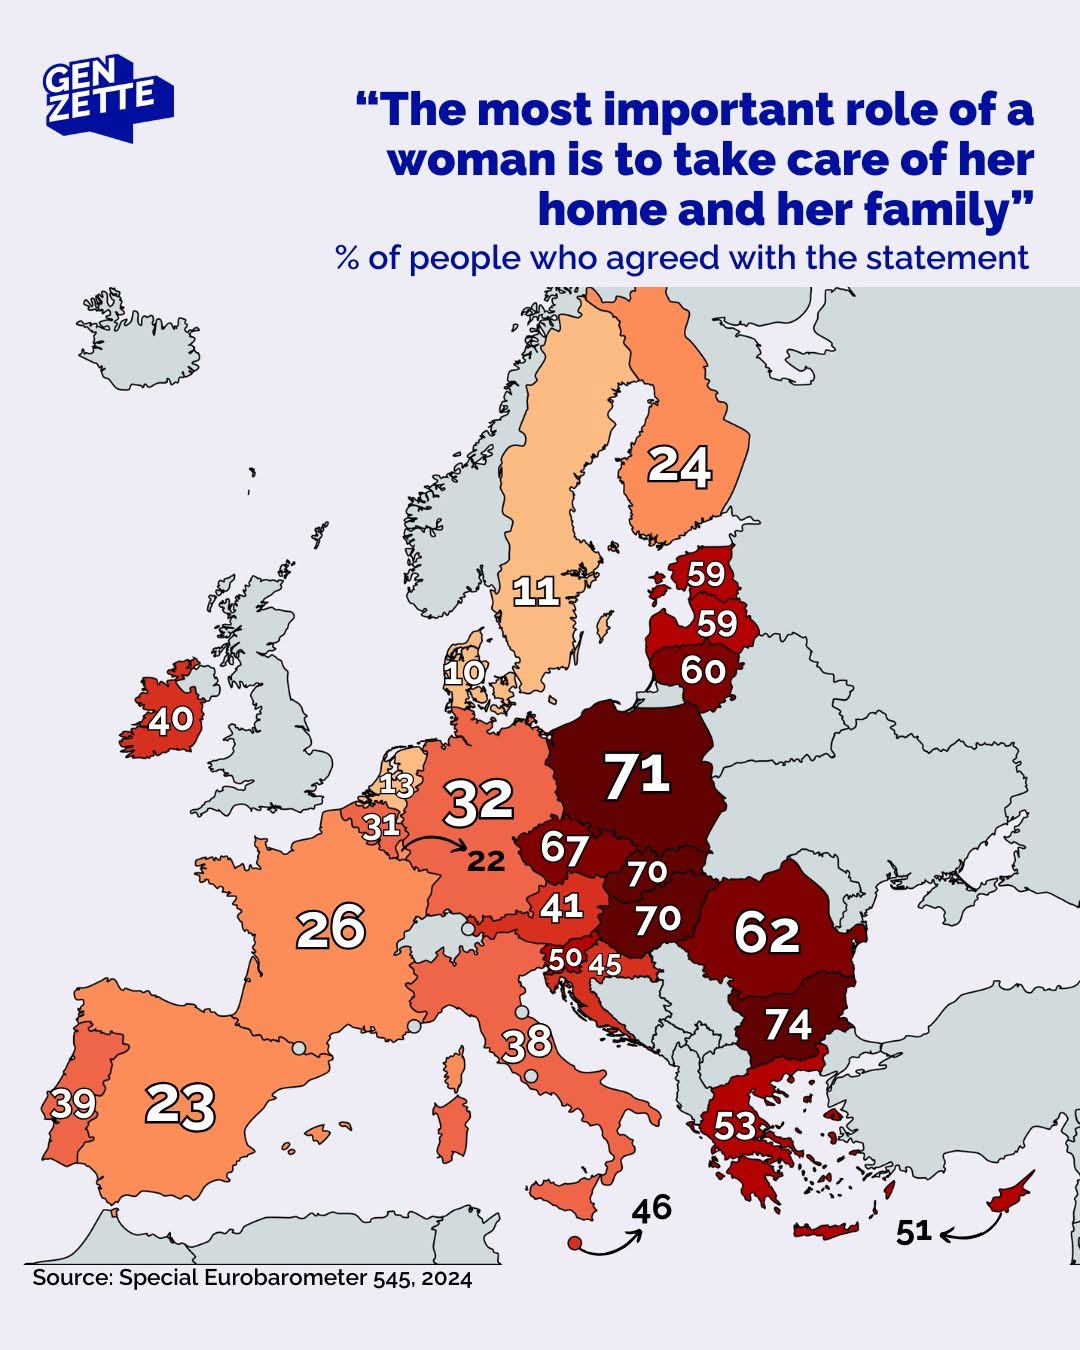
The most important role of a woman is to take care of her home and family (%)
| Country | Total 'Agree' | Total 'Disagree' | Totally agree | Tend to agree | Tend to disagree | Totally disagree | It depends (SPONTANEOUS) | Don't know |
|---|---|---|---|---|---|---|---|---|
| European Union (EU27) | 38% | 60% | 12% | 26% | 28% | 32% | 1% | 1% |
| Belgium | 31% | 67% | 5% | 22% | 31% | 36% | 2% | 0% |
| Bulgaria | 74% | 25% | 35% | 39% | 19% | 6% | 0% | 1% |
| Czechia | 67% | 30% | 22% | 45% | 19% | 11% | 1% | 2% |
| Denmark | 10% | 87% | 2% | 8% | 16% | 71% | 2% | 1% |
| Germany | 32% | 65% | 9% | 23% | 30% | 35% | 2% | 1% |
| Estonia | 59% | 35% | 20% | 39% | 22% | 13% | 5% | 1% |
| Ireland | 40% | 56% | 14% | 26% | 25% | 31% | 2% | 2% |
| Greece | 53% | 46% | 17% | 36% | 31% | 15% | 1% | 0% |
| Spain | 23% | 75% | 8% | 15% | 23% | 52% | 1% | 1% |
| France | 26% | 72% | 9% | 17% | 29% | 43% | 0% | 2% |
| Croatia | 45% | 53% | 16% | 29% | 34% | 19% | 1% | 1% |
| Italy | 38% | 61% | 12% | 26% | 36% | 25% | 0% | 1% |
| Cyprus | 51% | 46% | 23% | 28% | 23% | 23% | 0% | 3% |
| Latvia | 59% | 39% | 28% | 31% | 27% | 12% | 1% | 0% |
| Lithuania | 60% | 38% | 22% | 38% | 25% | 13% | 1% | 1% |
| Luxembourg | 22% | 72% | 7% | 15% | 35% | 37% | 5% | 1% |
| Hungary | 70% | 28% | 29% | 41% | 19% | 9% | 1% | 1% |
| Malta | 46% | 53% | 13% | 33% | 30% | 23% | 1% | 0% |
| Netherlands | 13% | 85% | 1% | 11% | 23% | 62% | 2% | 0% |
| Austria | 41% | 53% | 13% | 28% | 31% | 22% | 4% | 2% |
| Poland | 71% | 27% | 22% | 49% | 19% | 8% | 1% | 0% |
| Portugal | 39% | 58% | 6% | 34% | 40% | 18% | 1% | 2% |
| Romania | 62% | 36% | 26% | 36% | 28% | 8% | 1% | 1% |
| Slovenia | 50% | 50% | 19% | 31% | 28% | 22% | 0% | 0% |
| Slovakia | 70% | 27% | 25% | 45% | 20% | 7% | 2% | 1% |
| Finland | 24% | 70% | 6% | 18% | 29% | 41% | 5% | 1% |
| Sweden | 11% | 88% | 2% | 9% | 18% | 70% | 0% | 1% |
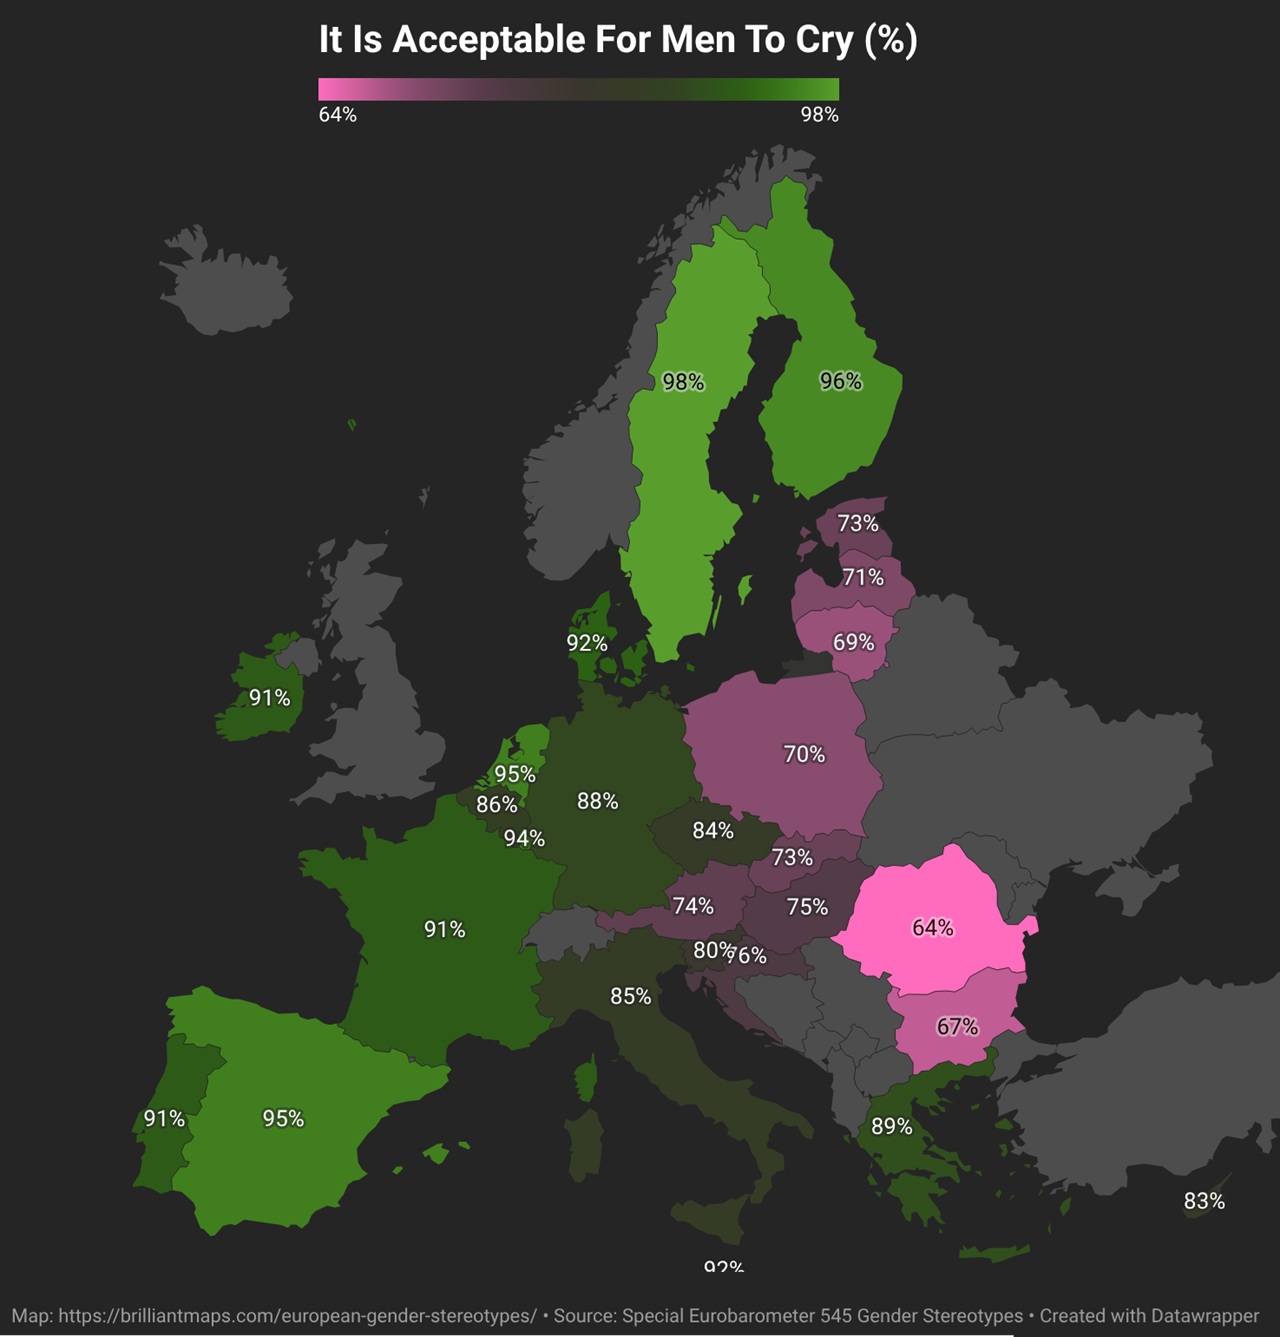
It is acceptable for men to cry (%)
| Country | Total 'Agree' | Total 'Disagree' | Totally agree | Tend to agree | Tend to disagree | Totally disagree | It depends (SPONTANEOUS) | Don't know |
|---|---|---|---|---|---|---|---|---|
| European Union (EU27) | 85% | 13% | 51% | 34% | 9% | 4% | 1% | 1% |
| Belgium | 86% | 13% | 54% | 32% | 8% | 5% | 0% | 1% |
| Bulgaria | 67% | 26% | 25% | 42% | 17% | 9% | 2% | 5% |
| Czechia | 84% | 13% | 43% | 41% | 9% | 4% | 0% | 3% |
| Denmark | 92% | 5% | 82% | 10% | 3% | 2% | 1% | 2% |
| Germany | 88% | 10% | 54% | 34% | 7% | 3% | 0% | 1% |
| Estonia | 73% | 19% | 35% | 38% | 13% | 6% | 5% | 3% |
| Ireland | 91% | 6% | 59% | 32% | 4% | 2% | 1% | 2% |
| Greece | 89% | 11% | 47% | 42% | 8% | 3% | 0% | 0% |
| Spain | 95% | 4% | 76% | 19% | 2% | 2% | 0% | 1% |
| France | 91% | 8% | 60% | 31% | 5% | 3% | 0% | 1% |
| Croatia | 76% | 21% | 28% | 48% | 14% | 7% | 1% | 2% |
| Italy | 85% | 14% | 38% | 47% | 11% | 3% | 0% | 1% |
| Cyprus | 83% | 15% | 49% | 34% | 7% | 8% | 0% | 2% |
| Latvia | 71% | 22% | 43% | 28% | 16% | 6% | 4% | 3% |
| Lithuania | 69% | 29% | 27% | 42% | 20% | 9% | 1% | 1% |
| Luxembourg | 94% | 5% | 73% | 21% | 2% | 3% | 1% | 0% |
| Hungary | 75% | 22% | 31% | 44% | 15% | 7% | 1% | 2% |
| Malta | 92% | 7% | 41% | 51% | 5% | 2% | 1% | 0% |
| Netherlands | 95% | 5% | 79% | 16% | 3% | 2% | 0% | 0% |
| Austria | 74% | 21% | 37% | 37% | 13% | 8% | 3% | 2% |
| Poland | 70% | 27% | 22% | 48% | 20% | 7% | 2% | 1% |
| Portugal | 91% | 6% | 41% | 50% | 4% | 2% | 1% | 2% |
| Romania | 64% | 34% | 24% | 40% | 23% | 11% | 1% | 1% |
| Slovenia | 80% | 18% | 48% | 32% | 11% | 7% | 1% | 1% |
| Slovakia | 73% | 19% | 26% | 47% | 14% | 5% | 3% | 5% |
| Finland | 96% | 3% | 86% | 10% | 2% | 1% | 1% | 0% |
| Sweden | 98% | 1% | 95% | 3% | 1% | 0% | 0% | 1% |
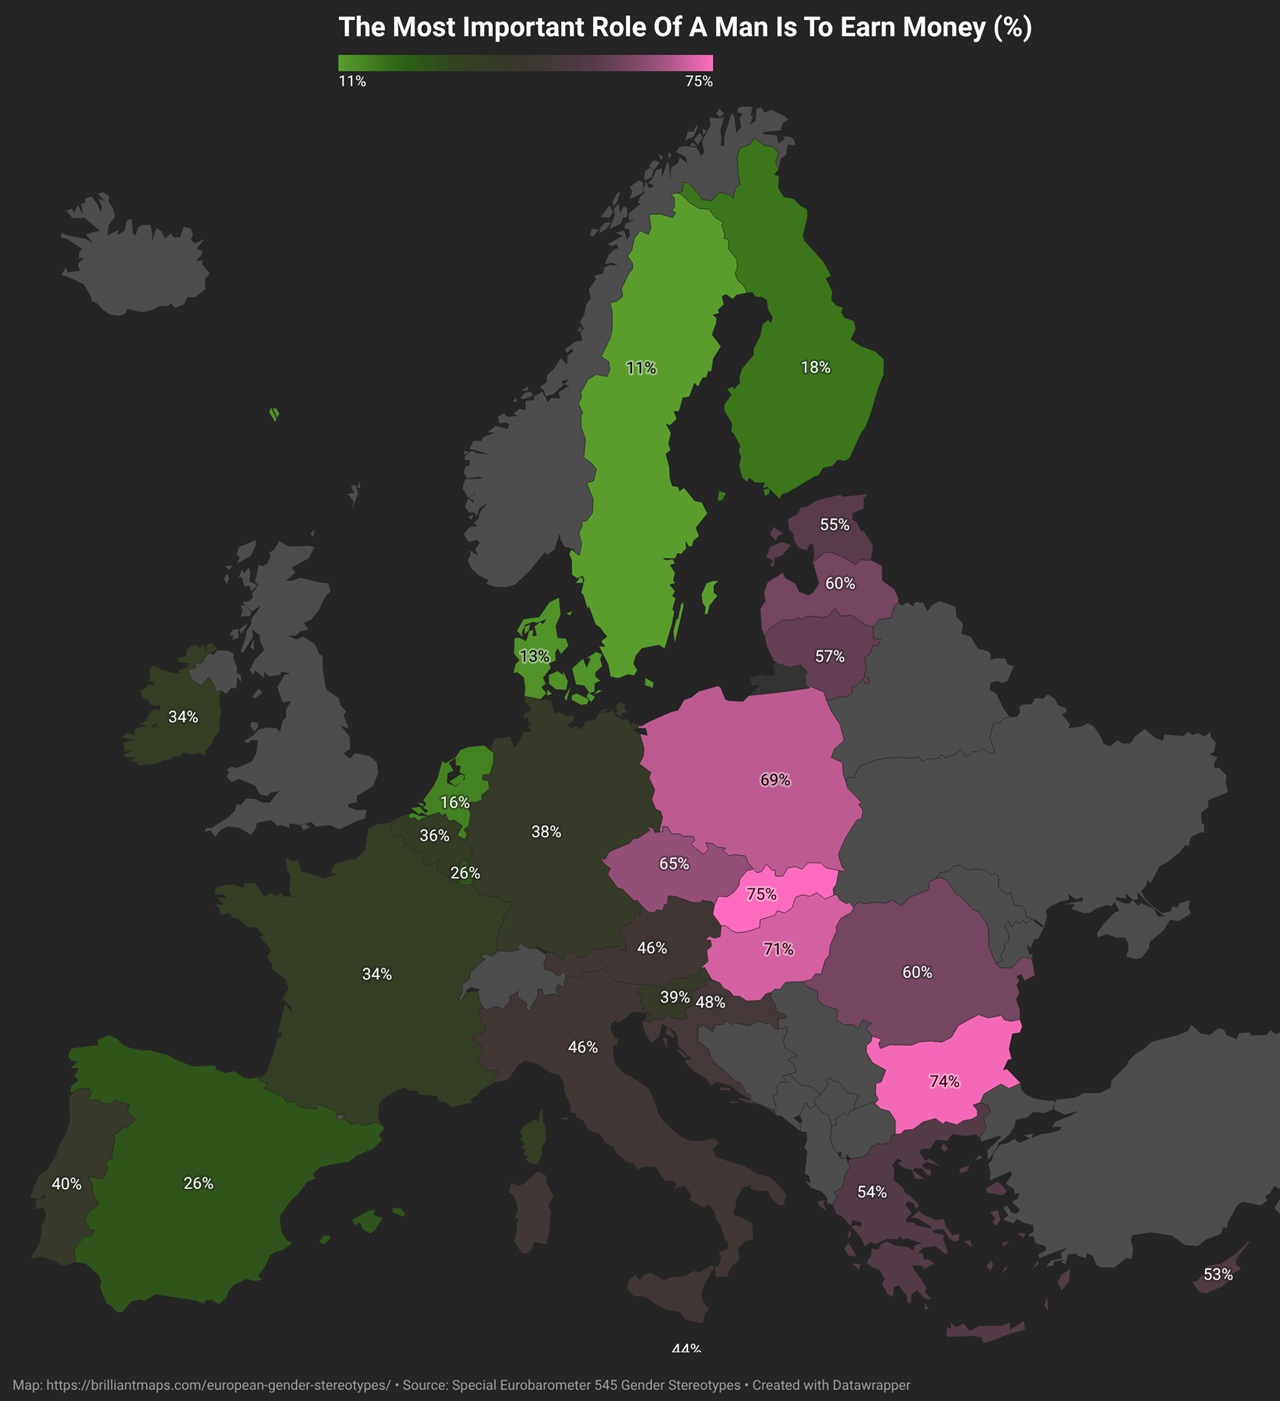
The most important role of a man is to earn money (%)
| Country | Total 'Agree' | Total 'Disagree' | Totally agree | Tend to agree | Tend to disagree | Totally disagree | It depends (SPONTANEOUS) | Don't know |
|---|---|---|---|---|---|---|---|---|
| European Union (EU27) | 42% | 56% | 15% | 27% | 28% | 28% | 1% | 1% |
| Belgium | 36% | 63% | 11% | 25% | 33% | 30% | 1% | 0% |
| Bulgaria | 74% | 23% | 37% | 37% | 17% | 6% | 1% | 2% |
| Czechia | 65% | 32% | 26% | 39% | 22% | 10% | 1% | 2% |
| Denmark | 13% | 84% | 4% | 9% | 19% | 65% | 2% | 1% |
| Germany | 38% | 60% | 14% | 24% | 29% | 31% | 2% | 0% |
| Estonia | 55% | 38% | 20% | 35% | 24% | 14% | 5% | 2% |
| Ireland | 34% | 62% | 13% | 21% | 29% | 33% | 2% | 2% |
| Greece | 54% | 46% | 22% | 32% | 33% | 13% | 0% | 0% |
| Spain | 26% | 72% | 9% | 17% | 25% | 47% | 1% | 1% |
| France | 34% | 64% | 10% | 24% | 27% | 37% | 0% | 2% |
| Croatia | 48% | 50% | 18% | 30% | 32% | 18% | 1% | 1% |
| Italy | 46% | 53% | 15% | 31% | 36% | 17% | 0% | 1% |
| Cyprus | 53% | 44% | 26% | 27% | 22% | 22% | 1% | 2% |
| Latvia | 60% | 38% | 30% | 30% | 26% | 12% | 1% | 1% |
| Lithuania | 57% | 41% | 23% | 34% | 28% | 13% | 1% | 1% |
| Luxembourg | 26% | 70% | 8% | 18% | 34% | 36% | 3% | 1% |
| Hungary | 71% | 27% | 31% | 40% | 19% | 8% | 1% | 1% |
| Malta | 44% | 55% | 10% | 34% | 34% | 21% | 1% | 0% |
| Netherlands | 16% | 81% | 3% | 13% | 27% | 54% | 2% | 0% |
| Austria | 46% | 49% | 16% | 30% | 29% | 20% | 3% | 2% |
| Poland | 69% | 29% | 25% | 44% | 21% | 8% | 1% | 1% |
| Portugal | 40% | 58% | 6% | 34% | 41% | 17% | 1% | 1% |
| Romania | 60% | 38% | 29% | 31% | 28% | 10% | 0% | 2% |
| Slovenia | 39% | 60% | 16% | 23% | 35% | 25% | 1% | 0% |
| Slovakia | 75% | 22% | 32% | 43% | 17% | 5% | 2% | 1% |
| Finland | 18% | 76% | 5% | 13% | 27% | 49% | 5% | 1% |
| Sweden | 11% | 89% | 4% | 7% | 14% | 75% | 0% | 0% |
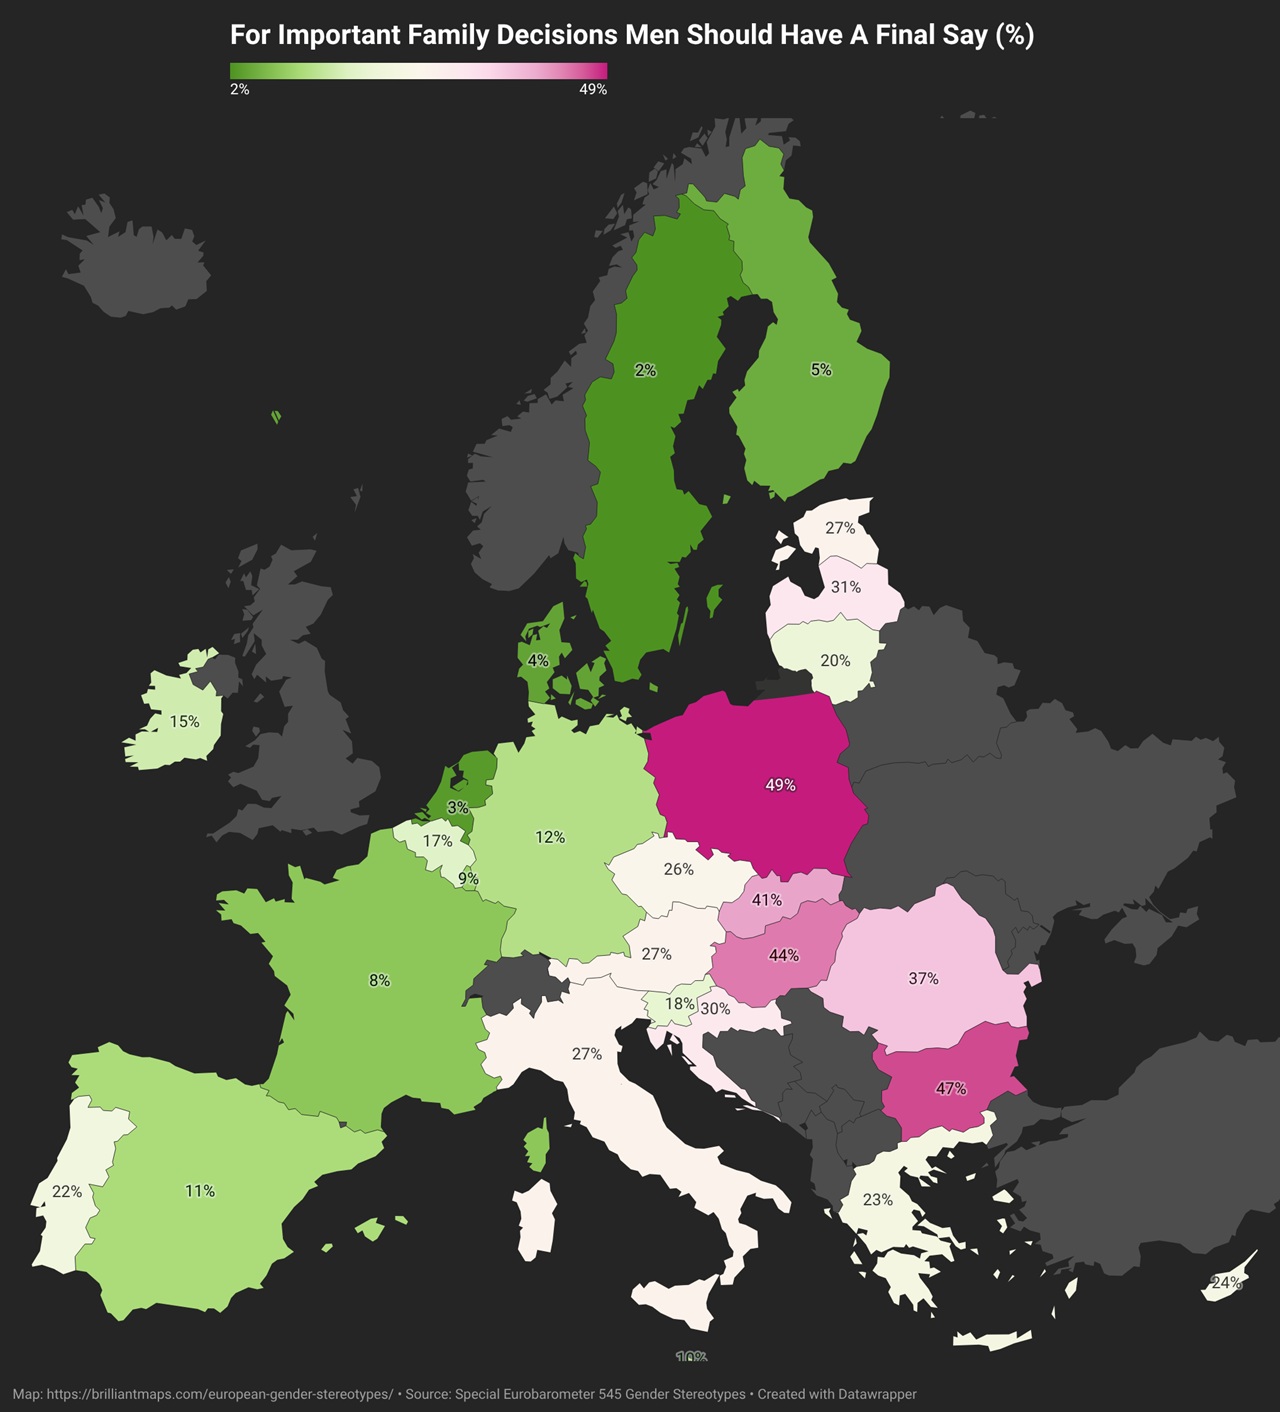
For important family decisions men should have a final say (%)
| Country | Total 'Agree' | Total 'Disagree' | Totally agree | Tend to agree | Tend to disagree | Totally disagree | It depends (SPONTANEOUS) | Don't know |
|---|---|---|---|---|---|---|---|---|
| European Union (EU27) | 20% | 77% | 6% | 14% | 27% | 50% | 1% | 2% |
| Belgium | 17% | 81% | 5% | 12% | 28% | 53% | 1% | 1% |
| Bulgaria | 47% | 48% | 19% | 28% | 30% | 18% | 3% | 2% |
| Czechia | 26% | 70% | 7% | 19% | 32% | 38% | 1% | 3% |
| Denmark | 4% | 92% | 2% | 2% | 11% | 81% | 2% | 2% |
| Germany | 12% | 84% | 3% | 9% | 26% | 58% | 2% | 2% |
| Estonia | 27% | 60% | 10% | 17% | 26% | 34% | 7% | 6% |
| Ireland | 15% | 81% | 3% | 12% | 26% | 55% | 1% | 3% |
| Greece | 23% | 74% | 7% | 16% | 34% | 40% | 2% | 1% |
| Spain | 11% | 87% | 2% | 9% | 16% | 71% | 1% | 1% |
| France | 8% | 89% | 3% | 5% | 24% | 65% | 1% | 2% |
| Croatia | 30% | 68% | 9% | 21% | 37% | 31% | 1% | 1% |
| Italy | 27% | 71% | 9% | 18% | 37% | 34% | 0% | 2% |
| Cyprus | 24% | 73% | 8% | 16% | 29% | 44% | 0% | 3% |
| Latvia | 31% | 62% | 12% | 19% | 37% | 25% | 5% | 2% |
| Lithuania | 20% | 74% | 7% | 13% | 36% | 38% | 4% | 2% |
| Luxembourg | 9% | 87% | 3% | 6% | 21% | 66% | 3% | 1% |
| Hungary | 44% | 54% | 14% | 30% | 30% | 24% | 1% | 1% |
| Malta | 10% | 86% | 3% | 7% | 17% | 69% | 3% | 1% |
| Netherlands | 3% | 95% | 1% | 2% | 13% | 82% | 1% | 1% |
| Austria | 27% | 65% | 8% | 19% | 28% | 37% | 5% | 3% |
| Poland | 49% | 48% | 16% | 33% | 31% | 17% | 2% | 1% |
| Portugal | 22% | 74% | 4% | 18% | 46% | 28% | 3% | 1% |
| Romania | 37% | 60% | 11% | 26% | 37% | 23% | 1% | 2% |
| Slovenia | 18% | 79% | 6% | 12% | 28% | 51% | 2% | 1% |
| Slovakia | 41% | 54% | 16% | 25% | 34% | 20% | 3% | 2% |
| Finland | 5% | 89% | 2% | 3% | 16% | 73% | 5% | 1% |
| Sweden | 2% | 96% | 1% | 1% | 4% | 92% | 1% | 1% |
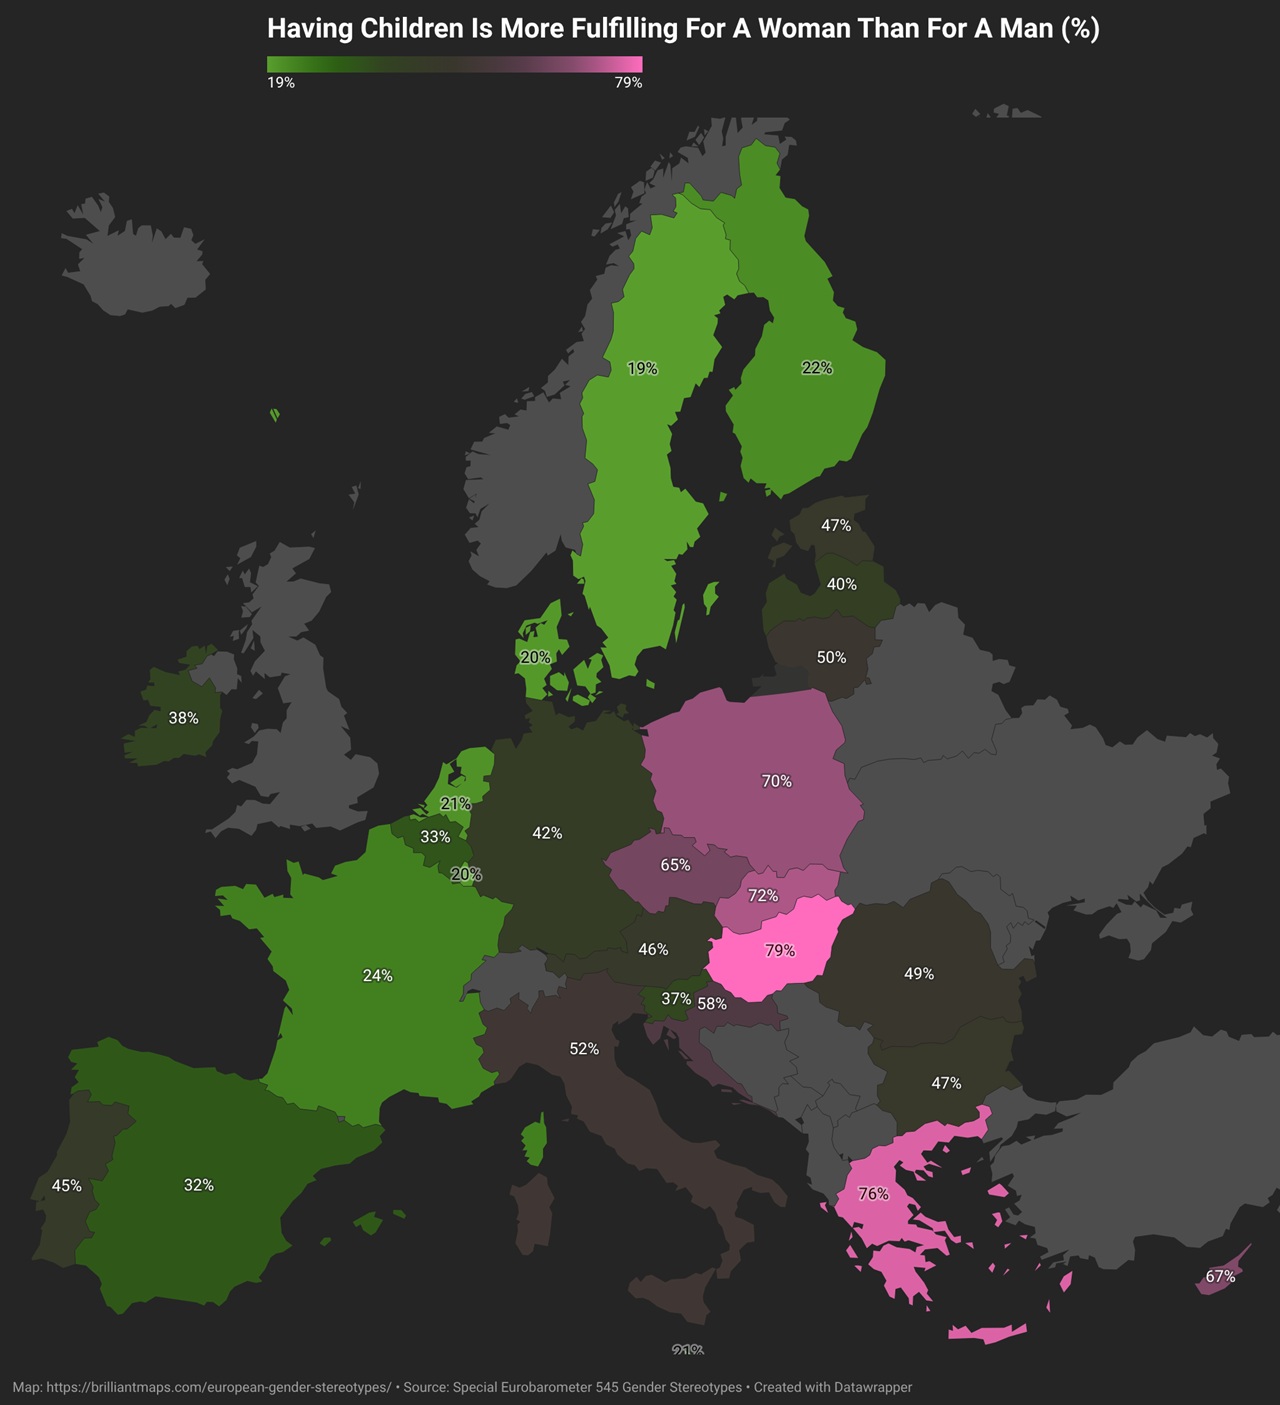
Having children is more fulfilling for a woman than for a man (%)
| Country | Total 'Agree' | Total 'Disagree' | Totally agree | Tend to agree | Tend to disagree | Totally disagree | It depends (SPONTANEOUS) | Don't know |
|---|---|---|---|---|---|---|---|---|
| European Union (EU27) | 43% | 53% | 13% | 30% | 25% | 28% | 1% | 3% |
| Belgium | 33% | 63% | 7% | 26% | 32% | 31% | 2% | 2% |
| Bulgaria | 47% | 49% | 21% | 26% | 29% | 20% | 2% | 2% |
| Czechia | 65% | 31% | 20% | 45% | 18% | 13% | 1% | 3% |
| Denmark | 20% | 73% | 6% | 14% | 19% | 54% | 2% | 5% |
| Germany | 42% | 53% | 13% | 29% | 27% | 26% | 2% | 3% |
| Estonia | 47% | 40% | 12% | 35% | 23% | 17% | 7% | 6% |
| Ireland | 38% | 53% | 12% | 26% | 25% | 28% | 2% | 7% |
| Greece | 76% | 23% | 34% | 42% | 17% | 6% | 0% | 1% |
| Spain | 32% | 63% | 9% | 23% | 19% | 44% | 1% | 4% |
| France | 24% | 73% | 6% | 18% | 28% | 45% | 0% | 3% |
| Croatia | 58% | 39% | 20% | 38% | 30% | 9% | 1% | 2% |
| Italy | 52% | 46% | 15% | 37% | 29% | 17% | 0% | 2% |
| Cyprus | 67% | 29% | 31% | 36% | 15% | 14% | 1% | 3% |
| Latvia | 40% | 52% | 13% | 27% | 32% | 20% | 4% | 4% |
| Lithuania | 50% | 45% | 16% | 34% | 25% | 20% | 2% | 3% |
| Luxembourg | 20% | 67% | 5% | 15% | 27% | 40% | 9% | 4% |
| Hungary | 79% | 20% | 35% | 44% | 15% | 5% | 0% | 1% |
| Malta | 21% | 76% | 4% | 17% | 27% | 49% | 2% | 1% |
| Netherlands | 21% | 72% | 3% | 18% | 22% | 50% | 2% | 5% |
| Austria | 46% | 46% | 15% | 31% | 29% | 17% | 4% | 4% |
| Poland | 70% | 28% | 20% | 50% | 19% | 9% | 1% | 1% |
| Portugal | 45% | 52% | 10% | 35% | 34% | 18% | 2% | 1% |
| Romania | 49% | 49% | 19% | 30% | 33% | 16% | 1% | 1% |
| Slovenia | 37% | 60% | 13% | 24% | 30% | 30% | 2% | 1% |
| Slovakia | 72% | 25% | 29% | 43% | 19% | 6% | 2% | 1% |
| Finland | 22% | 62% | 5% | 17% | 25% | 37% | 8% | 8% |
| Sweden | 19% | 78% | 5% | 14% | 10% | 68% | 0% | 3% |
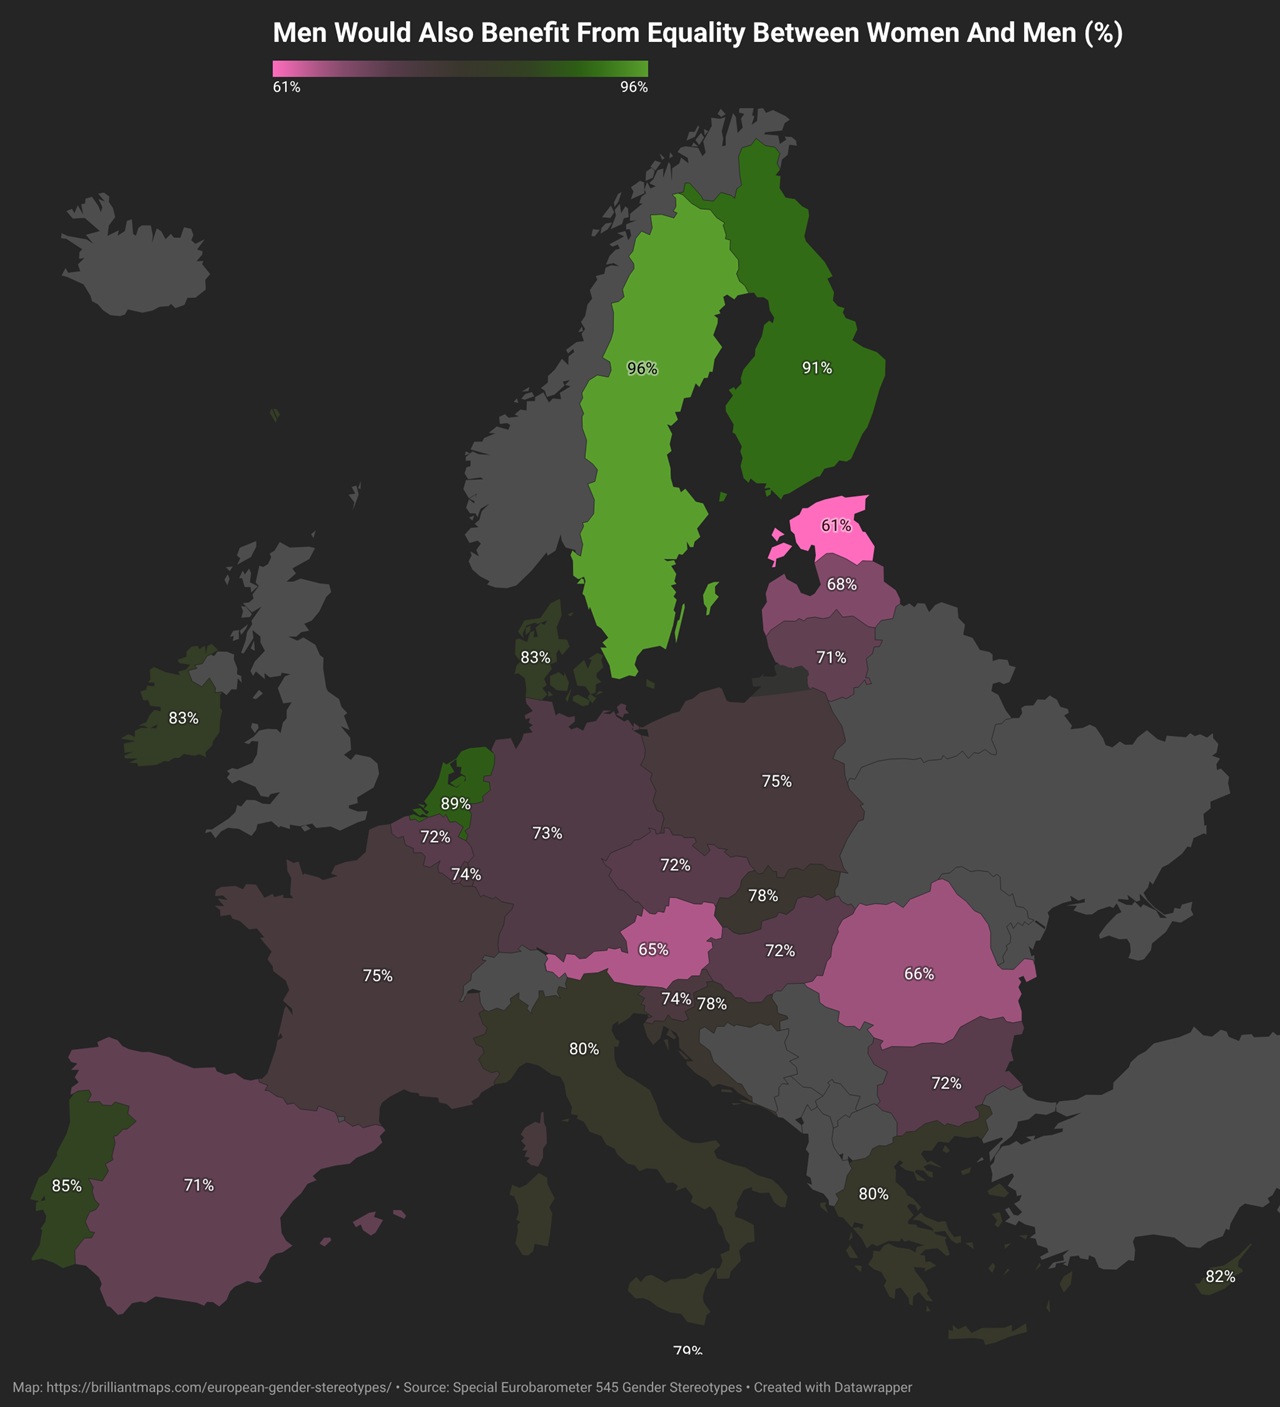
Men would also benefit from equality between women and men (%)
| Country | Total 'Agree' | Total 'Disagree' | Totally agree | Tend to agree | Tend to disagree | Totally disagree | It depends (SPONTANEOUS) | Don't know |
|---|---|---|---|---|---|---|---|---|
| European Union (EU27) | 75% | 19% | 34% | 41% | 13% | 6% | 2% | 4% |
| Belgium | 72% | 24% | 28% | 44% | 19% | 5% | 1% | 3% |
| Bulgaria | 72% | 17% | 33% | 39% | 12% | 5% | 5% | 6% |
| Czechia | 72% | 20% | 25% | 47% | 12% | 8% | 2% | 6% |
| Denmark | 83% | 9% | 60% | 23% | 4% | 5% | 3% | 5% |
| Germany | 73% | 20% | 33% | 40% | 14% | 6% | 2% | 5% |
| Estonia | 61% | 24% | 21% | 40% | 16% | 8% | 4% | 11% |
| Ireland | 83% | 11% | 38% | 45% | 7% | 4% | 2% | 4% |
| Greece | 80% | 17% | 30% | 50% | 14% | 3% | 0% | 3% |
| Spain | 71% | 23% | 40% | 31% | 12% | 11% | 1% | 5% |
| France | 75% | 17% | 34% | 41% | 10% | 7% | 1% | 7% |
| Croatia | 78% | 19% | 27% | 51% | 13% | 6% | 1% | 2% |
| Italy | 80% | 17% | 34% | 46% | 13% | 4% | 0% | 3% |
| Cyprus | 82% | 13% | 47% | 35% | 9% | 4% | 0% | 5% |
| Latvia | 68% | 22% | 30% | 38% | 17% | 5% | 3% | 7% |
| Lithuania | 71% | 20% | 29% | 42% | 14% | 6% | 3% | 6% |
| Luxembourg | 74% | 18% | 35% | 39% | 11% | 7% | 4% | 4% |
| Hungary | 72% | 23% | 23% | 49% | 16% | 7% | 2% | 3% |
| Malta | 79% | 18% | 25% | 54% | 11% | 7% | 1% | 2% |
| Netherlands | 89% | 8% | 61% | 28% | 5% | 3% | 1% | 2% |
| Austria | 65% | 23% | 25% | 40% | 17% | 6% | 5% | 7% |
| Poland | 75% | 21% | 21% | 54% | 16% | 5% | 2% | 2% |
| Portugal | 85% | 10% | 22% | 63% | 7% | 3% | 2% | 3% |
| Romania | 66% | 29% | 21% | 45% | 22% | 7% | 1% | 4% |
| Slovenia | 74% | 22% | 37% | 37% | 15% | 7% | 2% | 2% |
| Slovakia | 78% | 12% | 30% | 48% | 10% | 2% | 3% | 7% |
| Finland | 91% | 6% | 63% | 28% | 4% | 2% | 1% | 2% |
| Sweden | 96% | 2% | 84% | 12% | 1% | 1% | 0% | 2% |
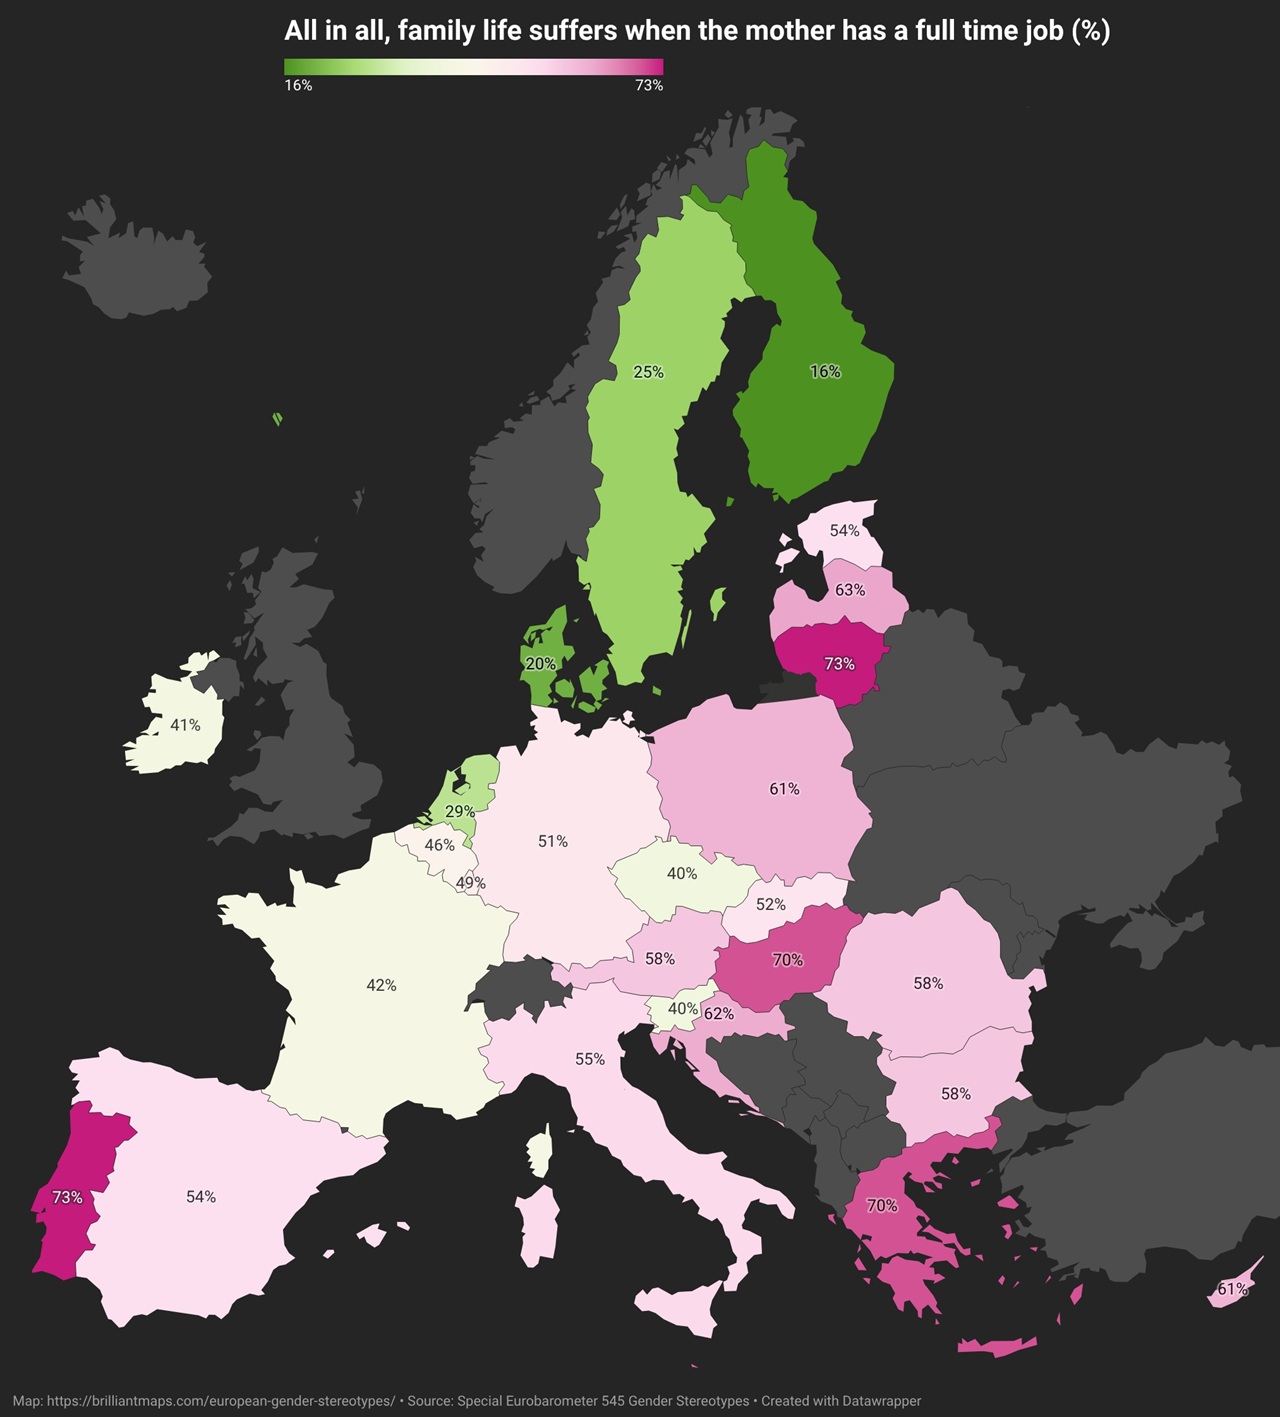
All in all, family life suffers when the mother has a full time job (%)
| Country | Total 'Agree' | Total 'Disagree' | Totally agree | Tend to agree | Tend to disagree | Totally disagree | It depends (SPONTANEOUS) | Don't know |
|---|---|---|---|---|---|---|---|---|
| European Union (EU27) | 51% | 46% | 15% | 36% | 31% | 18% | 0% | 3% |
| Belgium | 46% | 52% | 11% | 35% | 33% | 19% | 0% | 2% |
| Bulgaria | 58% | 38% | 23% | 35% | 28% | 10% | 0% | 4% |
| Czechia | 40% | 56% | 12% | 28% | 36% | 20% | 0% | 4% |
| Denmark | 20% | 77% | 5% | 15% | 21% | 56% | 0% | 3% |
| Germany | 51% | 45% | 19% | 32% | 29% | 16% | 0% | 4% |
| Estonia | 54% | 39% | 19% | 35% | 26% | 13% | 0% | 7% |
| Ireland | 41% | 54% | 13% | 28% | 32% | 22% | 0% | 5% |
| Greece | 70% | 30% | 23% | 47% | 23% | 7% | 0% | 0% |
| Spain | 54% | 42% | 19% | 35% | 21% | 21% | 0% | 4% |
| France | 42% | 55% | 13% | 29% | 29% | 26% | 0% | 3% |
| Croatia | 62% | 36% | 19% | 43% | 27% | 9% | 0% | 2% |
| Italy | 55% | 44% | 11% | 44% | 33% | 11% | 0% | 1% |
| Cyprus | 61% | 36% | 27% | 34% | 22% | 14% | 0% | 3% |
| Latvia | 63% | 33% | 25% | 38% | 26% | 7% | 0% | 4% |
| Lithuania | 73% | 26% | 28% | 45% | 20% | 6% | 0% | 1% |
| Luxembourg | 49% | 49% | 18% | 31% | 31% | 18% | 0% | 2% |
| Hungary | 70% | 28% | 30% | 40% | 22% | 6% | 0% | 2% |
| Malta | 69% | 30% | 17% | 52% | 20% | 10% | 0% | 1% |
| Netherlands | 29% | 69% | 8% | 21% | 28% | 41% | 0% | 2% |
| Austria | 58% | 37% | 23% | 35% | 27% | 10% | 0% | 5% |
| Poland | 61% | 34% | 15% | 46% | 26% | 8% | 0% | 5% |
| Portugal | 73% | 25% | 9% | 64% | 19% | 6% | 0% | 2% |
| Romania | 58% | 41% | 16% | 42% | 30% | 11% | 0% | 1% |
| Slovenia | 40% | 59% | 15% | 25% | 32% | 27% | 0% | 0% |
| Slovakia | 52% | 44% | 16% | 36% | 35% | 9% | 0% | 4% |
| Finland | 16% | 80% | 4% | 12% | 28% | 52% | 0% | 4% |
| Sweden | 25% | 73% | 8% | 17% | 17% | 56% | 0% | 2% |
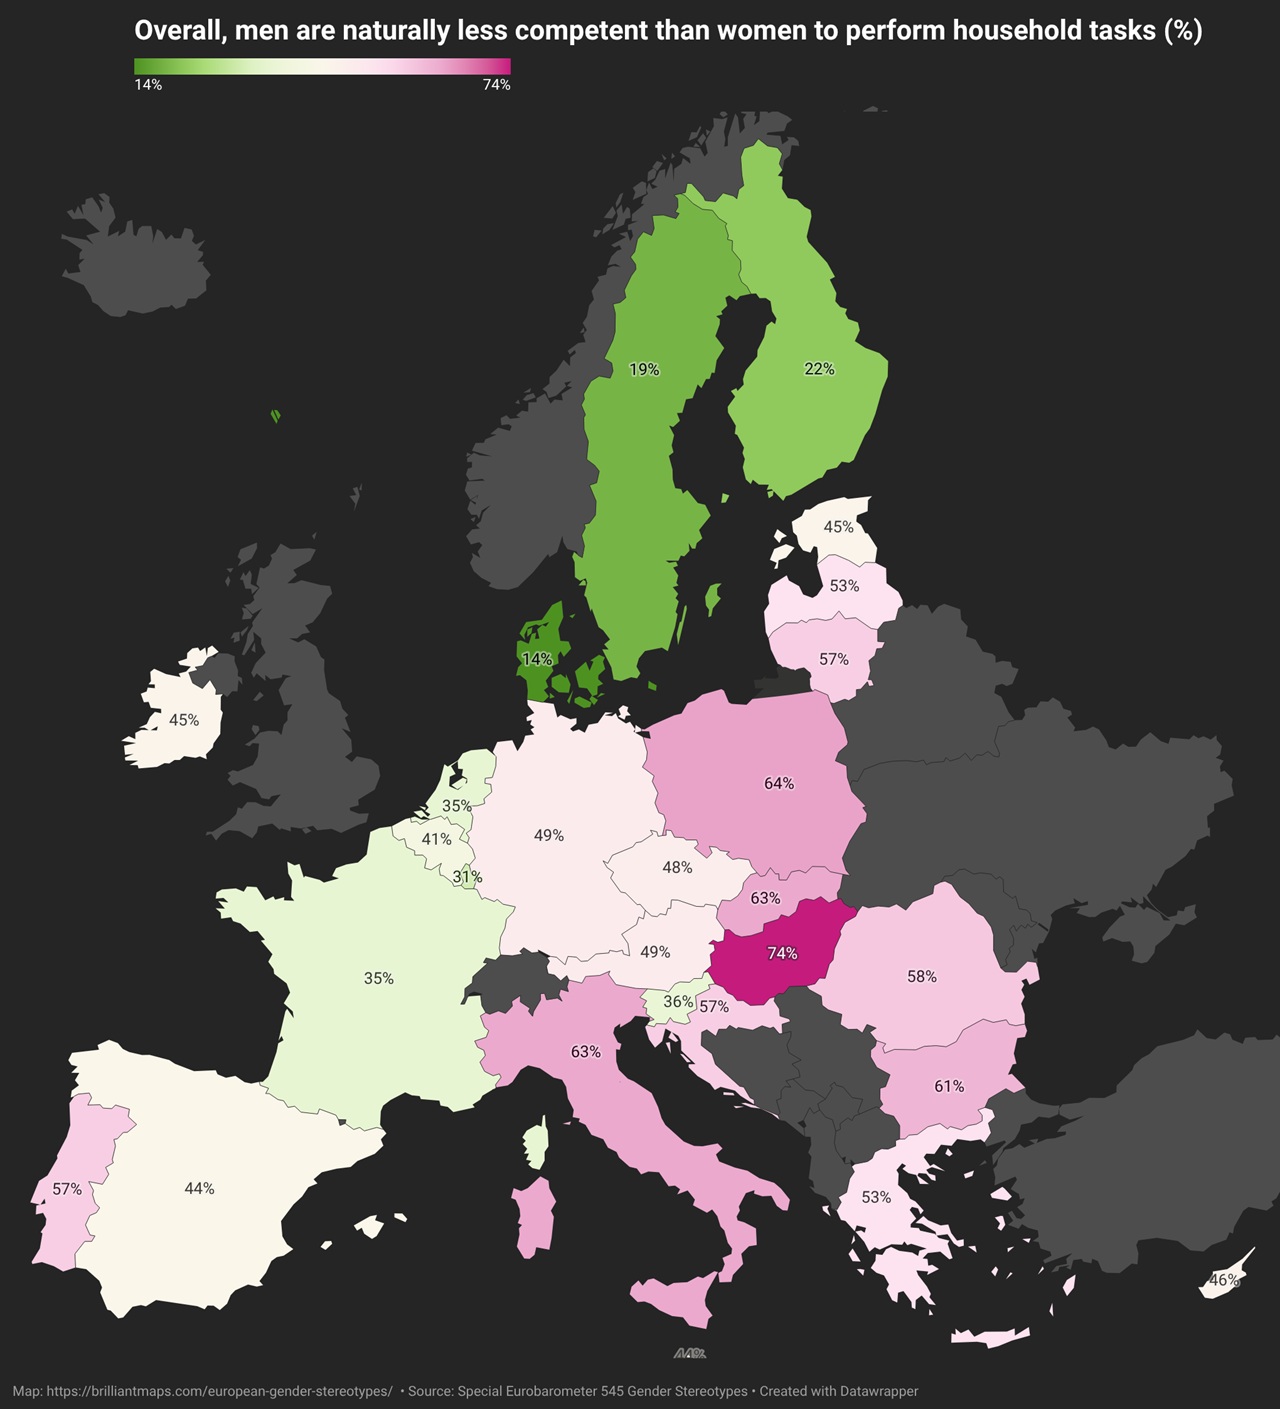
Overall, men are naturally less competent than women to perform household tasks (%)
| Country | Total 'Agree' | Total 'Disagree' | Totally agree | Tend to agree | Tend to disagree | Totally disagree | Don't know |
|---|---|---|---|---|---|---|---|
| European Union (EU27) | 49% | 49% | 15% | 34% | 26% | 23% | 2% |
| Belgium | 41% | 58% | 9% | 32% | 33% | 25% | 1% |
| Bulgaria | 61% | 36% | 28% | 33% | 25% | 15% | 3% |
| Czechia | 48% | 49% | 13% | 35% | 32% | 17% | 3% |
| Denmark | 14% | 83% | 3% | 11% | 17% | 66% | 3% |
| Germany | 49% | 49% | 15% | 34% | 28% | 21% | 2% |
| Estonia | 45% | 50% | 14% | 31% | 28% | 22% | 5% |
| Ireland | 45% | 52% | 16% | 29% | 27% | 25% | 3% |
| Greece | 53% | 47% | 17% | 36% | 30% | 17% | 0% |
| Spain | 44% | 54% | 17% | 27% | 23% | 31% | 2% |
| France | 35% | 63% | 11% | 24% | 27% | 36% | 2% |
| Croatia | 57% | 41% | 14% | 43% | 28% | 13% | 2% |
| Italy | 63% | 36% | 20% | 43% | 25% | 11% | 1% |
| Cyprus | 46% | 52% | 18% | 28% | 28% | 24% | 2% |
| Latvia | 53% | 44% | 18% | 35% | 28% | 16% | 3% |
| Lithuania | 57% | 41% | 22% | 35% | 25% | 16% | 2% |
| Luxembourg | 31% | 68% | 10% | 21% | 33% | 35% | 1% |
| Hungary | 74% | 26% | 27% | 47% | 19% | 7% | 0% |
| Malta | 44% | 55% | 9% | 35% | 31% | 24% | 1% |
| Netherlands | 35% | 64% | 10% | 25% | 24% | 40% | 1% |
| Austria | 49% | 47% | 16% | 33% | 27% | 20% | 4% |
| Poland | 64% | 33% | 17% | 47% | 27% | 6% | 3% |
| Portugal | 57% | 41% | 12% | 45% | 33% | 8% | 2% |
| Romania | 58% | 40% | 16% | 42% | 33% | 7% | 2% |
| Slovenia | 36% | 63% | 14% | 22% | 35% | 28% | 1% |
| Slovakia | 63% | 34% | 22% | 41% | 23% | 11% | 3% |
| Finland | 22% | 76% | 9% | 13% | 24% | 52% | 2% |
| Sweden | 19% | 81% | 5% | 14% | 9% | 72% | 0% |
If the father’s pay is lower than that of the mother, he is the one who should give up work to look after the children, if a family decides
one parent has to do so (%)
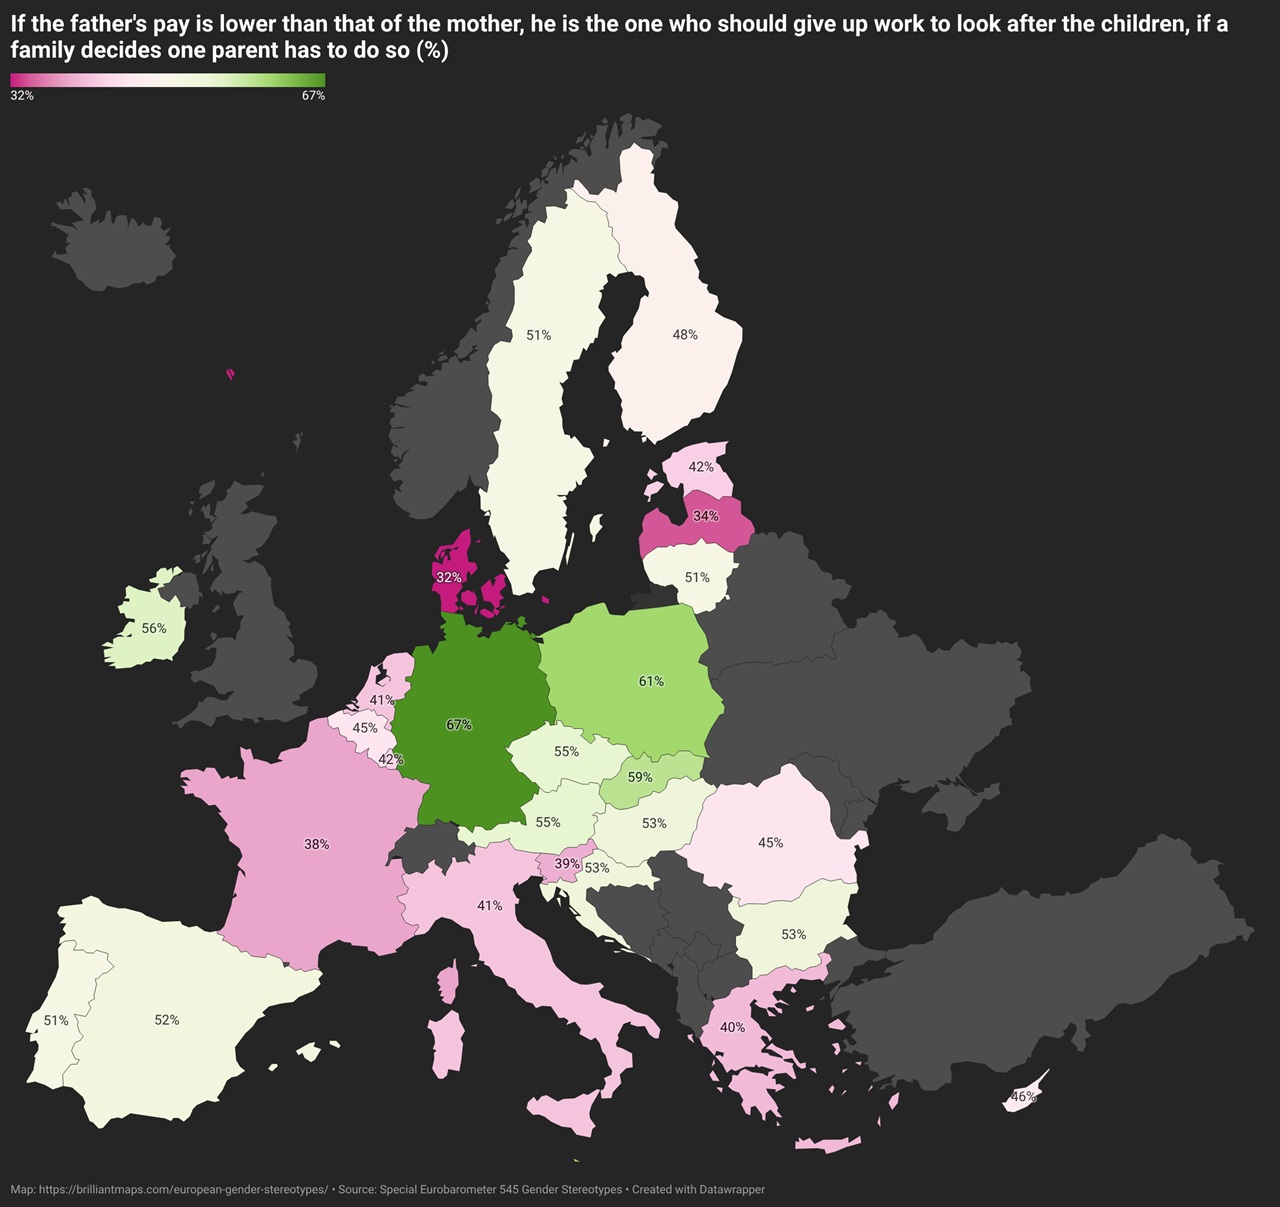
| Country | Total 'Agree' | Total 'Disagree' | Totally agree | Tend to agree | Tend to disagree | Totally disagree | Don't know |
|---|---|---|---|---|---|---|---|
| European Union (EU27) | 51% | 41% | 18% | 33% | 24% | 17% | 8% |
| Belgium | 45% | 50% | 10% | 35% | 32% | 18% | 5% |
| Bulgaria | 53% | 36% | 20% | 33% | 21% | 15% | 11% |
| Czechia | 55% | 37% | 15% | 40% | 27% | 8% | 8% |
| Denmark | 32% | 55% | 14% | 18% | 20% | 35% | 13% |
| Germany | 67% | 24% | 29% | 38% | 17% | 7% | 9% |
| Estonia | 42% | 42% | 12% | 30% | 27% | 15% | 16% |
| Ireland | 56% | 33% | 23% | 33% | 19% | 14% | 11% |
| Greece | 40% | 55% | 10% | 30% | 31% | 24% | 5% |
| Spain | 52% | 38% | 29% | 23% | 18% | 20% | 10% |
| France | 38% | 52% | 11% | 27% | 26% | 26% | 10% |
| Croatia | 53% | 42% | 16% | 37% | 28% | 14% | 5% |
| Italy | 41% | 53% | 10% | 31% | 35% | 18% | 6% |
| Cyprus | 46% | 48% | 14% | 32% | 17% | 31% | 6% |
| Latvia | 34% | 55% | 9% | 25% | 36% | 19% | 11% |
| Lithuania | 51% | 38% | 20% | 31% | 26% | 12% | 11% |
| Luxembourg | 42% | 48% | 17% | 25% | 30% | 18% | 10% |
| Hungary | 53% | 39% | 17% | 36% | 27% | 12% | 8% |
| Malta | 61% | 35% | 16% | 45% | 23% | 12% | 4% |
| Netherlands | 41% | 53% | 14% | 27% | 25% | 28% | 6% |
| Austria | 55% | 31% | 18% | 37% | 20% | 11% | 14% |
| Poland | 61% | 32% | 17% | 44% | 21% | 11% | 7% |
| Portugal | 51% | 42% | 8% | 43% | 30% | 12% | 7% |
| Romania | 45% | 49% | 13% | 32% | 37% | 12% | 6% |
| Slovenia | 39% | 58% | 15% | 24% | 31% | 27% | 3% |
| Slovakia | 59% | 32% | 17% | 42% | 25% | 7% | 9% |
| Finland | 48% | 40% | 14% | 34% | 24% | 16% | 12% |
| Sweden | 51% | 44% | 25% | 26% | 14% | 30% | 5% |
Women should give priority to their family responsibilities over their career (%)
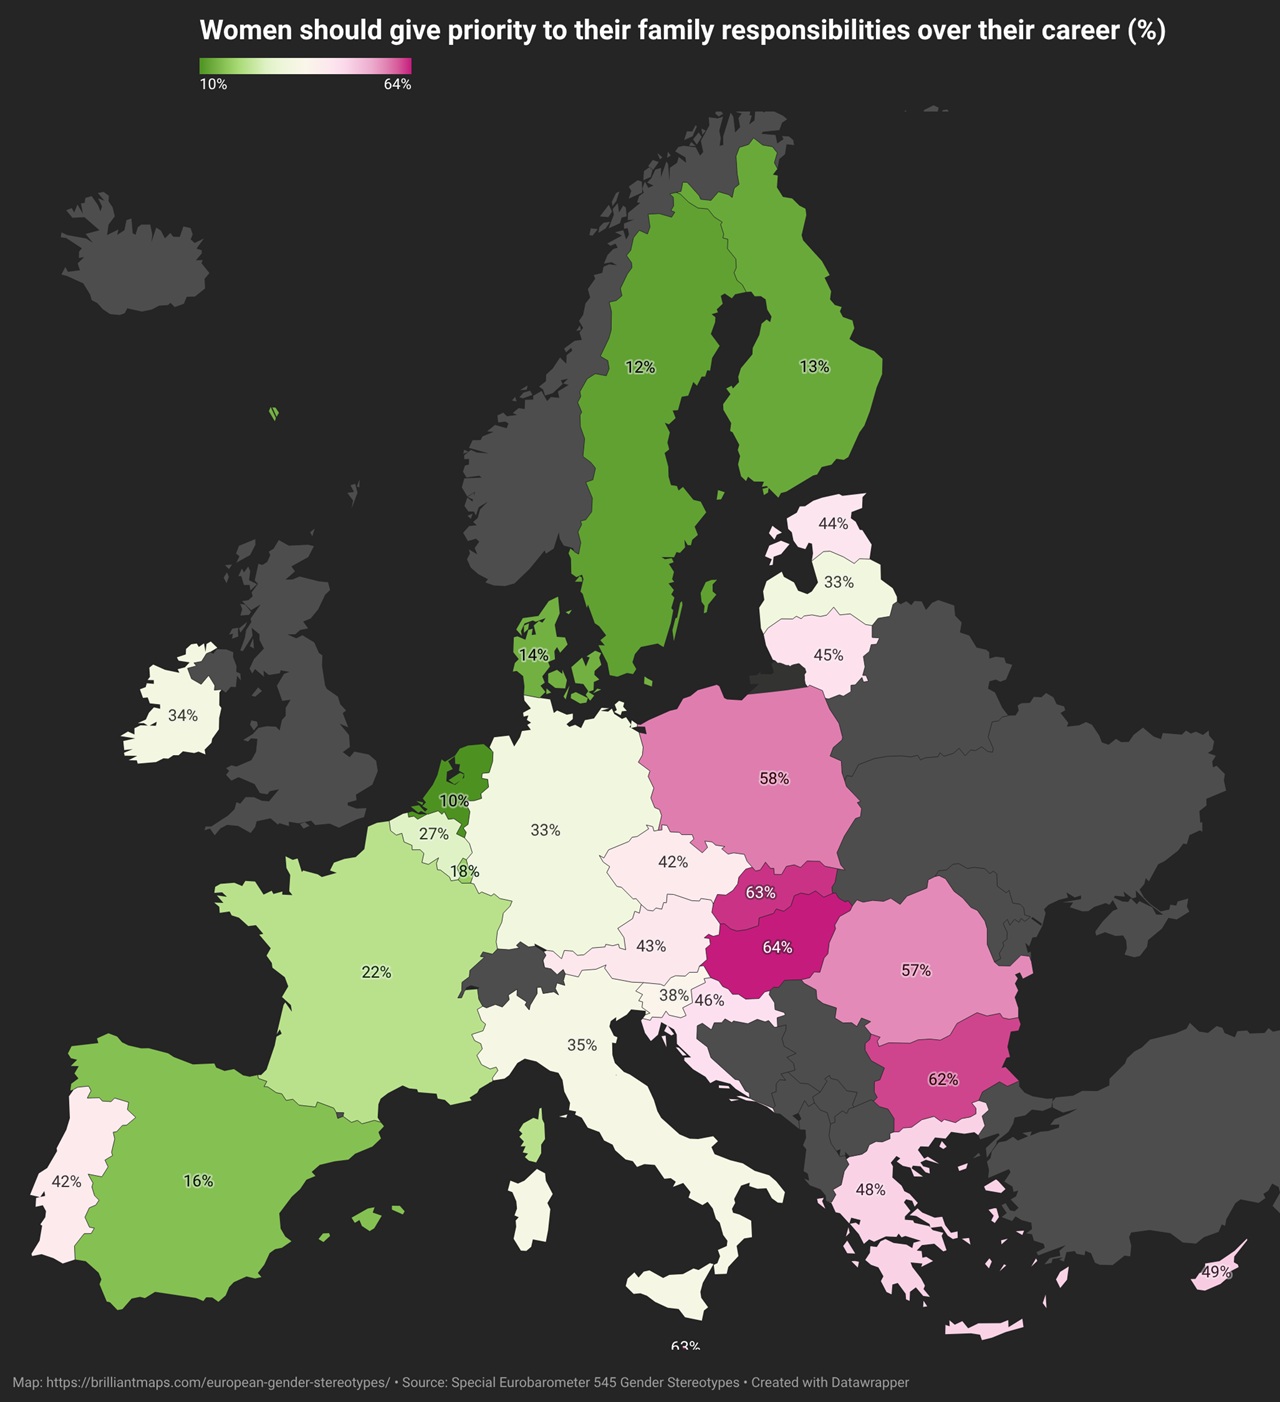
| Country | Total 'Agree' | Total 'Disagree' | Totally agree | Tend to agree | Tend to disagree | Totally disagree | It depends (SPONTANEOUS) | Don't know |
|---|---|---|---|---|---|---|---|---|
| European Union (EU27) | 34% | 61% | 9% | 25% | 30% | 31% | 2% | 3% |
| Belgium | 27% | 71% | 5% | 22% | 35% | 36% | 1% | 1% |
| Bulgaria | 62% | 32% | 21% | 41% | 24% | 8% | 2% | 4% |
| Czechia | 42% | 52% | 10% | 32% | 34% | 18% | 1% | 5% |
| Denmark | 14% | 76% | 4% | 10% | 21% | 55% | 5% | 5% |
| Germany | 33% | 60% | 9% | 24% | 32% | 28% | 4% | 3% |
| Estonia | 44% | 42% | 13% | 31% | 28% | 14% | 9% | 5% |
| Ireland | 34% | 58% | 9% | 25% | 29% | 29% | 3% | 5% |
| Greece | 48% | 48% | 13% | 35% | 36% | 12% | 3% | 1% |
| Spain | 16% | 77% | 5% | 11% | 26% | 51% | 2% | 5% |
| France | 22% | 72% | 6% | 16% | 30% | 42% | 1% | 5% |
| Croatia | 46% | 50% | 12% | 34% | 34% | 16% | 2% | 2% |
| Italy | 35% | 63% | 9% | 26% | 38% | 25% | 0% | 2% |
| Cyprus | 49% | 45% | 19% | 30% | 24% | 21% | 1% | 5% |
| Latvia | 33% | 61% | 13% | 20% | 39% | 22% | 3% | 3% |
| Lithuania | 45% | 49% | 12% | 33% | 29% | 20% | 4% | 2% |
| Luxembourg | 18% | 71% | 5% | 13% | 33% | 38% | 9% | 2% |
| Hungary | 64% | 33% | 23% | 41% | 24% | 9% | 2% | 1% |
| Malta | 63% | 33% | 15% | 48% | 18% | 15% | 3% | 1% |
| Netherlands | 10% | 86% | 2% | 8% | 24% | 62% | 3% | 1% |
| Austria | 43% | 44% | 11% | 32% | 26% | 18% | 10% | 3% |
| Poland | 58% | 36% | 14% | 44% | 26% | 10% | 3% | 3% |
| Portugal | 42% | 53% | 5% | 37% | 42% | 11% | 2% | 3% |
| Romania | 57% | 41% | 17% | 40% | 31% | 10% | 1% | 1% |
| Slovenia | 38% | 58% | 11% | 27% | 31% | 27% | 2% | 2% |
| Slovakia | 63% | 32% | 18% | 45% | 22% | 10% | 2% | 3% |
| Finland | 13% | 79% | 5% | 8% | 26% | 53% | 7% | 1% |
| Sweden | 12% | 86% | 2% | 10% | 15% | 71% | 1% | 1% |
Men often earn more than women because their jobs are more demanding (%)
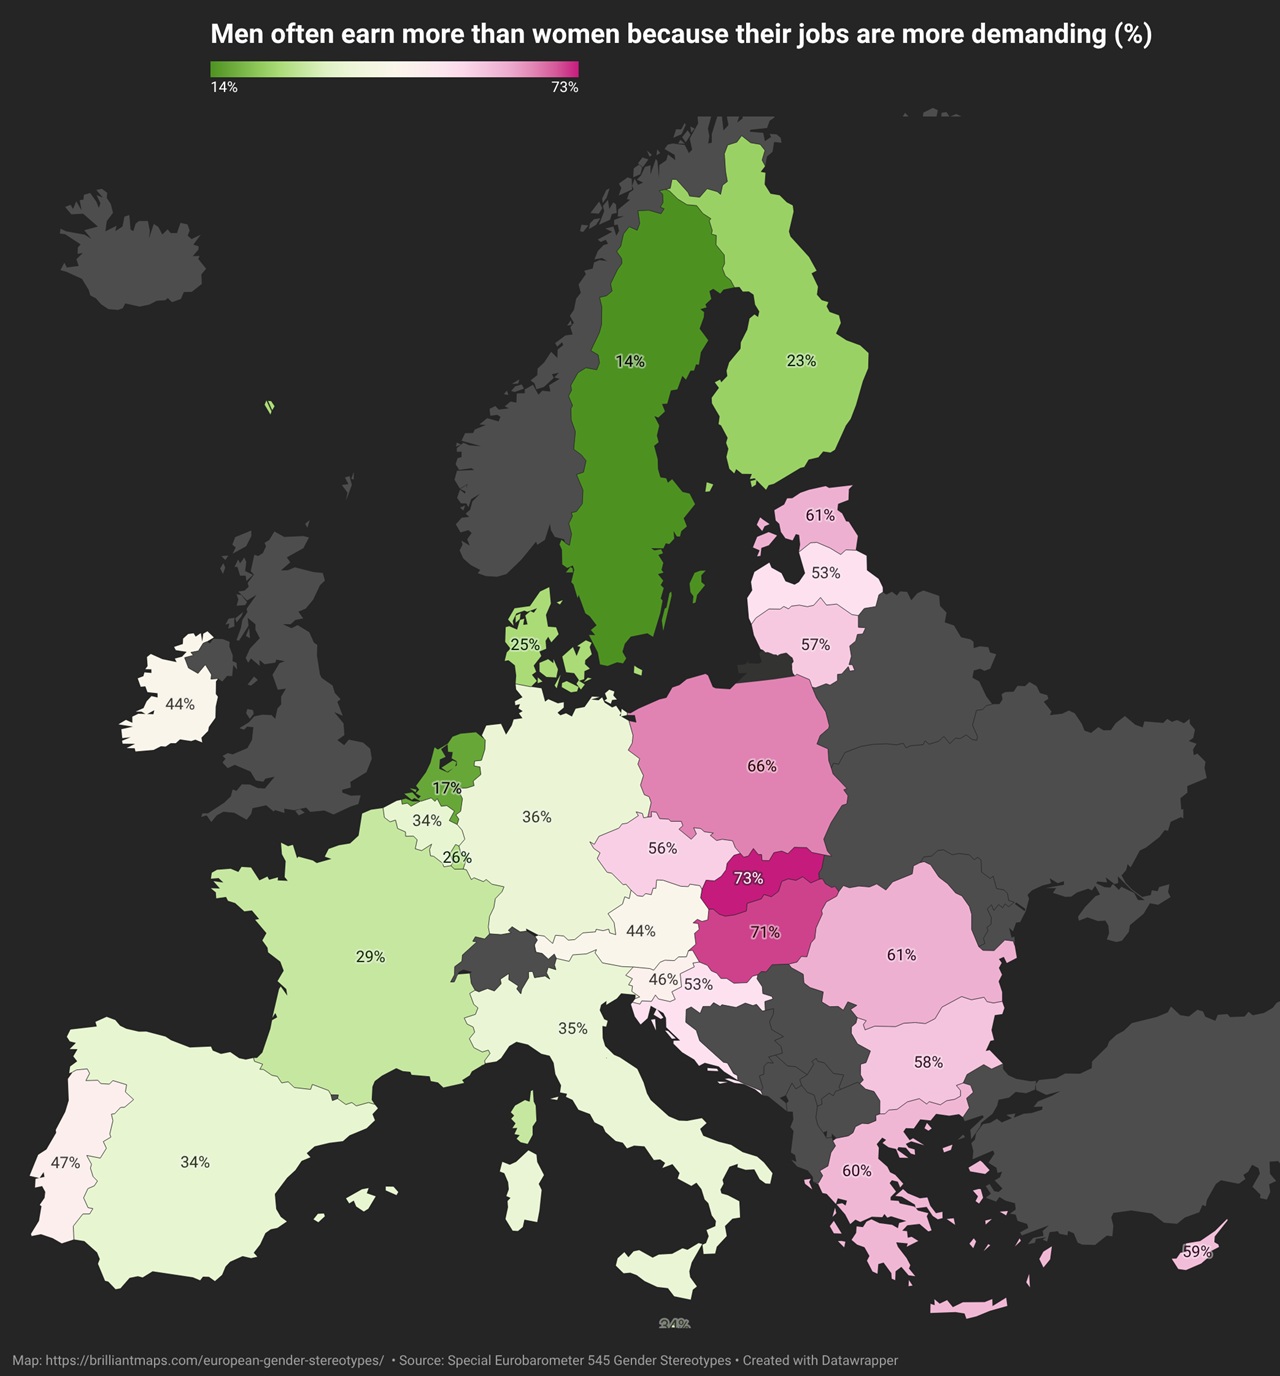
| Country | Total 'Agree' | Total 'Disagree' | Totally agree | Tend to agree | Tend to disagree | Totally disagree | It depends (SPONTANEOUS) | Don't know |
|---|---|---|---|---|---|---|---|---|
| European Union (EU27) | 40% | 56% | 13% | 27% | 29% | 27% | 2% | 2% |
| Belgium | 34% | 62% | 9% | 25% | 32% | 30% | 2% | 2% |
| Bulgaria | 58% | 37% | 25% | 33% | 25% | 12% | 1% | 4% |
| Czechia | 56% | 40% | 19% | 37% | 29% | 11% | 1% | 3% |
| Denmark | 25% | 69% | 10% | 15% | 25% | 44% | 3% | 3% |
| Germany | 36% | 60% | 12% | 24% | 27% | 33% | 2% | 2% |
| Estonia | 61% | 28% | 20% | 41% | 20% | 8% | 6% | 5% |
| Ireland | 44% | 50% | 12% | 32% | 28% | 22% | 2% | 4% |
| Greece | 60% | 38% | 21% | 39% | 30% | 8% | 1% | 1% |
| Spain | 34% | 61% | 11% | 23% | 26% | 35% | 1% | 4% |
| France | 29% | 67% | 8% | 21% | 34% | 33% | 1% | 3% |
| Croatia | 53% | 45% | 16% | 37% | 30% | 15% | 1% | 1% |
| Italy | 35% | 63% | 9% | 26% | 37% | 26% | 0% | 2% |
| Cyprus | 59% | 38% | 25% | 34% | 25% | 13% | 0% | 3% |
| Latvia | 53% | 41% | 23% | 30% | 30% | 11% | 3% | 3% |
| Lithuania | 57% | 39% | 18% | 39% | 27% | 12% | 1% | 3% |
| Luxembourg | 26% | 67% | 7% | 19% | 32% | 35% | 5% | 2% |
| Hungary | 71% | 26% | 26% | 45% | 20% | 6% | 2% | 1% |
| Malta | 34% | 61% | 6% | 28% | 37% | 24% | 3% | 2% |
| Netherlands | 17% | 79% | 4% | 13% | 32% | 47% | 2% | 2% |
| Austria | 44% | 48% | 17% | 27% | 25% | 23% | 6% | 2% |
| Poland | 66% | 31% | 20% | 46% | 21% | 10% | 2% | 1% |
| Portugal | 47% | 49% | 6% | 41% | 39% | 10% | 1% | 3% |
| Romania | 61% | 36% | 26% | 35% | 26% | 10% | 0% | 3% |
| Slovenia | 46% | 52% | 15% | 31% | 30% | 22% | 1% | 1% |
| Slovakia | 73% | 23% | 25% | 48% | 16% | 7% | 2% | 2% |
| Finland | 23% | 70% | 6% | 17% | 29% | 41% | 5% | 2% |
| Sweden | 14% | 84% | 3% | 11% | 19% | 65% | 1% | 1% |
Men taking parental leave show a lack of ambition for their career (%)
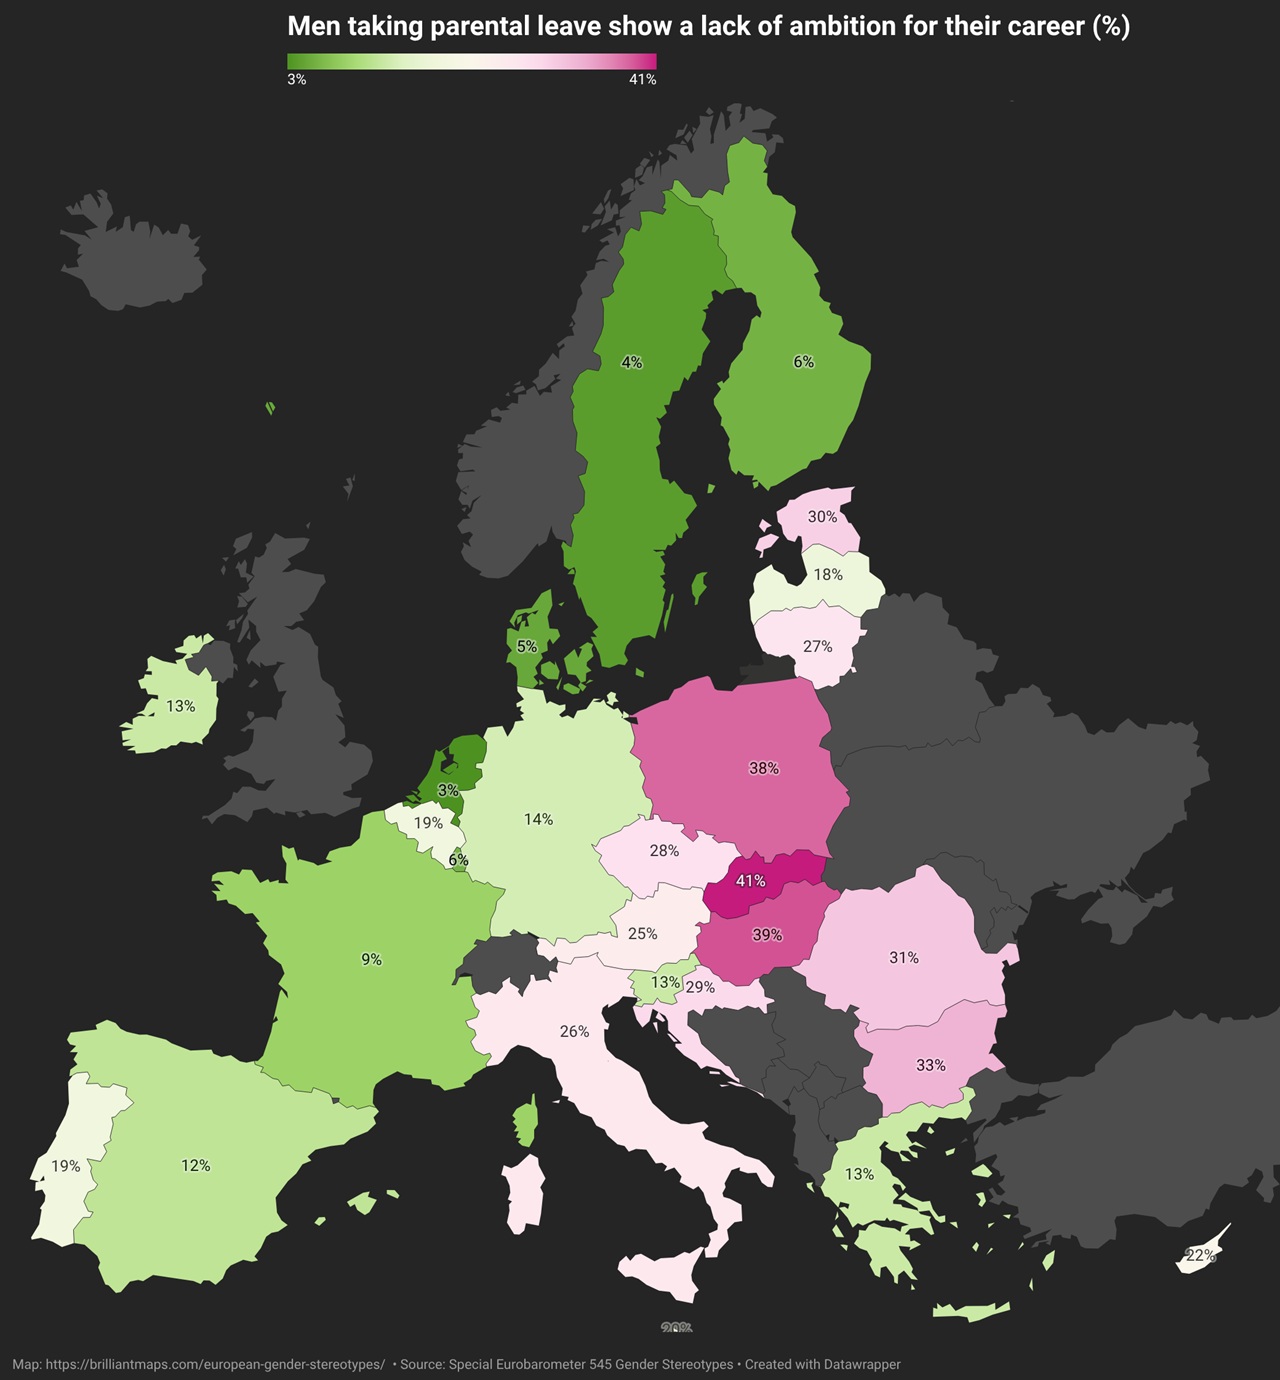
| Country | Total 'Agree' | Total 'Disagree' | Totally agree | Tend to agree | Tend to disagree | Totally disagree | It depends (SPONTANEOUS) | Don't know |
|---|---|---|---|---|---|---|---|---|
| European Union (EU27) | 19% | 77% | 5% | 14% | 31% | 46% | 1% | 3% |
| Belgium | 19% | 79% | 4% | 15% | 32% | 47% | 1% | 1% |
| Bulgaria | 33% | 58% | 11% | 22% | 30% | 28% | 2% | 7% |
| Czechia | 28% | 65% | 7% | 21% | 40% | 25% | 1% | 6% |
| Denmark | 5% | 91% | 2% | 3% | 12% | 79% | 1% | 3% |
| Germany | 14% | 82% | 4% | 10% | 33% | 49% | 1% | 3% |
| Estonia | 30% | 54% | 9% | 21% | 34% | 20% | 6% | 10% |
| Ireland | 13% | 83% | 3% | 10% | 28% | 55% | 0% | 4% |
| Greece | 13% | 82% | 4% | 9% | 31% | 51% | 1% | 4% |
| Spain | 12% | 83% | 3% | 9% | 22% | 61% | 1% | 4% |
| France | 9% | 87% | 2% | 7% | 27% | 60% | 0% | 4% |
| Croatia | 29% | 69% | 8% | 21% | 38% | 31% | 1% | 1% |
| Italy | 26% | 71% | 7% | 19% | 39% | 32% | 0% | 3% |
| Cyprus | 22% | 73% | 6% | 16% | 23% | 50% | 0% | 5% |
| Latvia | 18% | 67% | 6% | 12% | 36% | 31% | 2% | 13% |
| Lithuania | 27% | 64% | 9% | 18% | 33% | 31% | 2% | 7% |
| Luxembourg | 6% | 91% | 1% | 5% | 29% | 62% | 1% | 2% |
| Hungary | 39% | 55% | 11% | 28% | 30% | 25% | 3% | 3% |
| Malta | 20% | 77% | 1% | 19% | 34% | 43% | 1% | 2% |
| Netherlands | 3% | 96% | 1% | 2% | 19% | 77% | 1% | 0% |
| Austria | 25% | 67% | 8% | 17% | 29% | 38% | 3% | 5% |
| Poland | 38% | 59% | 11% | 27% | 37% | 22% | 2% | 1% |
| Portugal | 19% | 77% | 2% | 17% | 52% | 25% | 1% | 3% |
| Romania | 31% | 64% | 6% | 25% | 41% | 23% | 1% | 4% |
| Slovenia | 13% | 85% | 4% | 9% | 31% | 54% | 1% | 1% |
| Slovakia | 41% | 53% | 12% | 29% | 30% | 23% | 2% | 4% |
| Finland | 6% | 91% | 2% | 4% | 18% | 73% | 2% | 1% |
| Sweden | 4% | 95% | 1% | 3% | 5% | 90% | 0% | 1% |


Leave a Reply