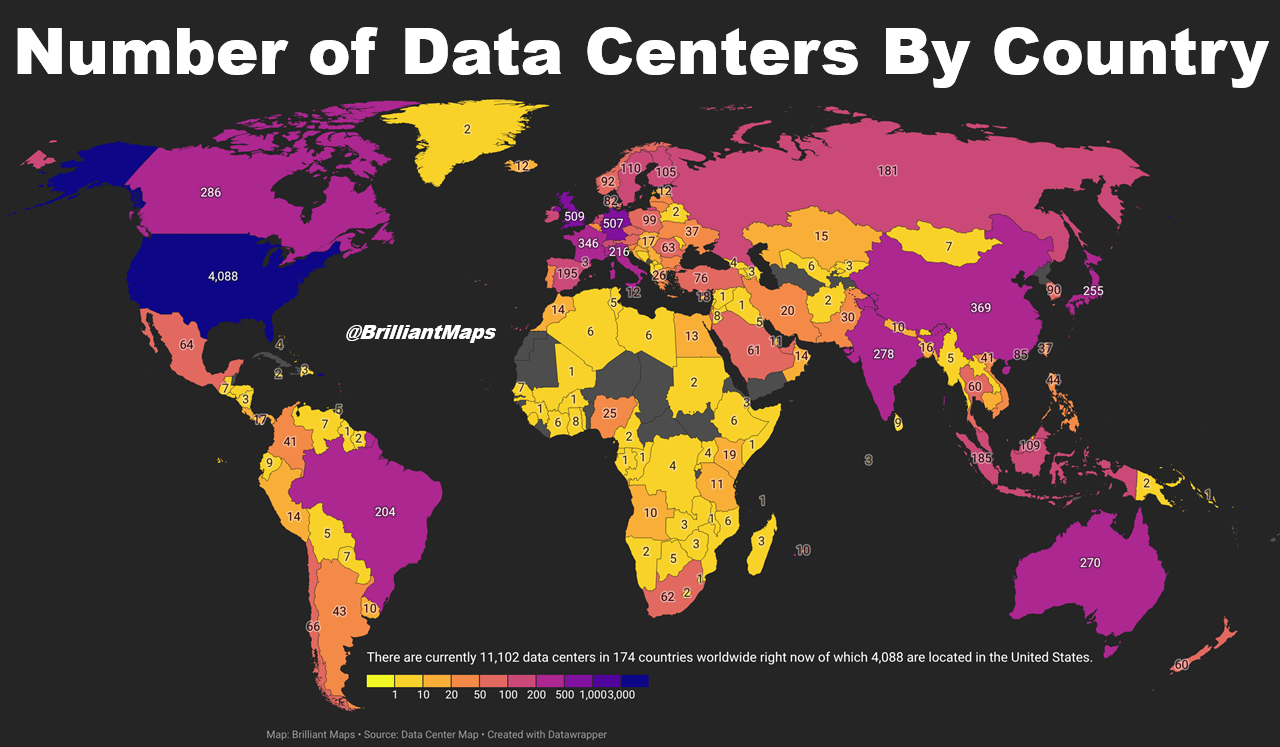
The map above shows the 7 ways Russia and Russians have competed at the Olympic Games Since 1896.
Here is a comparison of the various versions their Olympic participation over the past 120 years.
Making Sense Of The World, One Map At A Time
Last Updated: Leave a Comment

The map above shows the 7 ways Russia and Russians have competed at the Olympic Games Since 1896.
Here is a comparison of the various versions their Olympic participation over the past 120 years.
Last Updated: 2 Comments

The map above shows all the countries in the world that have won fewer Olympic medals than East Germany, who last competed at a games in 1988. In total, they won 519 medals across 5 Summer and 6 Winter Game appearances.
At just 16.4 million people at the time of reunification, East Germany has still won more medals than India (pop 1.47 Billion) in less than a third as many appearances.
In fact, only 14 countries have won more and are listed below along with a breakdown between summer and winter Olympic performances.
Last Updated: Leave a Comment

The old saying goes that everything is bigger in Texas, but is it true?
Geographically, Texas is only the world’s 26th largest subdivision, which means there are 25 subdivisions which are bigger.
In fact it isn’t even in the biggest in the United States (that honour of course goes to Alaska).
Last Updated: Leave a Comment

The map above shows which African countries have participated in which international sporting tournaments.
Here is a list by sport:
Last Updated: Leave a Comment

The map above shows the number of times each country’s name appears in the Epstein files. I had an idea to do a similar map, but then I saw that reddit user Extreme-Shopping74 had beat me to.
Here are a few key things from the map:
Last Updated: 1 Comment

The map above compares non-inflation adjusted house prices by state in 2000 vs House prices in December 2025 according to Zillow’s All Home Index.
In 2000, not a single state had average home prices above $200k, the closest was Massachusetts at $192,616.
However, by 2026 only 2 states had average home prices below $200k: Mississippi and West Virginia.
Here’s the data below, including raw numbers, inflation adjusted numbers and 2026 numbers:
Last Updated: Leave a Comment
I’m a huge fan of Jay Foreman and Mark Cooper-Jones Map Men series.
You can watch their videos in chronological release order here on Youtube.
And buy a copy of their book: This Way Up: When Maps Go Wrong (And Why It Matters) here.
But which of their videos is the most popular?
Below we rank them from least to least popular (based on view count) with a brief summary of each video:
Last Updated: Leave a Comment

The Short answer is because it stopped being mysterious once people realized there was nothing unusually dangerous about it.
Last Updated: 2 Comments

Here’s an overview of the proposed “two-speed Europe” plan and the emerging E6 group, based on Reuters and related reporting.
Last Updated: 1 Comment

I have 3 young kids so can only dream of sleeping in to 7:33am.
With a little digging I found that the times come 2015 study on 941,300 male and female Sleep Cycle app users.
Among other things it found that: