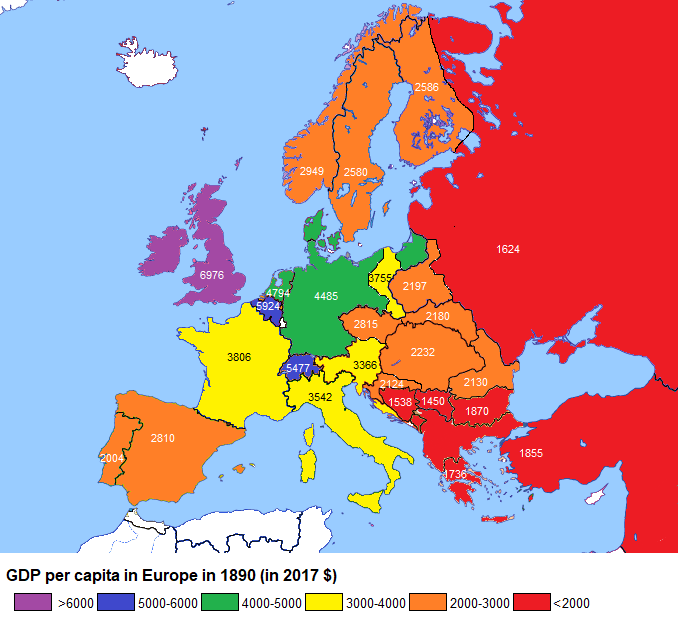
The map above shows the very approximate GDP per capita for various European states in 1890. Below we look at how these have changed over the past 127 years.
The table below lists most entities for which data are shown on the map. However, not all these entities were sovereign states in 1890 and the list includes some that were dependencies of other states at the time.
The table compares GDP (PPP) per capita in thousands of 2017 US dollars in 1890 and 2017. However, it should be noted that the boundaries of some states have shifted between the two dates, so that comparisons in such cases are approximate at best.
| COUNTRY | GDP PER CAPITA 1890 ($,000s) | RANK 1890 | GDP PER CAPITA 2017 ($,000s) | RANK 2017 | GAIN IN GDP PER CAPITA ($,000s) | % GAIN |
|---|---|---|---|---|---|---|
| UK | 7.0 | 1 | 43.6 | 10 | 36.6 | 523 |
| Belgium | 5.9 | 2 | 46.3 | 8 | 40.4 | 685 |
| Switzerland | 5.5 | 3 | 61.4 | 2 | 55.9 | 1016 |
| Netherlands | 4.8 | 4 | 53.6 | 3 | 48.8 | 1017 |
| Germany | 4.5 | 5 | 50.2 | 5 | 45.7 | 1016 |
| Denmark | 4.2 | 6 | 49.6 | 6 | 45.4 | 1081 |
| France | 3.8 | 7 | 43.6 | 11 | 39.8 | 1047 |
| Italy | 3.5 | 8 | 38 | 13 | 34.5 | 986 |
| Austria** | 3.4 | 9 | 49.2 | 7 | 45.8 | 1347 |
| Norway | 2.9 | 10 | 70.6 | 1 | 67.7 | 2334 |
| Czech lands* | 2.8 | 11 | 35.2 | 14 | 32.4 | 1157 |
| Spain | 2.8 | 12 | 38.2 | 12 | 35.4 | 1264 |
| Finland* | 2.6 | 13 | 44.1 | 9 | 41.5 | 1596 |
| Sweden | 2.6 | 14 | 51.3 | 4 | 48.7 | 1873 |
| Hungary** | 2.2 | 15 | 28.9 | 18 | 26.7 | 1214 |
| Poland* | 2.2 | 16 | 29.3 | 17 | 27.1 | 1232 |
| Slovakia* | 2.2 | 17 | 32.9 | 15 | 30.7 | 1395 |
| Romania | 2.1 | 18 | 24 | 22 | 21.9 | 1043 |
| Croatia* | 2.1 | 19 | 24.1 | 21 | 22 | 1048 |
| Portugal | 2.0 | 20 | 30.3 | 16 | 28.3 | 1415 |
| Bulgaria | 1.9 | 21 | 21.6 | 23 | 19.7 | 1037 |
| Greece | 1.7 | 22 | 27.8 | 20 | 26.1 | 1535 |
| Russia | 1.6 | 23 | 27.9 | 19 | 26.3 | 1644 |
| Montenegro | 1.5 | 24 | 17.4 | 24 | 15.9 | 1060 |
| Bosnia & Herzegovina* | 1.5 | 25 | 11.4 | 26 | 9.9 | 619 |
| Serbia | 1.5 | 26 | 15.2 | 25 | 13.7 | 913 |
*In 1890 these were dependencies of other states.
**In 1890 these were parts of the Austro-Hungarian Empire.
The 1890 data are as shown on the map, as derived from Wikipedia, while the source for 2017 data is the IMF World Economic Outlook.
Caveats:
The numbers for 1890 are based on very rough estimates. While the map does give a general idea of the relative prosperity of different countries in 1890, the actual numbers should not be taken too literally.
Moreover, purchasing power parity is notoriously difficult to measure, while GDP itself is an imprecise measure of national prosperity. For example, it does not include the value of many non-market transactions.
For a discussion of the limitations of GDP see: The trouble with GDP
Observations:
All the countries listed have experienced significant growth in GDP (PPP) per capita since 1890, most by a factor of 10 or more. However, there is a wide variation in the amount of growth, ranging from around $10,000 to $68,000.
The largest such gains were experienced by Norway ($67.7K), Switzerland ($55.9K), Netherlands ($48.8K), Sweden ($48.7K), Germany ($45.7K) and Denmark ($45.4K).
Those gaining the least were Bosnia & Herzegovina ($9.9K), Serbia ($13.7K), Montenegro ($15.9K), Bulgaria ($19.7K), Romania ($21.9K) and Croatia ($22.0K).
One of the most striking changes between 1890 and the present is the decline in the relative position of the UK (which at that time included the whole of Ireland) and, to a lesser extent, Belgium.
Italy, France and Romania also lost some ground in the rankings.
In 1890 the UK was a leading industrial power, while Belgium was the first country on the European continent to industrialise.
Another significant change is the rise in the relative position of the Nordic countries (especially Norway, Sweden and Finland) since 1890.
These countries had been slower to industrialize, but advanced rapidly in the ensuing decades. Portugal and Russia also moved up noticeably in the rankings since 1890, although from a lower base.
If you’d like to learn more about this topic, have a look at the following books:
- An Economic History of Europe: Knowledge, Institutions and Growth, 600 to the Present
- The Cambridge Economic History of Modern Europe: Volume 2, 1870 to the Present
- A Short History of the British Industrial Revolution
Enjoy this post? Please help us by sharing it:


John Galt says
Norway jumped because of ‘oil’ but unsure about Sweden. And Finland, relatively, is has not moved much.
Korakys says
Haha, trying to come up with excuses as to why the countries with highest tax rates are also the richest? Libertarians always struggle when it comes to historical data. Co-operation will always beat individuals.
X3Charlie says
Sweden actually had a very free market economy. The welfare states didn’t come until the 1970s when these countries already became rich. Even today despite their welfare state Sweden has freer business climate than the US. Although they’ve been reducing their social spending for decades now.
Karl W South says
Would be very interesting to know what the figure/change would be for Ireland if it was possible to get separate statistics.
Girdon Benton says
… and Iceland.
Vaclav Sulista says
Just simply Czechia, official short name, no Czech Lands needed.
Martin Lunnon says
I’m surprised the Czech Lands (1890)/Czechia (2018) weren’t richer in 1890. I’d understood that they held the vast bulk of the Austro-Hungarian empire’s industry. What became Austria pist-1918, with the exception of Vienna and around, was largely poor farming country, in large part due to its mountainous terrain, I’ve been led to understand.
Ödön Kakucsi says
Nope. “Since the turn of the twentieth century, the Austrian half of the Empire could preserve its dominance within the empire in the sectors of the first industrial revolution, but Hungary had a better position in the industries of the second industrial revolution, in these modern sectors of the second industrial revolution the Austrian competition could not become dominant”
Paul McCarthy says
Why have you left Ireland off the list?
I find your map ignorant rather than brilliant.
Richard Keogh says
Ireland was part of the UK in 1890, it’s right there on the map.
Geraldo Fitzblighter says
Still, the whole idea is off. The supposed wealth in the UK derived at this point in time – 1890- primarily from a history of slavery and colonisation. They had banned slavery but they compensated the aristocracy for giving it up and of course never gave a penny back.
You can be sure there was no benefit of this high UK GDP to the vast majority of people living in the UK. Leaving Ireland aside where famine was considered the government’s social policy, the leaders in the UK did nothing for their own citizens who wasn’t already rich. The citizens of Manchester, Glasgow, Liverpool, Belfast fared no better than anyone else. Sadly this is still the UK’s govt. policy.
Unfortunately this type of false or distorted data gives credence to those who imagine Britain had a golden age. If they did it was a golden age of plunder and brutal dictatorship. Nothing less.
How about a mop showing where the British Empire acquired its wealth? It would be ab excellent starting point for the repatriation and reparations planners.
vagabundus says
Slovakia was not dependent, Slovakia was nonexisting in 1890. So it deserves two *-s.
Tiny Giant says
so a i can see … some contries are Missing!!!
Yugoslavia had – Montenegro, Serbia, Croatia, BiH, Macedonia and Slovenia Macedonia and Slovenia are a MISS and like Vatican, Lichtenstein, Luxeburg, …
Sloppy job