
Think immigration is too high in Europe? If so, do you know how many foreigners do you think live in your country? The numbers may be far lower than you think.
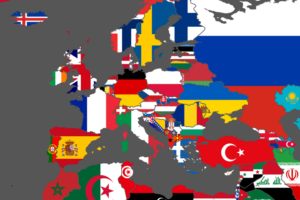
The map above shows the percentage of the foreign citizens (split between EU and non-EU nationals) living in many European countries. While the media loves to portray the continent as being overrun with foreigners, the truth is quite different.
Below are the percentage of foreign citizens by country, based off data from Eurostat:
- Luxembourg: 43.8% (37.9% EU and 5.9% non-EU)
- Lichtenstein: (non-EU) 33.3% (16.7% EU and 16.7% non-EU)
- Switzerland: (non-EU) 22.8% (14.8% EU and 8.5% non-EU)
- Cyprus: 20.0% (12.6% EU and 7.4% non-EU)
- Latvia: 16.3% (0.3% EU and 16.0% non-EU)
- Estonia: 15.7% (1.1% EU and 14.6% non-EU)
- Spain: 12% (5.1% EU and 6.9% non-EU)
- Austria: 11.2% (4.5% EU and 6.7% non-EU)
- Belgium: 11.0% (7.0% EU and 4.0% non-EU)
- Ireland: 10.6% (8.5% EU and 2,2% non-EU)
- Germany: 9.1% (3.4% EU and 5.7% non-EU)
- Greece: 8.6% (1.3% EU and 7.3% non-EU)
- Norway: (non-EU) 8.3% (5.0% EU and 3.3% non-EU)
- Italy: 7.9% (2.4% EU and 5.5% non-EU)
- United Kingdom: 7.6% (3.7% EU and 3.9% non-EU)
- Montenegro: (non-EU) 7.4% (0.2% EU and 7.2% non-EU)
- Sweden: 6.8% (2.9% EU and 3.9% non-EU)
- EU27 average: 6.8% (2.7% EU and 4.1% non-EU)
- Iceland: (non-EU) 6.6% (5.2% EU and 1.4% non-EU)
- Denmark: 6.4% (2.4% EU and 4.0% non-EU)
- France: 5.9% (2.1% EU and 3.8% non-EU)
- Malta: 4.9%
- Portugal: 4.2% (1.0% EU and 3.1% non-EU)
- Slovenia: 4.2% (0.3% EU and 3.9% non-EU)
- Netherlands: 4.2% (2.2% EU and 2.0% non-EU)
- Czech Republic: 4.0% (1.4% EU and 2.6% non-EU)
- Finland: 3.4% (1.3% EU and 2.1% non-EU)
- Hungary: 2.1% (1.3% EU and 0.8% non-EU)
- Slovakia: 1.3% (1.0% EU and 0.3% non-EU)
- Lithuania: 0.7% (0.1% EU and 0.6% non-EU)
- Bulgaria: 0.6% (0.2% EU and 0.4% non-EU)
- Croatia: 0.6% (0.2% EU and 0.4% non-EU)
- Turkey: (non-EU) 0.3% (0.1% EU and 0.2% non-EU)
- Romania: 0.2% (0.1% EU and 0.1% non-EU)
- Poland: 0.1% (0.0% EU and 0.1% non-EU)
So based on the data above, Luxembourg is the most generous country overall with over 40% of its population being foreign citizens, although mostly from the EU. Lichtenstein and Switzerland, while not EU members themselves, are also both very generous to EU citizens.
Estonia and Latvia are interesting as while they’re not yet especially rich, they still host a large number of non-EU nationals. The explanation is many ethnic Russians living in both countries at the time of independence have chosen not to become citizens.
Lithuania does not have this issue, because when it became independent it had far fewer ethnic Russians living its borders and so made them all citizens.
At the other extreme you have Poland and Romania which are the most exclusionary states in the EU.
Overall, non-EU states seem to be more generous than EU countries with Lichtenstein, Switzerland, and Norway all allowing in more foreigners than the EU27 average (and more than the UK).
Considering that these are 3 of the richest countries in Europe, it seems difficult to take the claim that immigrants simply “sponge off benefits” or are “a burden to their host countries” seriously.
In fact, it seems the reverse is true. Countries with a high proportion of EU migrants seem to be richer than those with fewer. Of course people are attracted to countries that are doing well, so more immigrants should be seen as a sign of sucess and be celebrated rather than a cause for alarm.
How do you feel now about immigration in Europe? Still think it’s too high? Leave your comments below:


P says
Not true! After receiving citizenship imigrant is classified as citizen.
Daniel says
What about immigrants who have new citizenship? lol. What about their childrens. These statics are quite useless without them.
BreakTheChains says
The comment by Daniel proves that those who have taken citizenship are still viewed as foreigners and outsiders!!!
Cody Crouse says
I can’t say that I disagree with you. Honestly, Birthrates tend to fall in line with the native population over time. There is no Islamification of Europe in the making. White people will still be a majority in every European country. Besides, most immigrants to Western Europe are from other European countries. When they come, they get married, have quite a few kids & their birthrates will fall in line with the rest of the native population.
Marian Harkin says
One small issue,Ireland is listed as non EU just need to correct that otherwise really useful and visually very impressive.
Isänmaan Sisu says
WAY TOO HIGH, AND PAY ATTENTION, THIS IS FROM 2012. NOW IN 2015 ITS MUCH MORE. DEMOGRAFIC CATASTROFE IS LOOMING, ISLAM AND TERRORISM ON THE RISE, HARDLY NEW KIDS TO THE LOCALS VERSUS THE COMERS. THE POPULATIONS ARE BEING REPLACED. FUTURE GENERATIONS WILL CURSE US. WE ARE ON THE VERGE. DONT FORGET TO VOTE FOR YOUR COUNTRIES PATRIOTIC PARTIES!
Photo from average school class in Sweden. -Ready for her future?
botmetkas@gmail.com says
Who and what data are the source to compose this map. The “giving citizen status” then off the charts immigrants, the natalist patern of immigrants, are to be factored to give the map any meaning.
A case of bad science, methodology, a single layer myopic view with no references to author and data.
Kevin says
You are clearly mental. Consider that we all move around, sometimes invading other continents ( Africa India Americas antipodes etc) for financial reasons, setting up subservient governments to serve us not their subjects, and then forcing religious credo on the inhabitants… tell me again how the immigrants are polluting our culture. We started this by robbing their regions blind. Now the hens come home to roost.
Aaron says
well said Kevin!
tom says
Good map, but bad conclusions. It is not that some countries are “exclusionary.” Who wants to live in Poland or Romania when wages there are low? Thus, not many migrants… Fyi… Lichteinstein is only 37,000 people or so. If you add 370 people to Lichtenstein, you are increasing the population by 1%.
Garry Taylor says
worth remembering that switzerland has very tight citizenship policy.many italians came to switzerland in the 50s and they and there children and grandchildren are still not citizens, that would explain the 22 percent non citizen.
Kulcsár Dalma says
In Turkey, however, there there might be a little more than 0.3% foreigners in the refugee camps, aren’t there?
Puff says
This map is not brilliant at all. % of residents not having the citizenship does not tell anything.
Concerns
1. Too strict/too liberal citizenship policies. (If your concern is that you see too many, say, muslims in your cities, you’ll not be happier if you learn that they have the same passport as you. Nay!)
2.EXPATS should not be counted as migrants. Countries that host HQs of multinational companies there are many (e.g. Switzerland, Luxembourg, Ireland)
3. SPOUSES should not be counted. If two fellow citizens marries citizens of country A and decide to live in our country, statistically it is the same when a couple from country A relocates to our country. But the effect is quite different.
Frank Kavanagh says
A so-called ”expat” IS a migrant.
Elaine Shadowlein says
Well, luxembourg might have the most foreign citizens, but we had a referendum about foreign citizens being able to vote (because it seems pretty unfair if half of the people living here and working here are not allowed to vote) but it was voted no by 80%.
Oksana Mashchak says
I agree with Daniel, statistics does not show all naturalized citizens that are currently residing in those countries. And this is such a “stick that has two ends” type of a topic. I am an immigrant (not in EU) but I have worked pretty much from week 3 of my arrival in the country and for years paid taxes and contributed to the economy… Which does not hold true for all immigrants, as some come and disrespect rules, laws, language and juts abuse the benefits.
Fuk Yu Iny Ass says
This map is just WRONG. I’m not sure what these numbers represent but its definately NOT a reflection of immigrants. Example: Spain has more than England. If you travel around those two countries you’ll see for yourself what bull this map is.
Just rubbish.
Víctor Gras Valentí says
Mr Fuk Yu: You say that travelling and seeing suffices to proof this. So maybe your criteria is considering whoever of indian, black, arabic… whatever other ethnic as not british.
Then I guess your criteria is the problem: naturalised migrants are not migrants anymore concerning stats. I wonder whether it’s just a society failure or just prejudice what makes them migrants to your eye, while they might perfectly be british-born.
Spain has heaps of “new”, non-naturalised migrants, arrived in the 90’s, which in the overall numbers might give you the impression to be less that in England, but that’s not what counts in statistics.
BS says
If your goal is to slowly make Europe non-white then this is a good way to go about it. Migration considering Europeans is a one way street. There are not Europeans now overwhelming other countries. On the contrary, other countries are freely cutting down their minority population while producing way too many “pure” of their own black and brown population while calling Europeans racist for now wanting them to turn Europe non-white at no cost to their own homelands.
MickeyMouse says
do you believe Eurostat statistics?… come on!
Robert Basset says
Nonsense from a serial nonsense spreader, taking advantage of easily spun stats to push the pro-mass immigration agenda.
ppp says
in Latvia and Estonia high precentage is not “Foreign Citizens”, but rather so-called non-citizens, who were given alien status after 1991, even though mist of them were born there
Angel says
The percentage of immigrants in The Netherlands is 23,1% in 2018. I suggest you use valid and recent data before you put your maps online…
Source: https://opendata.cbs.nl/statline/#/CBS/nl/dataset/37296ned/table?dl=107C4
Dave says
You failed to count all naturalized immigrants, who have the nationality but fail to integrate, which is a serious issue. Also the amount of illegal nondocumented immigrants is not counted, which is again very high in some countries.
When making value judgements, it would help if you actually knew what you were talking about…
Igor says
About Latvia and Estonia non-citizens: they didn’t choose to remain this way. They were denied citizenship when new states were established in 1991. I am one of them. Later they were allowed to apply for citizenship, the process including language tests and Oath of Allegiance(to those who betrayed them back in 1991)
QWER says
About Poland… Poland in 2012 wasn’t attractive to immigrants, unemployment was over 10%, our country was in poor economic condition, no job, no prospects. Now the situation is different, now more and more people are coming to Poland. We didn’t agree to accept immigrants from the Middle East during the crisis. However, we issue a lot of permission to come for Ukrainians. In recent years we have been in the lead in EU in issuing residence permits.
Xiep says
This map is crap… In France we have : 67 millions people with at least :
– 5 millions from Algeria (Pieds-Noirs exclued)
– 1 million from Morroco
– 1 million from Tunisia
– 5 millions from Black Africa (3 millions from French Antilles are not inclued)
– 1 million from Asia
– 1 million from Turkey
14 millions immigrants, at least 20 % !!!
French paper don’t mean they’re french. They are as french as a cat born in a stable is a horse.
Andr says
The problem is when you realize, sooner than later, that you don’t have but you are. Dystopian.
Andr says
4.7% average in EU is huge.