
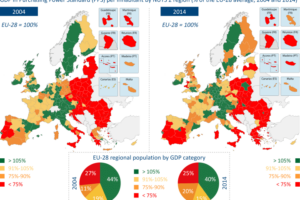
The map above shows the contributors and beneficiaries of the European Union (EU) budget. It categorizes EU member states into two groups: those that contribute more to the EU budget than they receive (net contributors) and those that receive more from the EU budget than they contribute (net beneficiaries).
Key Points from the Map:
- Contributors (Blue):
- These countries give more to the EU budget than they receive back in the form of EU spending.
- Countries in this category include:
- Germany: Gives 0.89% of its GDP.
- France: Gives 0.46% of its GDP.
- Netherlands: Gives 0.71% of its GDP.
- Sweden: Gives 0.73% of its GDP.
- Finland: Gives 0.50% of its GDP.
- Beneficiaries (Red):
- These countries receive more from the EU budget than they contribute.
- Countries in this category include:
- Non-EU Members (Black):
- Countries not part of the EU are shown in black, such as the United Kingdom, Norway, Switzerland, and others.
Interpretation:
- Economic Implications:
- Net contributors generally have stronger economies and are able to provide financial support to other EU member states.
- Net beneficiaries are typically countries that benefit from EU funds aimed at development, infrastructure, and cohesion projects to boost their economies.
- Political Implications:
- The map highlights the economic disparities within the EU, where wealthier countries are net contributors and less wealthy or developing countries are net beneficiaries.
- This balance of contributions and benefits is a fundamental aspect of the EU’s structure, aiming to promote economic convergence and stability across the region.
Data is for 2022, and is from the German Economics Institute:
And note the UK made a net contribution of between £7 and £7.5 billion per year between 2016 and 2019.
| Country | Operational Budget Balance Including NGEU (Million Euro) | Euro per Capita | Share of GDP (%) |
|---|---|---|---|
| Germany | -€ 19,731.03 | -€ 237.05 | -0.89 |
| Sweden | -€ 2,051.45 | -€ 196.27 | -0.73 |
| Netherlands | -€ 3,234.72 | -€ 183.89 | -0.71 |
| Austria | -€ 1,364.34 | -€ 151.95 | -0.61 |
| Denmark | -€ 860.73 | -€ 146.55 | -0.6 |
| Ireland | -€ 997.79 | -€ 197.19 | -0.57 |
| Finland | -€ 798.13 | -€ 143.85 | -0.5 |
| France | -€ 10,023.74 | -€ 147.69 | -0.46 |
| Belgium | € 38.94 | € 3.35 | -0.35 |
| Luxembourg | € 431.71 | € 668.91 | 0.27 |
| Slovenia | € 393.22 | € 186.61 | 0.37 |
| Malta | € 109.28 | € 209.77 | 0.57 |
| Italy | -€ 3,885.48 | -€ 65.82 | 0.58 |
| Czech Republic | € 2,821.52 | € 268.29 | 0.79 |
| Spain | € 1,278.47 | € 26.95 | 0.86 |
| Cyprus | € 253.68 | € 280.41 | 1.14 |
| Portugal | € 2,890.35 | € 279.21 | 1.31 |
| Poland | € 11,932.71 | € 316.90 | 1.62 |
| Slovakia | € 2,162.16 | € 397.84 | 2.27 |
| Romania | € 5,581.08 | € 293.09 | 2.52 |
| Estonia | € 902.88 | € 677.94 | 2.58 |
| Hungary | € 4,443.68 | € 458.63 | 2.59 |
| Lithuania | € 1,719.10 | € 612.65 | 2.63 |
| Greece | € 3,930.31 | € 375.75 | 2.74 |
| Latvia | € 1,022.95 | € 545.35 | 2.84 |
| Bulgaria | € 1,584.45 | € 231.68 | 3.45 |
| Croatia | € 1,450.90 | € 375.66 | 4.01 |


Dav Vandenbroucke says
Posessive “its” has no apostrophe.
stefano says
There is a sign error in Italian data. Italy is a net contributor so the % should be -0.58 instead of 0.58.
Luigi Pianese says
Italy has always been a net contributor, every year. See official EU data.
Marty says
Finland and receives is spelled incorrectly
Franco says
Italy is a net contributor since 1992, only in the year 2022 due to Covid received more. This is a completely useless chart, cherry picking
Kurt says
Belgium gets money (€ 38.94 )