
Seven out of 10 Europeans believe that their country takes in too many migrants, according to a survey carried out by BVA Xsight for ARTE Europe Weekly, a project led by the French-German TV channel ARTE GEIE and which EL PAÍS has participated in, as part of the countdown to the European elections in June.
You can read the full study here.
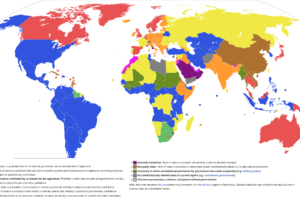
Here are the percentages for each country as indicated on the map:
- Greece: 90%
- Cyprus: 84%
- Ireland: 78%
- Austria: 77%
- Germany: 77%
- Malta: 77%
- Bulgaria: 76%
- Poland: 75%
- Slovenian: 75%
- Italy: 74%
- Belgium: 73%
- Croatia: 73%
- Czech Republic: 72%
- France: 70%
- Spain: 70%
- Sweden: 70%
- Luxembourg: 69%
- Estonia: 68%
- Netherlands: 67%
- Lithuania: 63%
- Finland: 62%
- Latvia: 61%
- Denmark: 57%
- Portugal: 57%
- Romania: 57%
- Slovakia: 57%
- Hungary: 54%
The debate over allowing migrants into the European Union encompasses a wide range of arguments both for and against.
Here are some key points from both sides:
Arguments For Letting Migrants into the EU
- Humanitarian Responsibility: The EU has a moral obligation to help people fleeing war, persecution, and poverty. Providing asylum and protection aligns with international human rights laws and treaties.
- Economic Benefits: Migrants can contribute to the economy by filling labour shortages, especially in sectors like healthcare, agriculture, and construction. An influx of young workers can help offset the aging population and reduce the dependency ratio.
- Cultural Diversity: Migrants bring diverse perspectives, cultures, and skills, which can enrich the social fabric and foster innovation and creativity.
- International Solidarity: Accepting migrants can strengthen the EU’s global standing and demonstrate its commitment to international solidarity and cooperation.
- Demographic Challenges: Many EU countries face declining birth rates and an aging population. Migrants can help counteract these demographic trends and sustain population growth.
Arguments Against Letting Migrants into the EU
- Economic Strain: Critics argue that migrants can strain public services, such as healthcare, education, and housing, especially if they are not integrated effectively or if they arrive in large numbers.
- Cultural Integration: There are concerns about the ability of migrants to integrate into European societies, which can lead to social tensions, segregation, and the rise of nationalist and anti-immigrant sentiments.
- Security Risks: Some argue that allowing migrants increases the risk of terrorism and crime, though this point is often debated and can be based on unfounded fears and stereotypes.
- Employment Competition: There is a fear that migrants may compete with native workers for jobs, potentially driving down wages and increasing unemployment among the local population.
- Political Stability: High levels of immigration can lead to political instability and fuel the rise of populist and far-right parties, which may exploit anti-immigrant sentiment for electoral gains.
Here are some of the countries with the largest and smallest immigrant populations as a share of their total population:
Countries with the Largest Immigrant Populations (as a share of total population)
- Luxembourg: Approximately 47% of the population are immigrants, the highest share in the EU.
- Malta: Around 21% of the population are immigrants.
- Cyprus: About 19% of the population are immigrants.
- Austria: Around 19% of the population are immigrants.
- Sweden: Approximately 19% of the population are immigrants.
Countries with the Smallest Immigrant Populations (as a share of total population)
- Romania: Immigrants make up about 0.6% of the population.
- Poland: Immigrants constitute about 2% of the population.
- Bulgaria: Immigrants account for approximately 2.1% of the population.
- Slovakia: About 2.6% of the population are immigrants.
- Lithuania: Around 2.7% of the population are immigrants.
In terms of absolute numbers, the EU countries with the largest and smallest immigrant populations can differ from those with the largest and smallest shares relative to their total populations. Here are the countries with the largest and smallest immigrant populations in absolute numbers:
Countries with the Largest Immigrant Populations (absolute numbers)
- Germany: Germany hosts the largest number of immigrants in the EU, with approximately 13 million immigrants.
- United Kingdom: Before Brexit, the UK had around 9.5 million immigrants.
- France: France has about 8.5 million immigrants.
- Italy: Italy hosts around 6.2 million immigrants.
- Spain: Spain has approximately 6 million immigrants.
Countries with the Smallest Immigrant Populations (absolute numbers)
- Malta: Despite having a high percentage relative to its population, Malta has a small absolute number of immigrants, around 100,000.
- Luxembourg: Similar to Malta, Luxembourg’s high percentage translates to a small absolute number, approximately 300,000.
- Cyprus: Cyprus has about 220,000 immigrants.
- Estonia: Estonia hosts around 250,000 immigrants.
- Latvia: Latvia has approximately 300,000 immigrants.
These figures illustrate that countries with large populations naturally have higher absolute numbers of immigrants, even if their percentage share of immigrants is lower. Conversely, smaller countries may have a high percentage of immigrants relative to their population, but the absolute number of immigrants remains small.
How do these numbers compare to the US, Canada & Australia
To compare, here are the immigrant populations in absolute numbers and as a share of the total population for the US, Canada, and Australia:
United States
- Absolute Number of Immigrants: Approximately 50.6 million (as of 2020).
- Percentage of Total Population: Around 15%.
Canada
- Absolute Number of Immigrants: Approximately 8.3 million (as of 2021).
- Percentage of Total Population: Around 21%.
Australia
- Absolute Number of Immigrants: Approximately 7.6 million (as of 2021).
- Percentage of Total Population: Around 30%.
How they compare
- United States: The US has a significantly higher absolute number of immigrants compared to any EU country, reflecting its larger population and long history of immigration. However, the percentage of immigrants relative to the total population is comparable to some EU countries with significant immigrant populations.
- Canada: Canada has a smaller absolute number of immigrants than the US but a higher percentage of immigrants relative to its total population. Its percentage is comparable to countries like Malta and Luxembourg in the EU.
- Australia: Australia, with around 30% of its population being immigrants, has one of the highest proportions of immigrants globally, surpassing most EU countries. In absolute terms, its immigrant population is substantial but smaller than the US.
What do you think? Leave your thought below:


Anuschka says
I am not fond of never having data for Switzerland cause they are not part of the EU.
Tony says
It is astonishing that Poland, with a miniscule 2% immigrant population, still has three quarters of their population thinking there are too many of them. That’s a level of xenophobia I’d expect of Japan!