
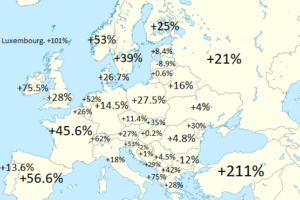
The map shows which countries (and Canadian provinces) have a higher GDP per capita in nominal terms than Mississippi, the poorest US state with a GDP per capita of $53,061 in 2024.
Here is a full list of countries that made the cut:
Data for the following countries comes from the IMF.
- Luxembourg – $140,941
- Ireland – $108,920
- Switzerland $104,896
- Singapore $92,932
- Iceland $90,284
- Norway 89,694
- United States $89,105
- Macau $76,314
- Denmark $74,969
- Qatar $71,653
- Netherlands $70,450
- Australia $64,548
- San Marino $59,603
- Austria $58,192
- Sweden $58,100
- Belgium $57,772
- Israel $57,760
- Hong Kong $56,031
- Germany $55,911
- United Kingdom $54,949
- Finland $54,163
- Canada $53,558
Countries that just failed to make the list include:
- United Arab Emirates $51,294
- France $46,792
- New Zealand $46,126
- Malta $45,735
- Andorra $45,263
In terms of Canadian provinces here’s how they rank (numbers in nominal USD).
Richer:
- Northwest Territories $89,573
- Nunavut $86,613
- Alberta $70,558
- Yukon $69,584
- Saskatchewan $66,276
- British Columbia $54,137
Poorer:
- Newfoundland and Labrador $52,817
- Ontario $52,354
- Quebec $47,847
- Manitoba $46,140
- Prince Edward Island $41,738
- New Brunswick $41,294
- Nova Scotia $41,198
Finally the following countries did not have data from the IMF but are likely richer:
- Monaco
- Liechtenstein
- Bermuda
- Cayman Islands
- Isle of Man
- Channel Islands
- Faroe Islands
- Greenland
Surprised by any of these?


Leave a Reply