Brilliant Maps

Making Sense Of The World, One Map At A Time

  • BOOK!
  • Newsletter
  • Board Games
  • Posters
  • Scratch Maps

Population Growth In European Countries Between 1960 & 2020

December 13, 2021 2 Comments

Population Growth In European Countries Between 1960 & 2020

Map created by reddit user Lambda301

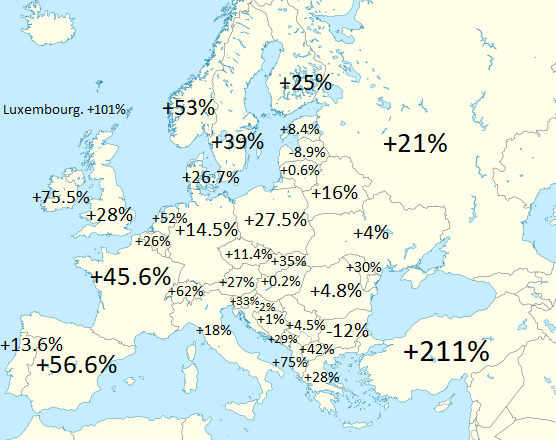
The map above shows the population increase (or decrease of various European countries between 1960 and 2020). Globally world population increased from 3.03 billion to 7.79 billion or a 157% increase.

Turkey was the only country to exceed that amount at 211%.

All but 3 countries (Bulgaria, Latvia and Croatia) saw some population growth.

Data comes from the World Bank.

Filed Under: Europe

Comments

  1. Aca says

    December 14, 2021 at 10:32 pm

    This is falls serbia hade it’s biggest population in 1989 and Hase lost millions of peopel since then.

    Reply
    • Andy says

      January 26, 2022 at 5:22 pm

      The 1% increase for Serbia merely indicates the difference from 1960 to 2020. It’s interesting the learn that so many have left since the fall of Tito.

      Reply

Leave a Reply Cancel reply

Your email address will not be published. Required fields are marked *

This site uses Akismet to reduce spam. Learn how your comment data is processed.


World Atlas · Settlers of Catan · Risk · Game of Thrones · Coloring Books · Globes
Monopoly · Star Wars · Game of Life · Pandemic · Ticket To Ride · Drinks Cabinets
Copyright © 2023 · Privacy Policy · Fair Use, Attribution & Copyright · Contact Us
Follow Us: E-mail · Twitter · Facebook · Pinterest · Flipboard