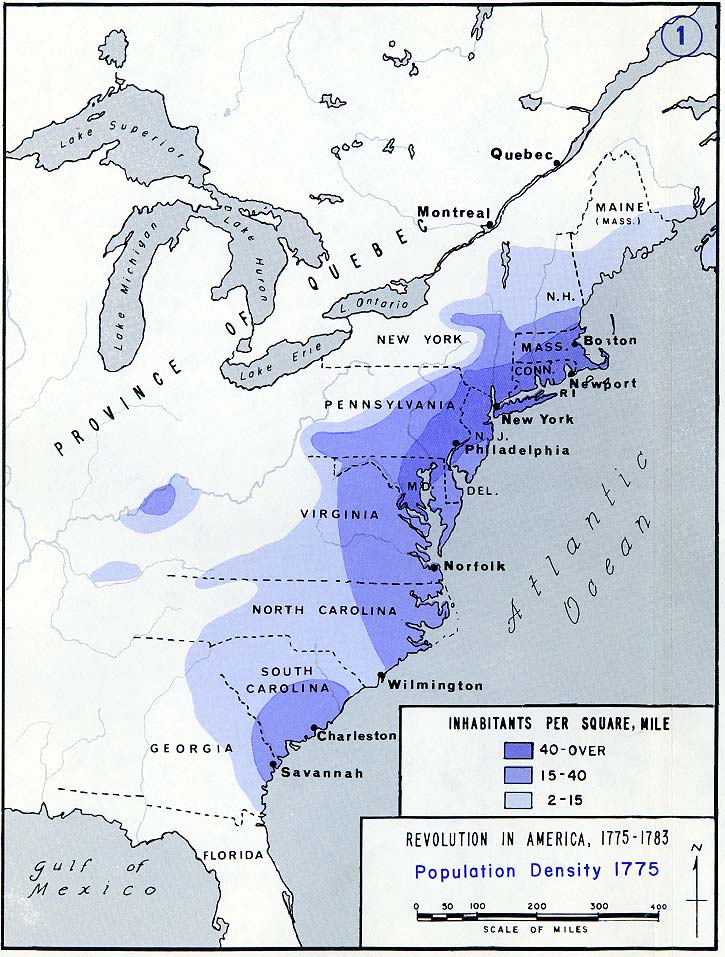
The map above shows the population density of the original thirteen American colonies, the year before they declared independence. Even back then, what would become the Boston–Washington Corridor was clearly evident.
While the map maker does not specify, the map likely only includes white colonists in their population figures, thus excluding Slaves and Native Americans.
To put those numbers in some perspective, the densest areas in 1775 had slightly over 40 inhabitants per square mile (although density would have been higher in cities), whereas the Boston–Washington Corridor today has a density of over 930 inhabitants per square mile and the entire country has an average density of 91 people per square mile (including Alaska).
Overall, there were estimated to be only 2.5 million people living in the original thirteen colonies in 1776, although that number should be taken with a grain of salt since the first census did not occur until 1790. As of early 2017, the US population is just shy of 325 million people, a 130X increase over 241 years.
To learn more about the history of this period, have a look at the following books:
- The Thirteen Colonies
- The History of the Thirteen Colonies of North America 1497-1763
- A People’s History of the United States
- Lies My Teacher Told Me: Everything Your American History Textbook Got Wrong
- American Nations: A History of the Eleven Rival Regional Cultures of North America
Find this map interesting? Please help us by sharing it:


Rodney Smith says
What is the population concentration along the Ohio River between Cincinnati and Louisville? I thought it would be one city or the other but it looks like both were founded after 1775
enoriverbend says
I had the same question. You’re right about Louisville. Could it be a slightly misplaced area with Boonesborough and Stanford (Logan’s Fort) and Harrodsburg (Fort Harrod)? That’s south of the illustration, but…
Doug Heath says
I suspect that the map is incorrect, perhaps because that population center developed at a slightly later date. It was only in March of 1775 that Daniel Boone was sent with his axeman to transform an Indian path through the Cumberland Gap and across the Cumberland Plateau into the wagon road reaching the eastern edge of the Bluegrass Basin. This road still did not extend far enough west to reach the Ohio River or the shaded area of the map indicating 15-40 European-Americans per square mile, but it was the first Euro-American penetration of the proposed state of Transylvania and the eventual state of Kentucky. (source: p 293 of D. W. Meinig’s Atlantic America, which is Volume 1 of The Shaping of America, published by Yale University Press, 1986)
saacnmama says
I’m disappointed that you’d desseminate this map. Figures for enslaved population are available. Adding them would make the results much more useful. Erasing them from the map is problematic in many ways.
Mark Powell says
I agree with saacnmama, I’m disappointed that this map is used without more than a note saying it only includes whites.
Rick says
That’s not true. The estimated population is 2,500,000 EXCLUDING INDIANS. Blacks ARE INCLUDED in that number and were estimated to be 460,000 at the time.
ccgordon says
Does anyone know the total population count for each of the colonies in 1776? That would need to have been known to generate a density (or estimated density) map, but I can’t find a source for counts by colony. I am in particularly interested in the total population of Georgia in 1776. Thanks in advance for any help you can offer.
Ron van Oijen says
Historical estimates by decade for the populations of each of the colonies in the area that would later constitute the US can be found here:
https://www2.census.gov/prod2/decennial/documents/00165897ch01.pdf
The period runs from 1610 through 1790. These estimates seem to be the best effort to date.