The maps below all show countries that were richer than the United States in inflation adjusts GDP per capita terms in 1980 based on the IMF’s Gross domestic product (GDP), Constant prices, Per capita, purchasing power parity (PPP) international dollar, ICP benchmark 2021.
More about it at the bottom of the page.
The year was rather unique due to the 1979-80 oil crisis.
This temporarily increased inflation adjusted GDP per capita in some countries such as the UAE, Qatar, Bahrain, Saudi Arabia and Libya to levels higher than they are today.
Overall, in 1980 there were 15 countries that were richer than the US in $PPP inflation adjusted terms and today there are only 10.
Countries Richer Than The US in 1980 & Still Richer Today
Qatar vs US GDP Per Capita

Switzerland vs US GDP Per Capita

Luxembourg vs US GDP Per Capita

Norway vs US GDP Per Capita

Countries Richer Than The US in 1980 & Poorer Today
UAE vs US GDP per Capita

Saudi Arabia vs US GDP per Capita

Libya vs US GDP per Capita

Bahrain vs US GDP per Capita

Denmark vs US GDP per Capita

Iceland vs US GDP per Capita

Netherlands vs US GDP per Capita

Austria vs US GDP per Capita

Belgium vs US GDP per Capita

Germany vs US GDP per Capita

Countries Poorer Than The US in 1980 & Richer Today
Of the 10 countries richer than the US today 6 of them were poorer (or had no data) in 1980. Here are the countries for which we have data.
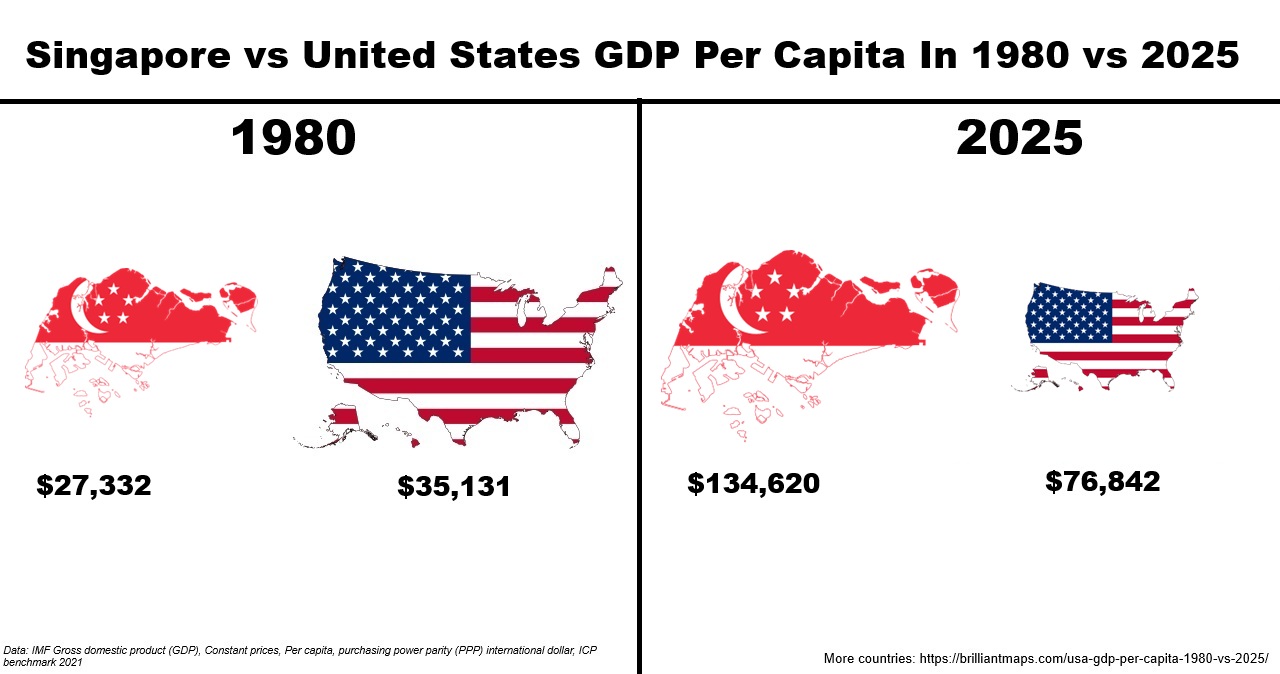
Singapore vs US GDP Per Capita
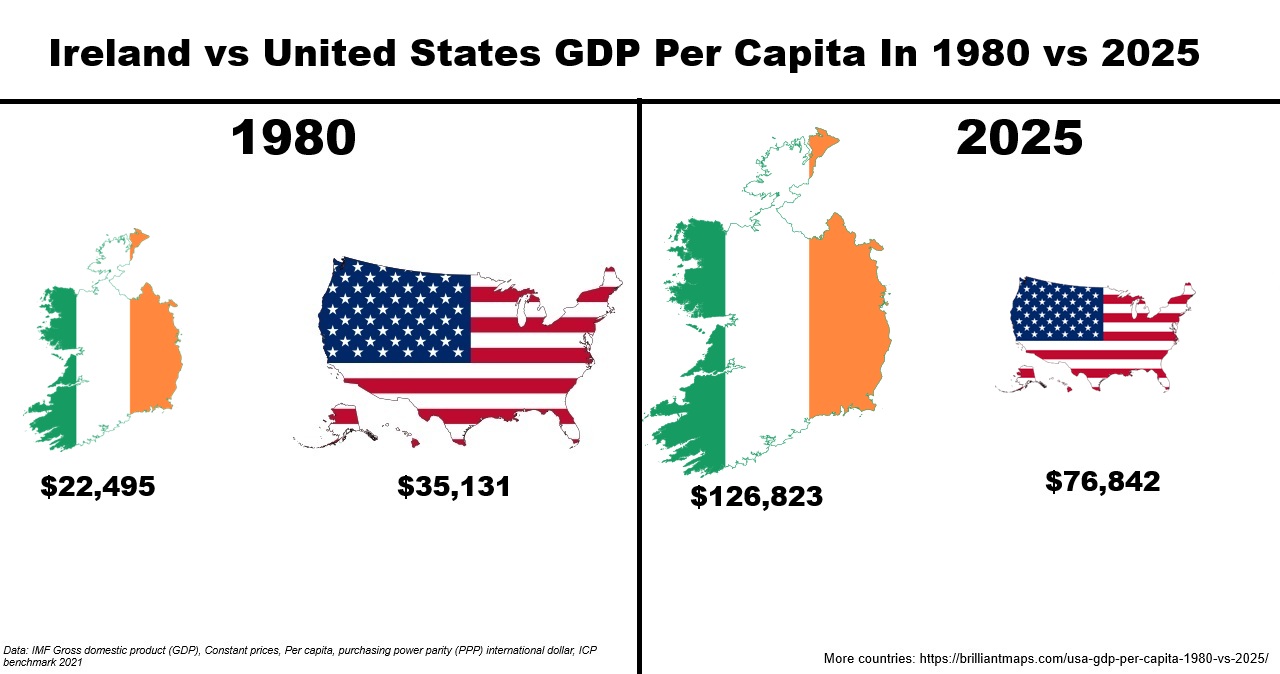
Ireland vs US GDP Per Capita
Guyana vs US GDP Per Capita

The countries without data for 1980 are:
- Brunei Darussalam
- Principality of Liechtenstein
- Macao Special Administrative Region, People’s Republic of China
Some Extra Comparisons
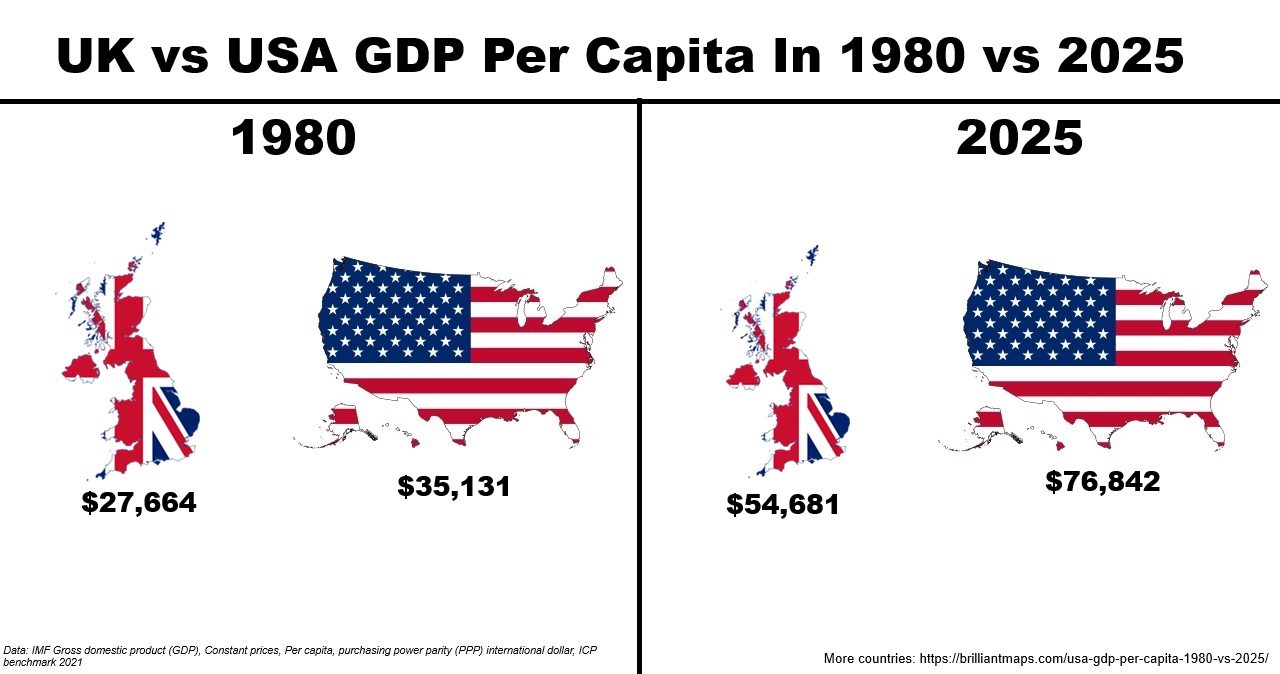
UK vs US GDP Per Capita
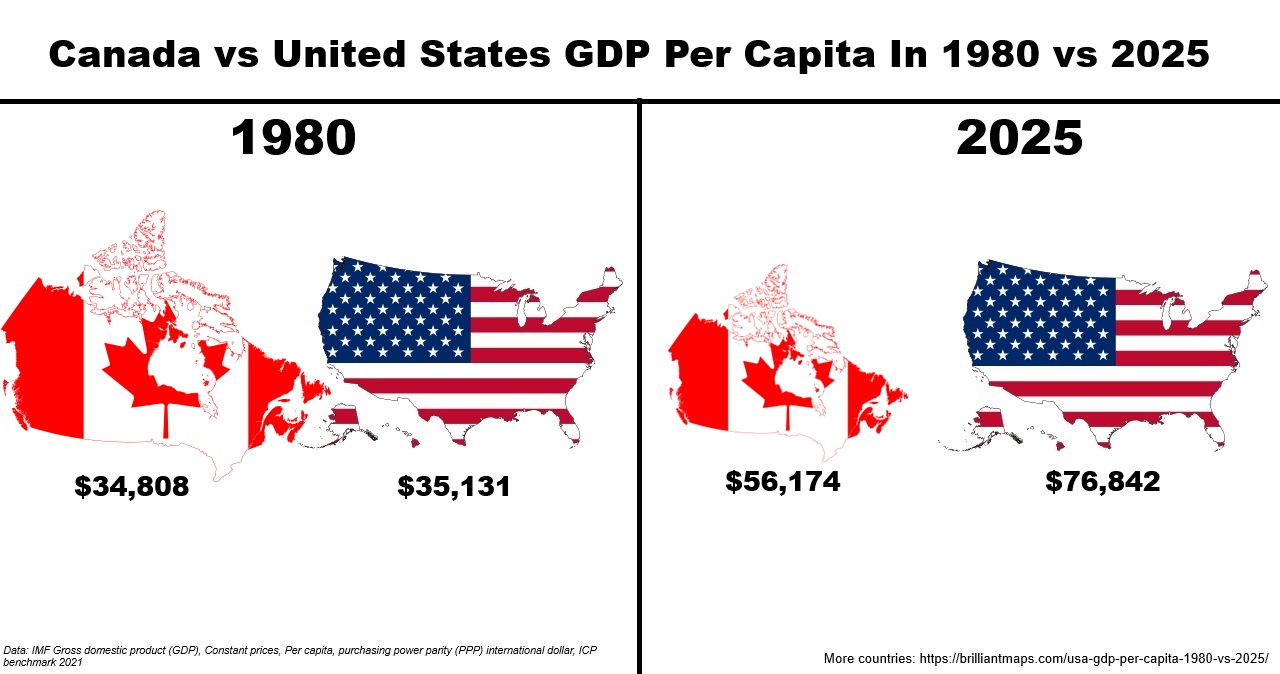
Canada vs US GDP Per Capita
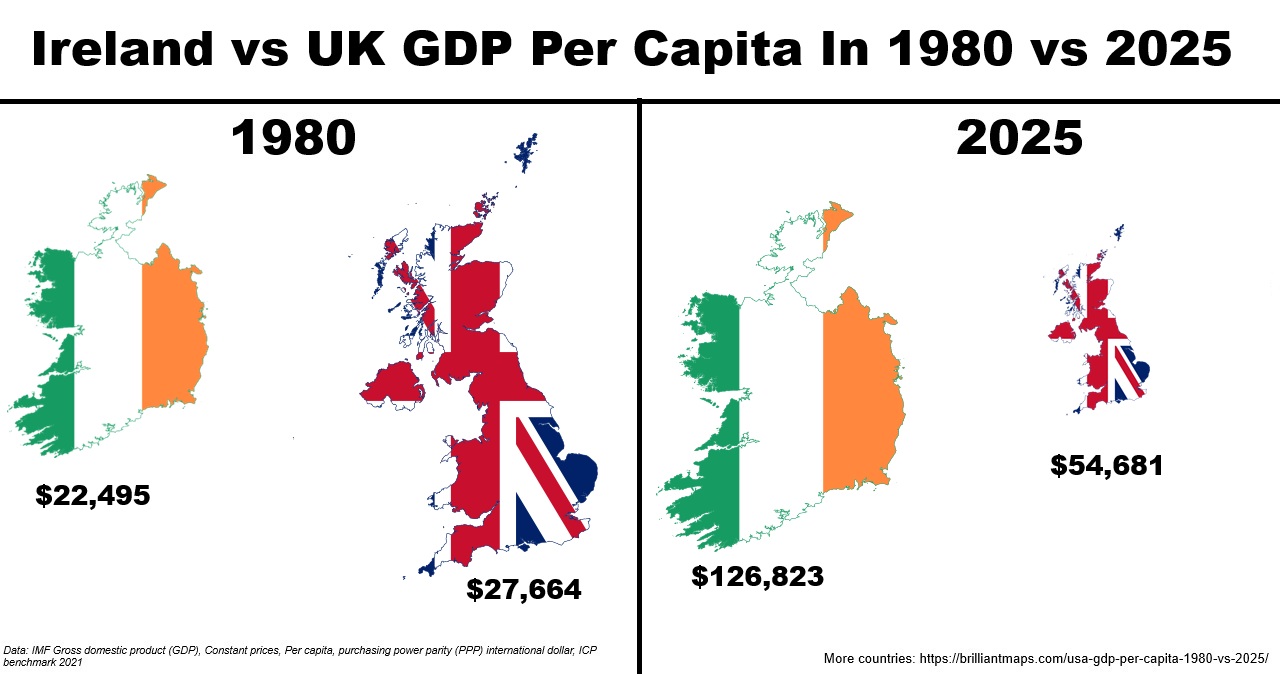
Ireland vs UK GDP per Capita
Here are the numbers for all countries:
| Country | GDP Per Capita In 1980 | GDP Per Capita In 2025 |
|---|---|---|
| United Arab Emirates | $166,452 | $72,386 |
| Qatar | $164,972 | $104,873 |
| Saudi Arabia | $104,974 | $64,037 |
| Switzerland | $55,240 | $83,755 |
| Libya | $52,052 | $15,378 |
| Luxembourg | $51,759 | $130,697 |
| Bahrain | $50,652 | $59,408 |
| Norway | $46,032 | $91,503 |
| Denmark | $37,449 | $72,694 |
| Iceland | $37,105 | $69,010 |
| The Netherlands | $36,588 | $72,070 |
| Austria | $36,350 | $64,195 |
| Belgium | $35,217 | $65,078 |
| Germany | $35,144 | $63,081 |
| United States | $35,131 | $76,842 |
| Canada | $34,808 | $56,174 |
| United Kingdom | $27,664 | $54,681 |
| Singapore | $27,322 | $134,620 |
| Ireland | $22,495 | $126,823 |
| Guyana | $6,941 | $80,779 |
| Liechtenstein | No data | $172,478 |
| Macao | No Data | $113,762 |
| Brunei Darussalam | No Data | $81,022 |
The World Bank Explains how these numbers are derived:
This indicator provides values for gross domestic product (GDP) expressed in constant international dollars, converted by purchasing power parities (PPPs).
PPPs account for the different price levels across countries and thus PPP-based comparisons of economic output are more appropriate for comparing the output of economies and the average material well-being of their inhabitants than exchange-rate based comparisons.
Gross domestic product is the total income earned through the production of goods and services in an economic territory during an accounting period.
It can be measured in three different ways: using either the expenditure approach, the income approach, or the production approach.
The core indicator has been divided by the general population to achieve a per capita estimate.
This indicator is expressed in constant prices, meaning the series has been adjusted to account for price changes over time.
The reference year for this adjustment is 2021. The PPP conversion factor is a currency conversion factor and a spatial price deflator.
PPPs convert different currencies to a common currency and, in the process of conversion, equalize their purchasing power by eliminating the differences in price levels between countries, thereby allowing volume or output comparisons of GDP and its expenditure components.


Pamar says
You always know how to deliver quality content that resonates
Y.D. Robinson says
Is it possible that for 1980, you’re mixing up with figures from a later decade (though obviously not now in 2025)?
For example, in 1980, the per capita GDP for the United States was $7000-8000 in 1980 US dollars, that of Saudi Arabia was some $2500, that of Denmark was some $6000, and that of Singapore was some $2500 – not $35,131, $104,974, $37,499, and $27,322, respectively.
Unless we’re talking about the 1980 figures in today’s dollars or close to it?!
Brilliant Maps says
As stated in the article, this is not nominal dollars but: IMF’s Gross domestic product (GDP), Constant prices, Per capita, purchasing power parity (PPP) international dollar, ICP benchmark 2021. This indicator provides values for gross domestic product (GDP) expressed in constant international dollars, converted by purchasing power parities (PPPs).